
Read page 1 text
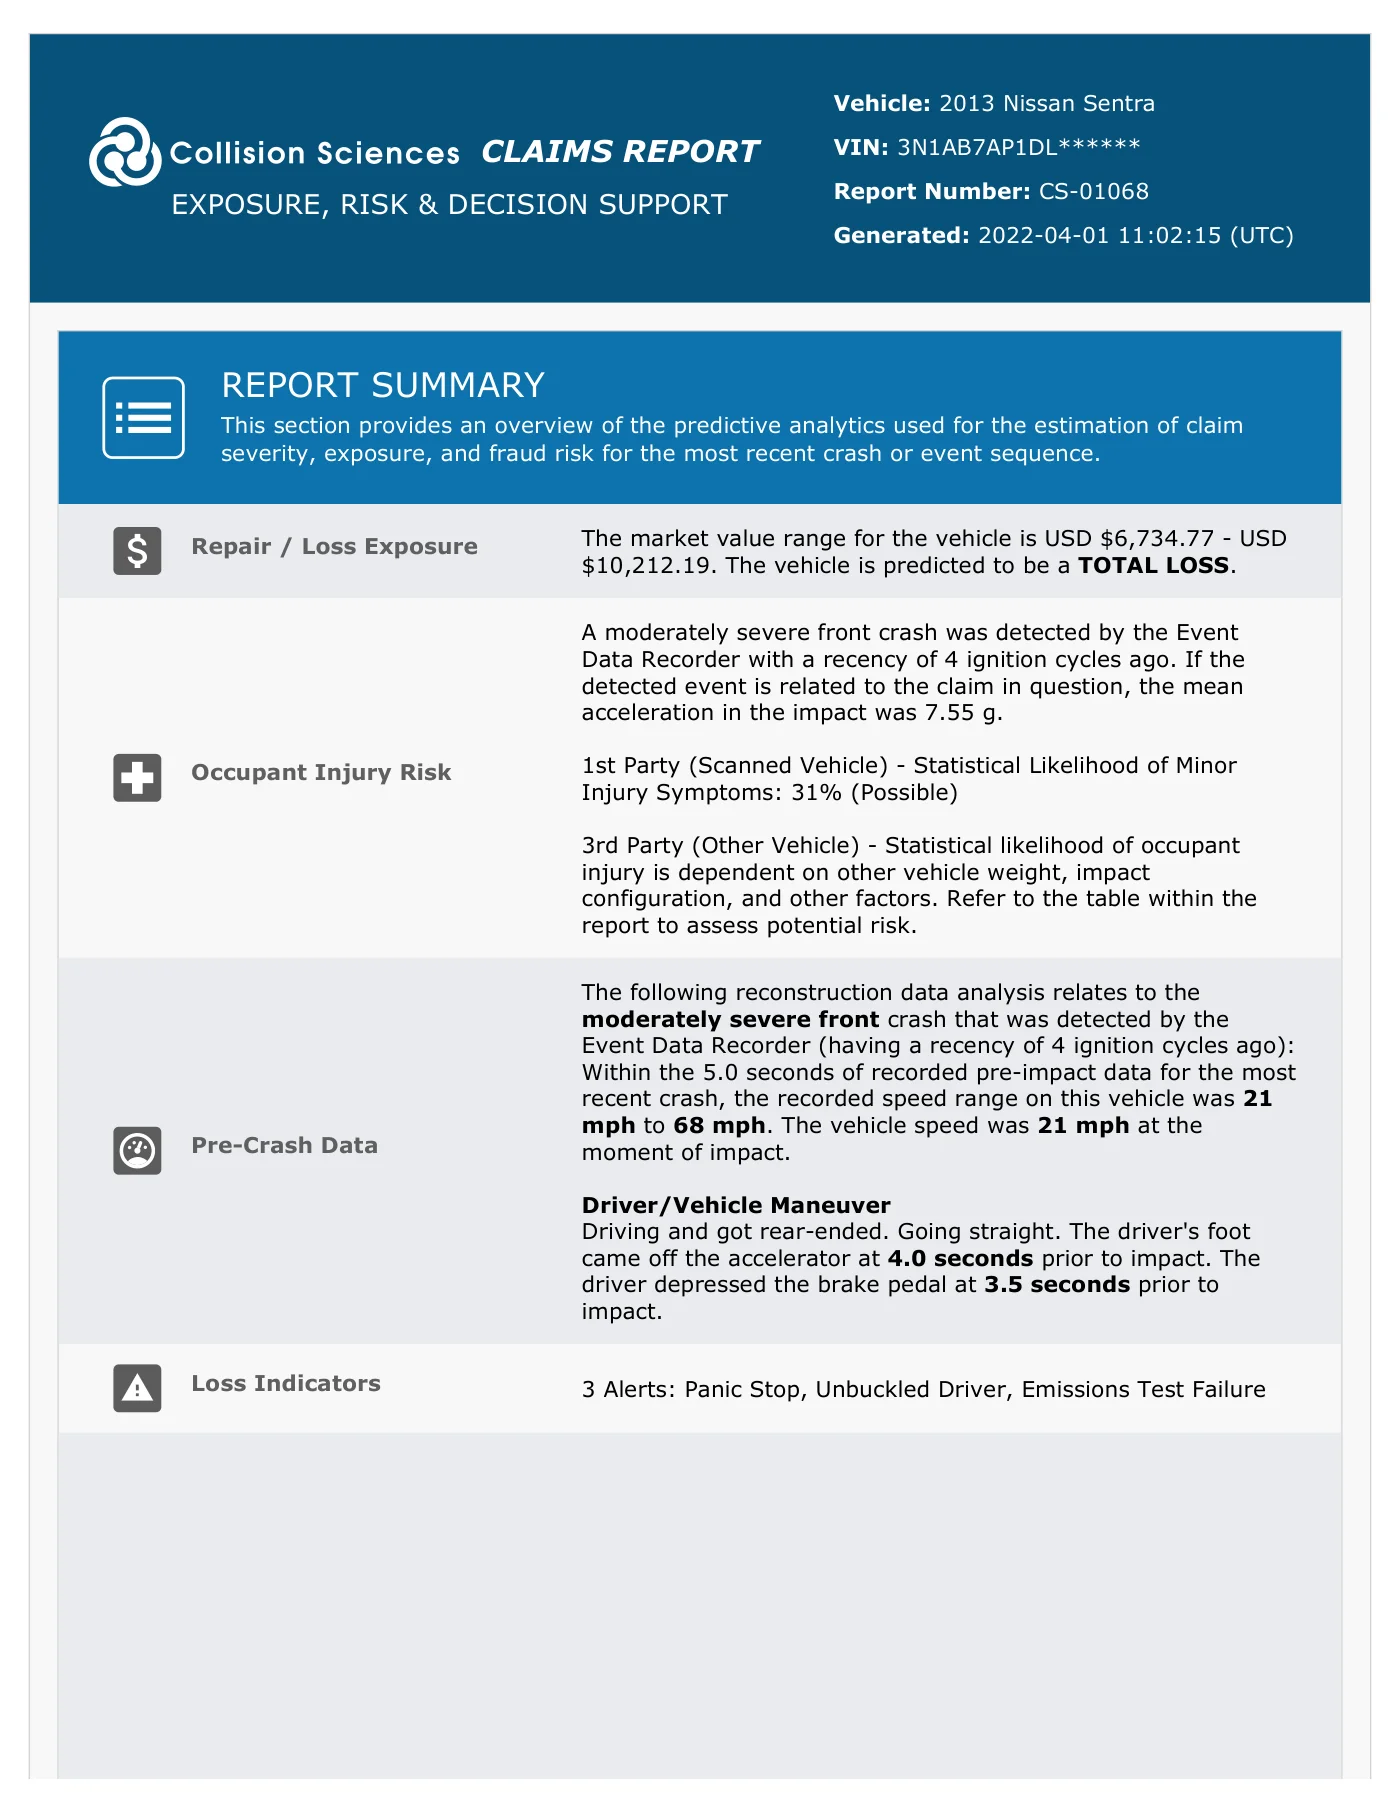
REPORT SUMMARY This section provides an overview of the predictive analytics used for the estimation of claim severity, exposure, and fraud risk for the most recent crash or event sequence. Repair / Loss Exposure The market value range for the vehicle is USD $6,734.77 - USD $10,212.19. The vehicle is predicted to be a TOTAL LOSS. Occupant Injury Risk A moderately severe front crash was detected by the Event Data Recorder with a recency of 4 ignition cycles ago. If the detected event is related to the claim in question, the mean acceleration in the impact was 7.55 g. 1st Party (Scanned Vehicle) - Statistical Likelihood of Minor Injury Symptoms: 31% (Possible) 3rd Party (Other Vehicle) - Statistical likelihood of occupant injury is dependent on other vehicle weight, impact configuration, and other factors. Refer to the table within the report to assess potential risk. Pre-Crash Data The following reconstruction data analysis relates to the moderately severe front crash that was detected by the Event Data Recorder (having a recency of 4 ignition cycles ago): Within the 5.0 seconds of recorded pre-impact data for the most recent crash, the recorded speed range on this vehicle was 21 mph to 68 mph. The vehicle speed was 21 mph at the moment of impact. Driver/Vehicle Maneuver Driving and got rear-ended. Going straight. The driver's foot came off the accelerator at 4.0 seconds prior to impact. The driver depressed the brake pedal at 3.5 seconds prior to impact. Loss Indicators 3 Alerts: Panic Stop, Unbuckled Driver, Emissions Test Failure CLAIMS REPORT EXPOSURE, RISK & DECISION SUPPORT Vehicle: 2013 Nissan Sentra VIN: 3N1AB7AP1DL****** Report Number: CS-01068 Generated: 2022-04-01 11:02:15 (UTC)
Read page 2 text
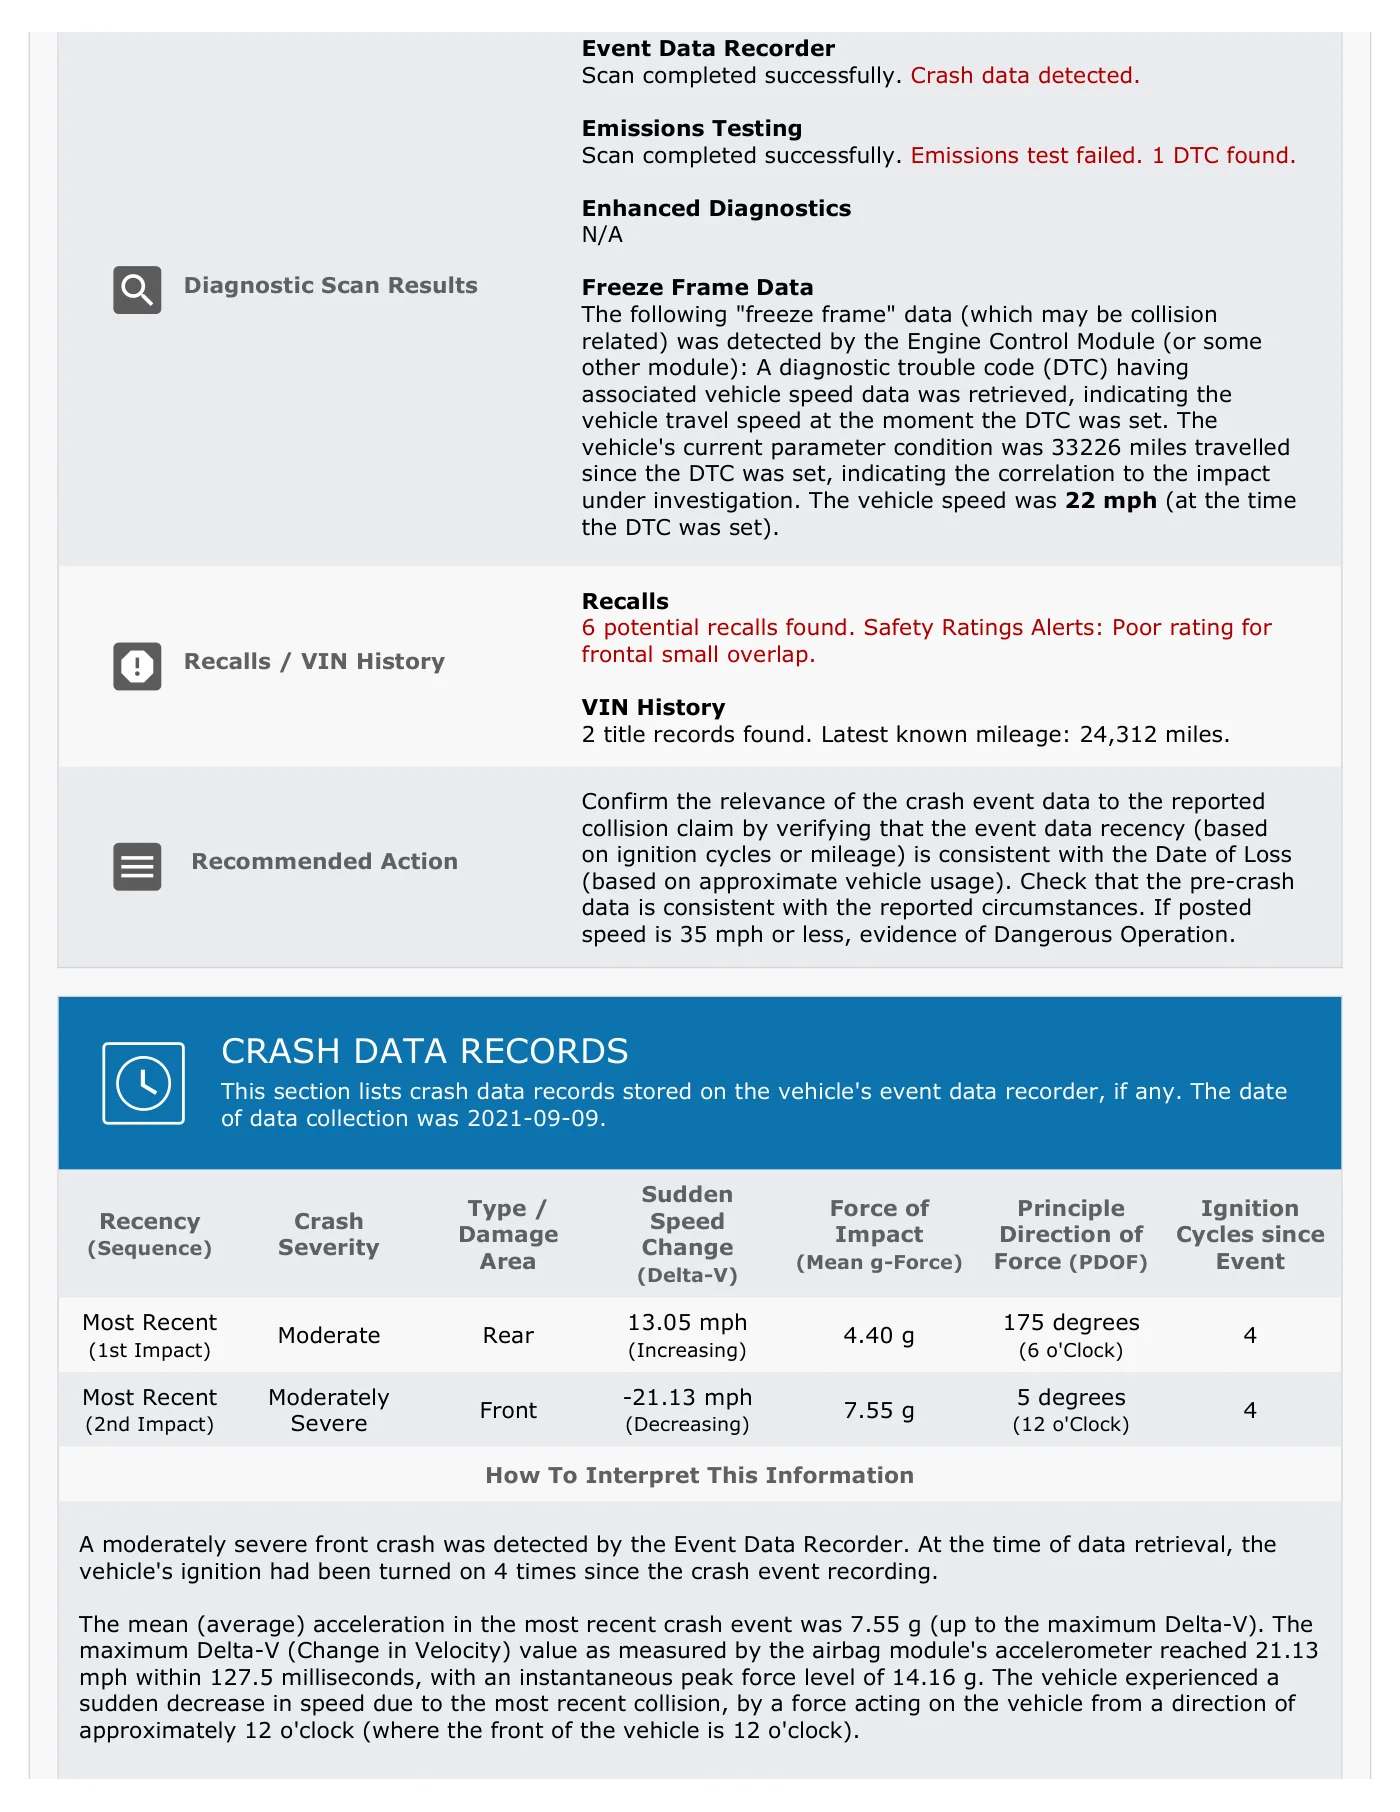
Diagnostic Scan Results Event Data Recorder Scan completed successfully. Crash data detected. Emissions Testing Scan completed successfully. Emissions test failed. 1 DTC found. Enhanced Diagnostics N/A Freeze Frame Data The following "freeze frame" data (which may be collision related) was detected by the Engine Control Module (or some other module): A diagnostic trouble code (DTC) having associated vehicle speed data was retrieved, indicating the vehicle travel speed at the moment the DTC was set. The vehicle's current parameter condition was 33226 miles travelled since the DTC was set, indicating the correlation to the impact under investigation. The vehicle speed was 22 mph (at the time the DTC was set). Recalls / VIN History Recalls 6 potential recalls found. Safety Ratings Alerts: Poor rating for frontal small overlap. VIN History 2 title records found. Latest known mileage: 24,312 miles. Recommended Action Confirm the relevance of the crash event data to the reported collision claim by verifying that the event data recency (based on ignition cycles or mileage) is consistent with the Date of Loss (based on approximate vehicle usage). Check that the pre-crash data is consistent with the reported circumstances. If posted speed is 35 mph or less, evidence of Dangerous Operation. CRASH DATA RECORDS This section lists crash data records stored on the vehicle's event data recorder, if any. The date of data collection was 2021-09-09. Recency (Sequence) Crash Severity Type / Damage Area Sudden Speed Change (Delta-V) Force of Impact (Mean g-Force) Principle Direction of Force (PDOF) Ignition Cycles since Event Most Recent (1st Impact) Moderate Rear 13.05 mph (Increasing) 4.40 g 175 degrees (6 o'Clock) 4 Most Recent (2nd Impact) Moderately Severe Front -21.13 mph (Decreasing) 7.55 g 5 degrees (12 o'Clock) 4 How To Interpret This Information A moderately severe front crash was detected by the Event Data Recorder. At the time of data retrieval, the vehicle's ignition had been turned on 4 times since the crash event recording. The mean (average) acceleration in the most recent crash event was 7.55 g (up to the maximum Delta-V). The maximum Delta-V (Change in Velocity) value as measured by the airbag module's accelerometer reached 21.13 mph within 127.5 milliseconds, with an instantaneous peak force level of 14.16 g. The vehicle experienced a sudden decrease in speed due to the most recent collision, by a force acting on the vehicle from a direction of approximately 12 o'clock (where the front of the vehicle is 12 o'clock).
Read page 3 text
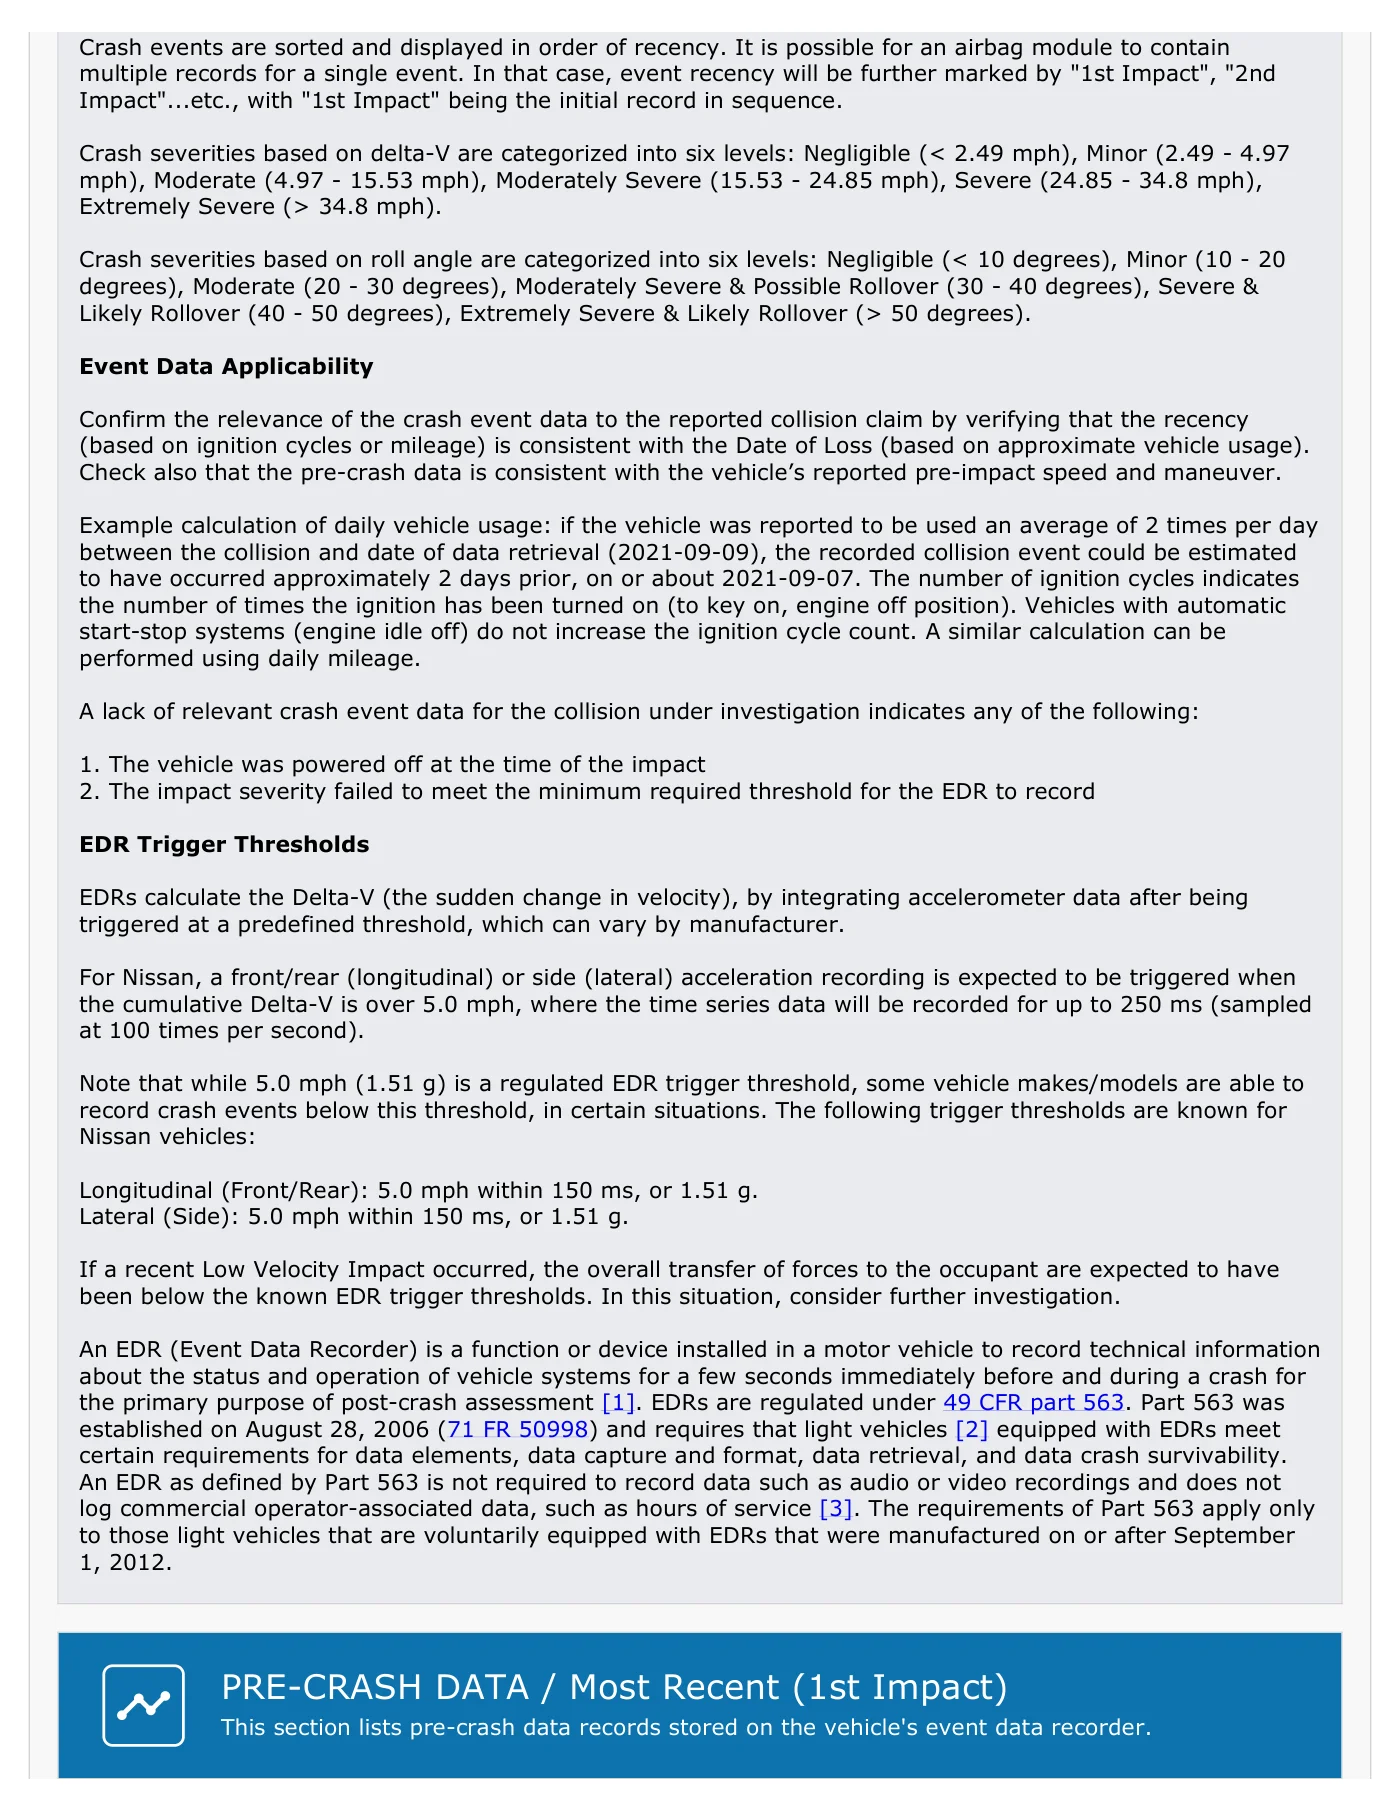
Crash events are sorted and displayed in order of recency. It is possible for an airbag module to contain multiple records for a single event. In that case, event recency will be further marked by "1st Impact", "2nd Impact"...etc., with "1st Impact" being the initial record in sequence. Crash severities based on delta-V are categorized into six levels: Negligible (< 2.49 mph), Minor (2.49 - 4.97 mph), Moderate (4.97 - 15.53 mph), Moderately Severe (15.53 - 24.85 mph), Severe (24.85 - 34.8 mph), Extremely Severe (> 34.8 mph). Crash severities based on roll angle are categorized into six levels: Negligible (< 10 degrees), Minor (10 - 20 degrees), Moderate (20 - 30 degrees), Moderately Severe & Possible Rollover (30 - 40 degrees), Severe & Likely Rollover (40 - 50 degrees), Extremely Severe & Likely Rollover (> 50 degrees). Event Data Applicability Confirm the relevance of the crash event data to the reported collision claim by verifying that the recency (based on ignition cycles or mileage) is consistent with the Date of Loss (based on approximate vehicle usage). Check also that the pre-crash data is consistent with the vehicle’s reported pre-impact speed and maneuver. Example calculation of daily vehicle usage: if the vehicle was reported to be used an average of 2 times per day between the collision and date of data retrieval (2021-09-09), the recorded collision event could be estimated to have occurred approximately 2 days prior, on or about 2021-09-07. The number of ignition cycles indicates the number of times the ignition has been turned on (to key on, engine off position). Vehicles with automatic start-stop systems (engine idle off) do not increase the ignition cycle count. A similar calculation can be performed using daily mileage. A lack of relevant crash event data for the collision under investigation indicates any of the following: 1. The vehicle was powered off at the time of the impact 2. The impact severity failed to meet the minimum required threshold for the EDR to record EDR Trigger Thresholds EDRs calculate the Delta-V (the sudden change in velocity), by integrating accelerometer data after being triggered at a predefined threshold, which can vary by manufacturer. For Nissan, a front/rear (longitudinal) or side (lateral) acceleration recording is expected to be triggered when the cumulative Delta-V is over 5.0 mph, where the time series data will be recorded for up to 250 ms (sampled at 100 times per second). Note that while 5.0 mph (1.51 g) is a regulated EDR trigger threshold, some vehicle makes/models are able to record crash events below this threshold, in certain situations. The following trigger thresholds are known for Nissan vehicles: Longitudinal (Front/Rear): 5.0 mph within 150 ms, or 1.51 g. Lateral (Side): 5.0 mph within 150 ms, or 1.51 g. If a recent Low Velocity Impact occurred, the overall transfer of forces to the occupant are expected to have been below the known EDR trigger thresholds. In this situation, consider further investigation. An EDR (Event Data Recorder) is a function or device installed in a motor vehicle to record technical information about the status and operation of vehicle systems for a few seconds immediately before and during a crash for the primary purpose of post-crash assessment [1]. EDRs are regulated under 49 CFR part 563. Part 563 was established on August 28, 2006 (71 FR 50998) and requires that light vehicles [2] equipped with EDRs meet certain requirements for data elements, data capture and format, data retrieval, and data crash survivability. An EDR as defined by Part 563 is not required to record data such as audio or video recordings and does not log commercial operator-associated data, such as hours of service [3]. The requirements of Part 563 apply only to those light vehicles that are voluntarily equipped with EDRs that were manufactured on or after September 1, 2012. PRE-CRASH DATA / Most Recent (1st Impact) This section lists pre-crash data records stored on the vehicle's event data recorder.
Read page 4 text
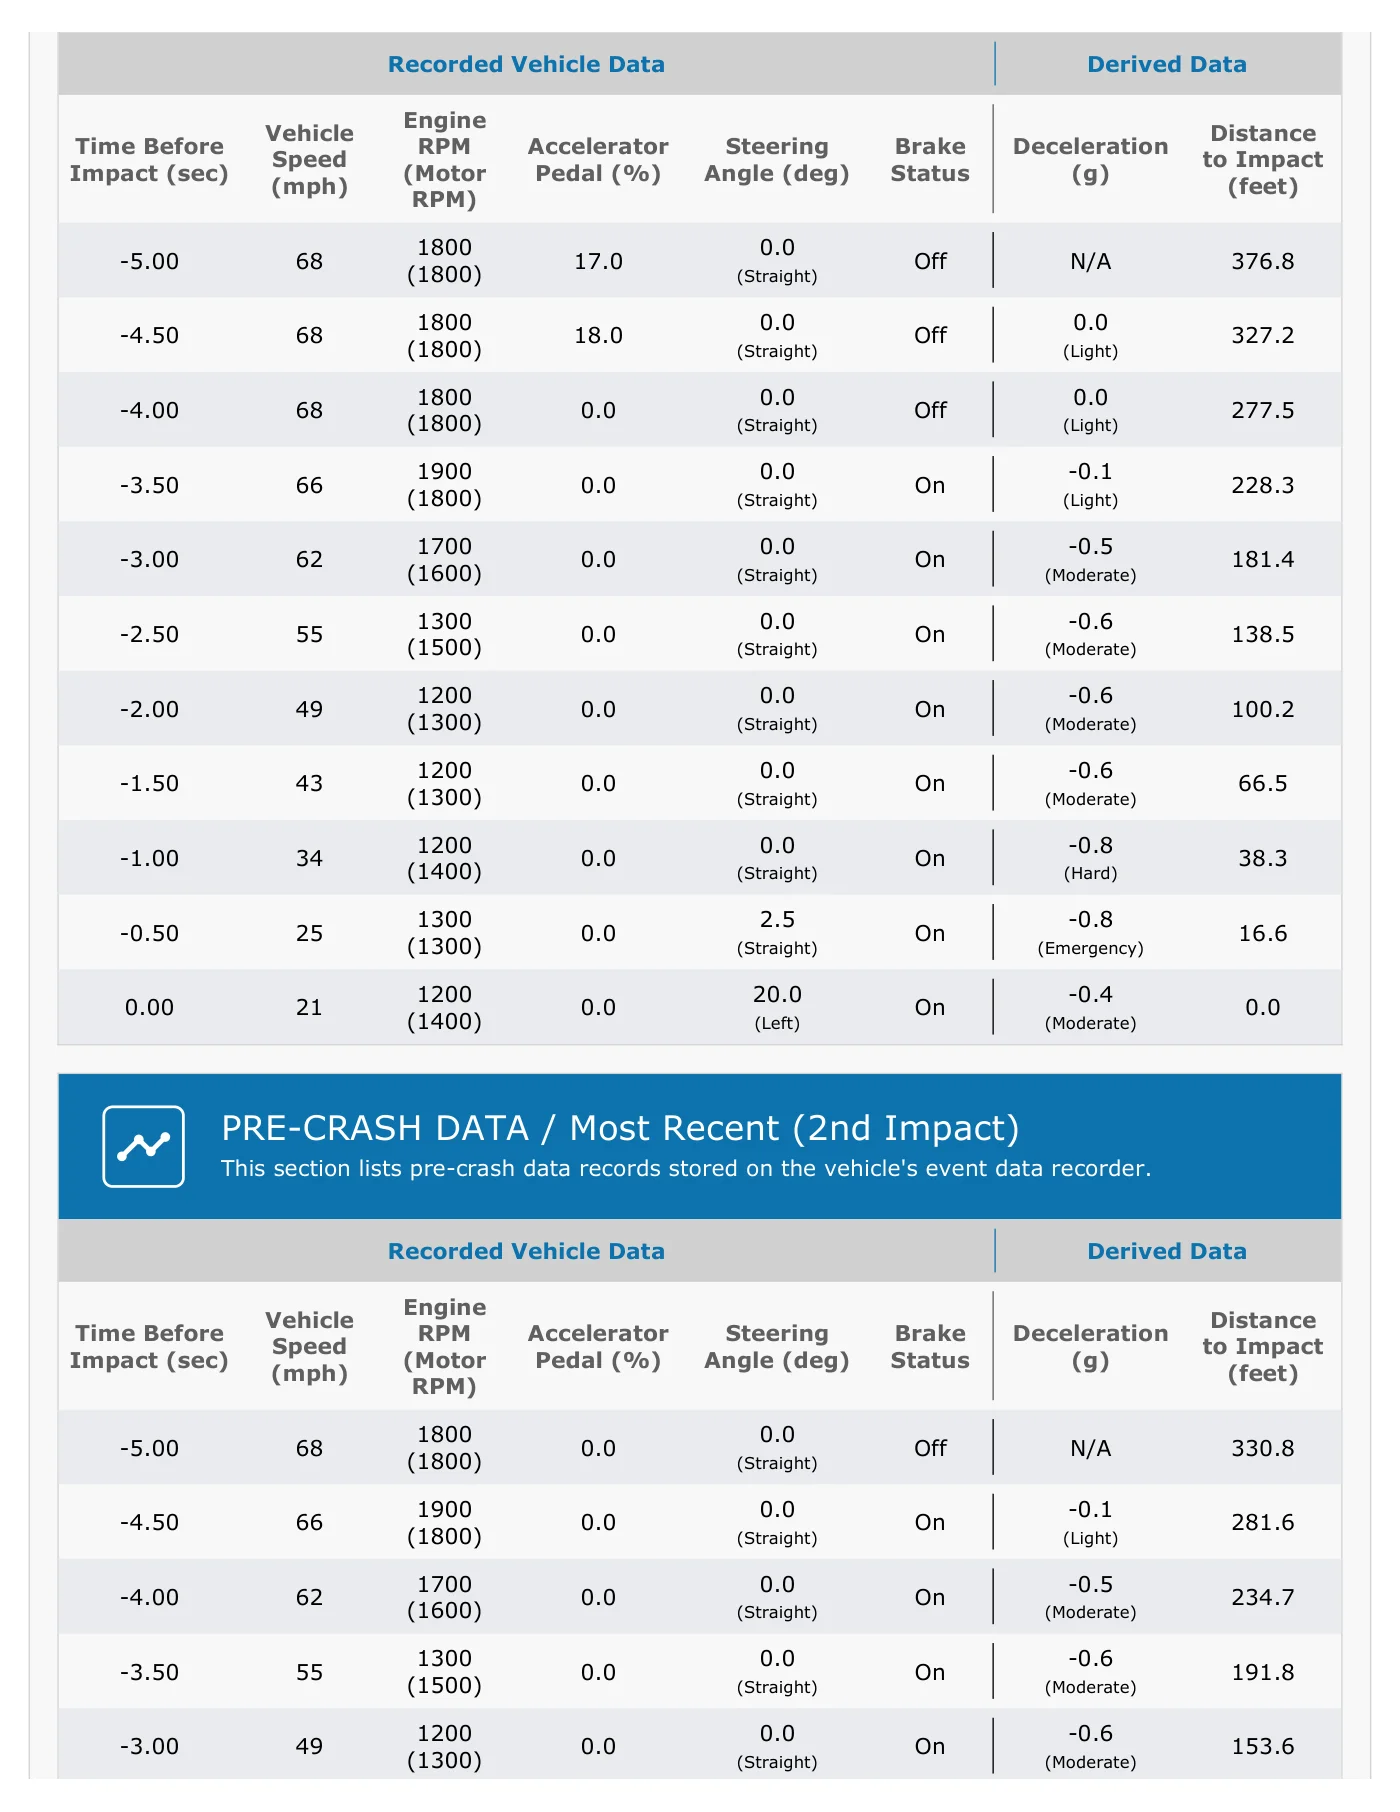
Recorded Vehicle Data Derived Data Time Before Impact (sec) Vehicle Speed (mph) Engine RPM (Motor RPM) Accelerator Pedal (%) Steering Angle (deg) Brake Status Deceleration (g) Distance to Impact (feet) -5.00 68 1800 (1800) 17.0 0.0 (Straight) Off N/A 376.8 -4.50 68 1800 (1800) 18.0 0.0 (Straight) Off 0.0 (Light) 327.2 -4.00 68 1800 (1800) 0.0 0.0 (Straight) Off 0.0 (Light) 277.5 -3.50 66 1900 (1800) 0.0 0.0 (Straight) On -0.1 (Light) 228.3 -3.00 62 1700 (1600) 0.0 0.0 (Straight) On -0.5 (Moderate) 181.4 -2.50 55 1300 (1500) 0.0 0.0 (Straight) On -0.6 (Moderate) 138.5 -2.00 49 1200 (1300) 0.0 0.0 (Straight) On -0.6 (Moderate) 100.2 -1.50 43 1200 (1300) 0.0 0.0 (Straight) On -0.6 (Moderate) 66.5 -1.00 34 1200 (1400) 0.0 0.0 (Straight) On -0.8 (Hard) 38.3 -0.50 25 1300 (1300) 0.0 2.5 (Straight) On -0.8 (Emergency) 16.6 0.00 21 1200 (1400) 0.0 20.0 (Left) On -0.4 (Moderate) 0.0 PRE-CRASH DATA / Most Recent (2nd Impact) This section lists pre-crash data records stored on the vehicle's event data recorder. Recorded Vehicle Data Derived Data Time Before Impact (sec) Vehicle Speed (mph) Engine RPM (Motor RPM) Accelerator Pedal (%) Steering Angle (deg) Brake Status Deceleration (g) Distance to Impact (feet) -5.00 68 1800 (1800) 0.0 0.0 (Straight) Off N/A 330.8 -4.50 66 1900 (1800) 0.0 0.0 (Straight) On -0.1 (Light) 281.6 -4.00 62 1700 (1600) 0.0 0.0 (Straight) On -0.5 (Moderate) 234.7 -3.50 55 1300 (1500) 0.0 0.0 (Straight) On -0.6 (Moderate) 191.8 -3.00 49 1200 (1300) 0.0 0.0 (Straight) On -0.6 (Moderate) 153.6
Read page 5 text
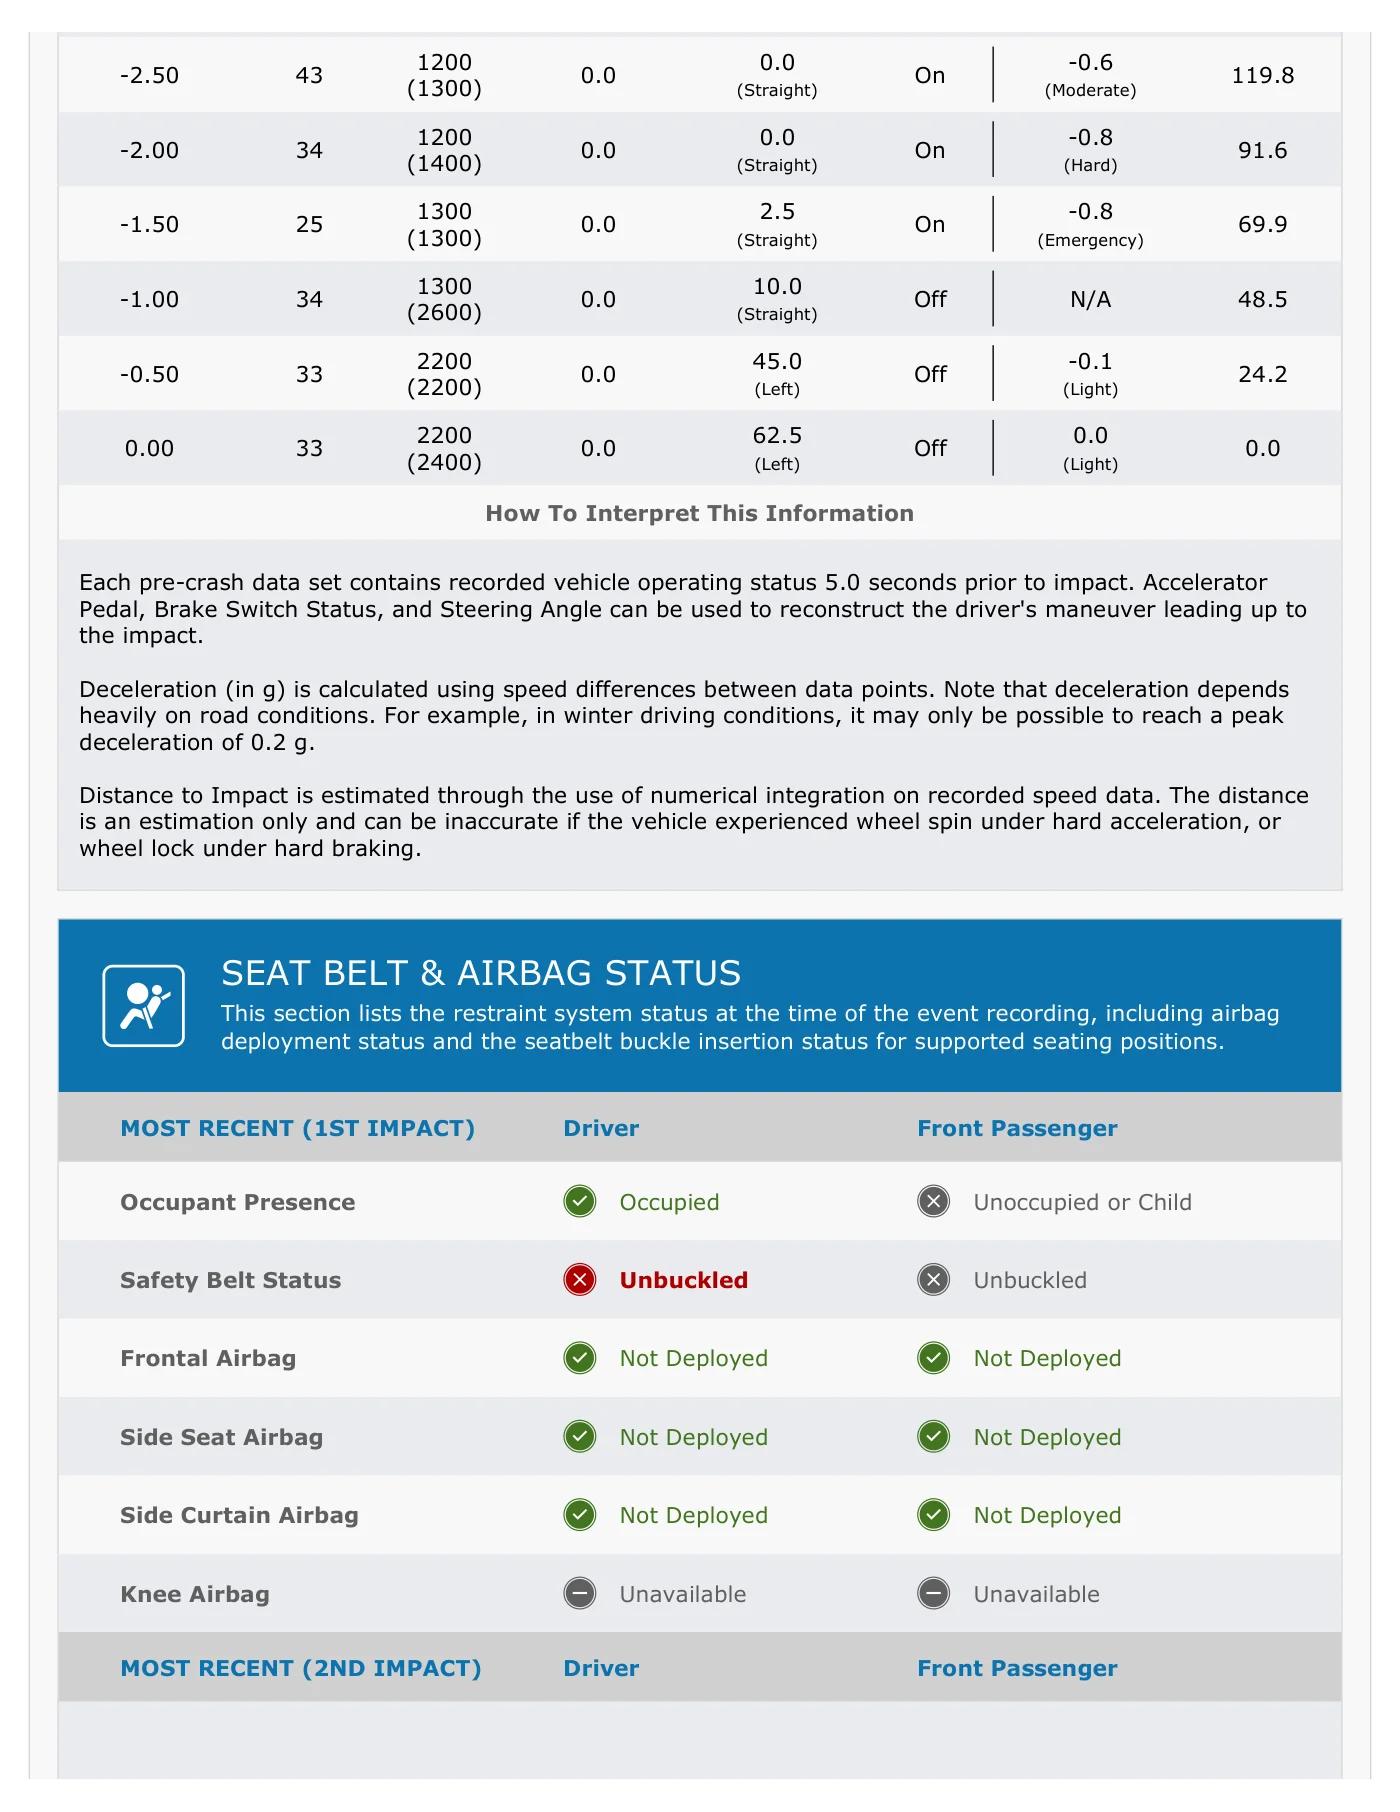
-2.50 43 1200 (1300) 0.0 0.0 (Straight) On -0.6 (Moderate) 119.8 -2.00 34 1200 (1400) 0.0 0.0 (Straight) On -0.8 (Hard) 91.6 -1.50 25 1300 (1300) 0.0 2.5 (Straight) On -0.8 (Emergency) 69.9 -1.00 34 1300 (2600) 0.0 10.0 (Straight) Off N/A 48.5 -0.50 33 2200 (2200) 0.0 45.0 (Left) Off -0.1 (Light) 24.2 0.00 33 2200 (2400) 0.0 62.5 (Left) Off 0.0 (Light) 0.0 How To Interpret This Information Each pre-crash data set contains recorded vehicle operating status 5.0 seconds prior to impact. Accelerator Pedal, Brake Switch Status, and Steering Angle can be used to reconstruct the driver's maneuver leading up to the impact. Deceleration (in g) is calculated using speed differences between data points. Note that deceleration depends heavily on road conditions. For example, in winter driving conditions, it may only be possible to reach a peak deceleration of 0.2 g. Distance to Impact is estimated through the use of numerical integration on recorded speed data. The distance is an estimation only and can be inaccurate if the vehicle experienced wheel spin under hard acceleration, or wheel lock under hard braking. SEAT BELT & AIRBAG STATUS This section lists the restraint system status at the time of the event recording, including airbag deployment status and the seatbelt buckle insertion status for supported seating positions. MOST RECENT (1ST IMPACT) Driver Front Passenger Occupant Presence Occupied Unoccupied or Child Safety Belt Status Unbuckled Unbuckled Frontal Airbag Not Deployed Not Deployed Side Seat Airbag Not Deployed Not Deployed Side Curtain Airbag Not Deployed Not Deployed Knee Airbag Unavailable Unavailable MOST RECENT (2ND IMPACT) Driver Front Passenger
Read page 6 text
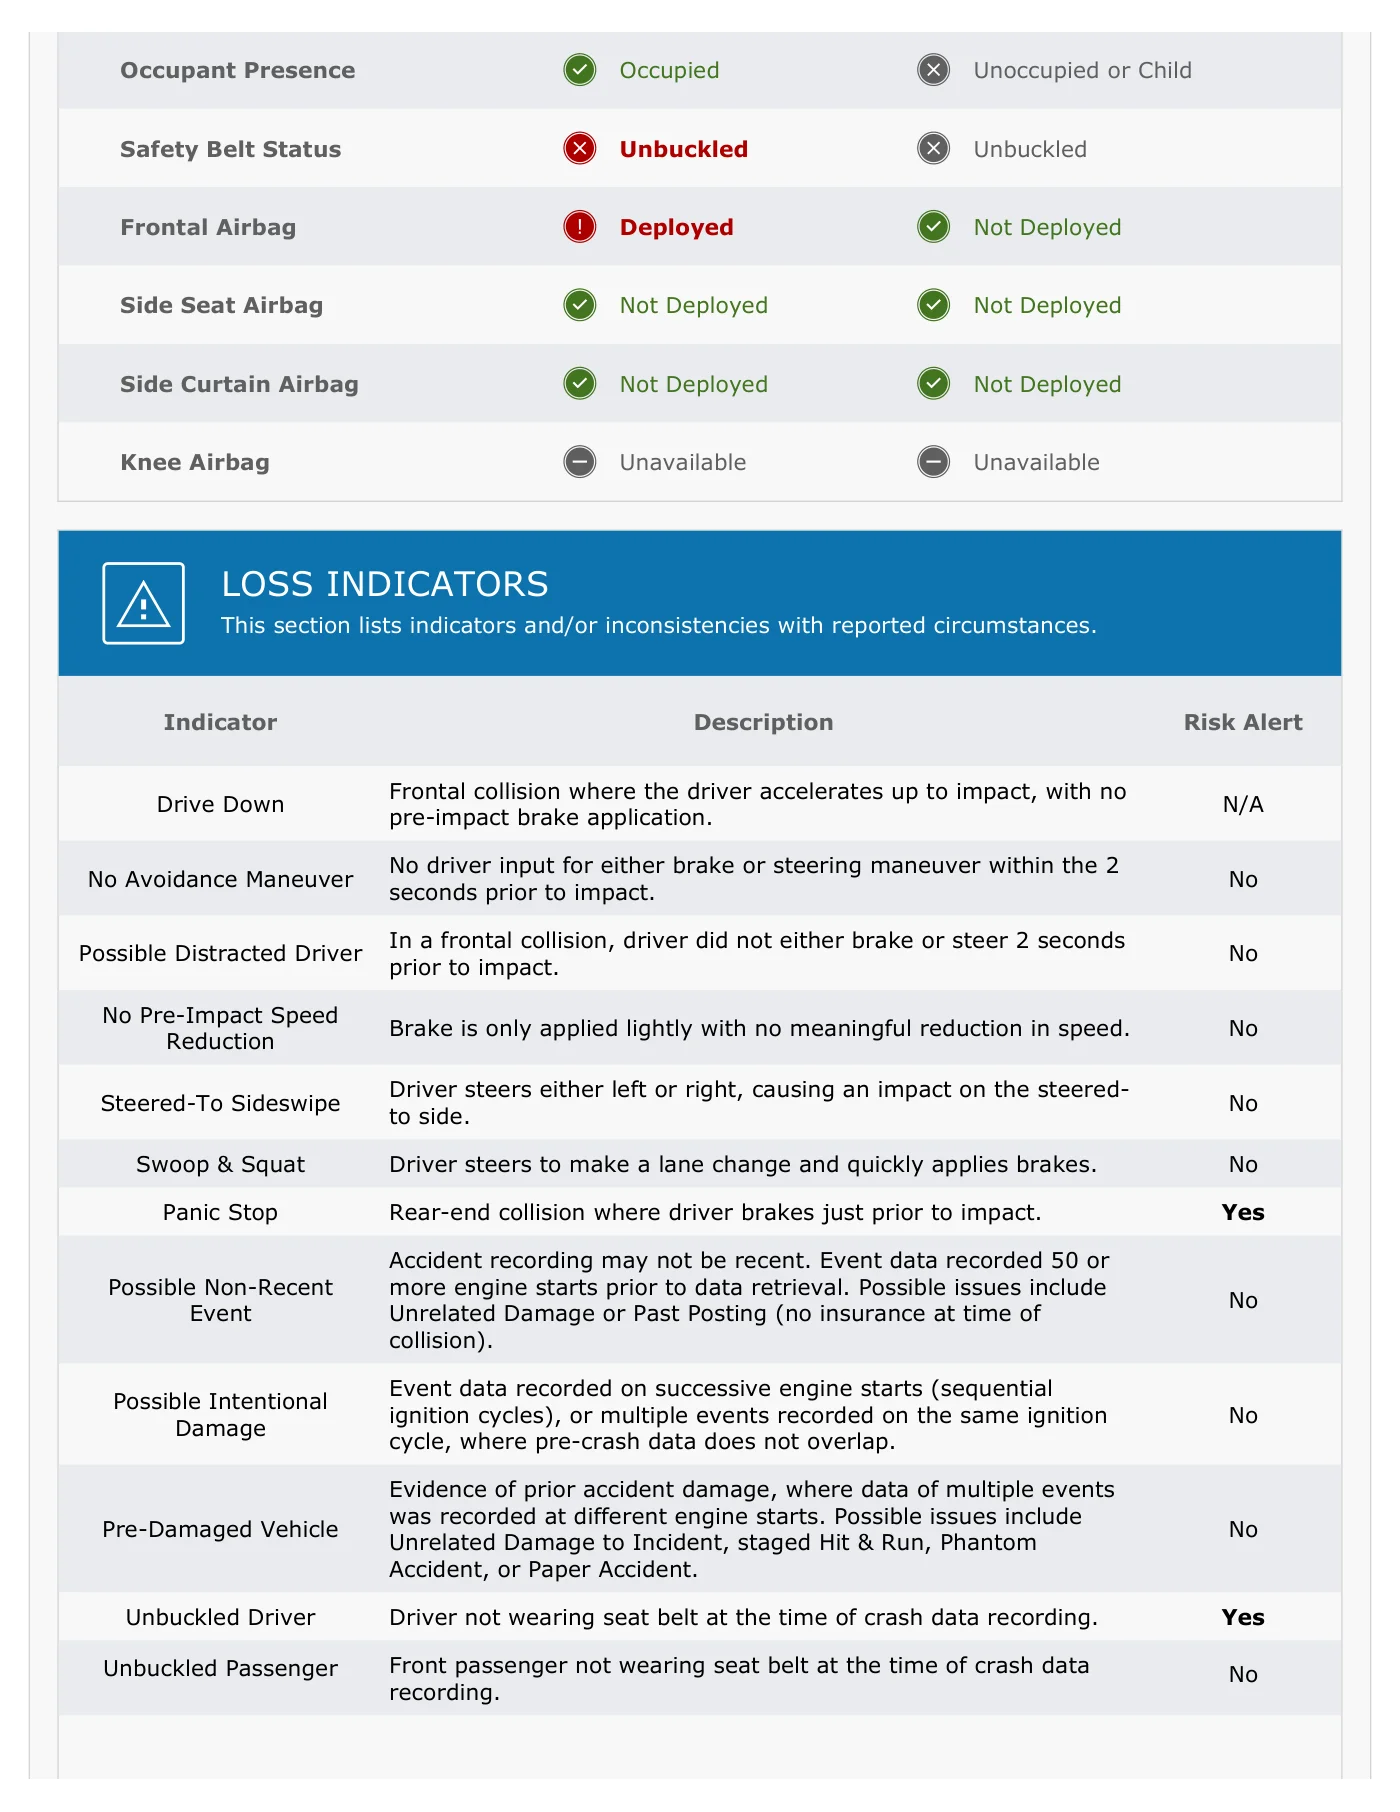
Occupant Presence Occupied Unoccupied or Child Safety Belt Status Unbuckled Unbuckled Frontal Airbag Deployed Not Deployed Side Seat Airbag Not Deployed Not Deployed Side Curtain Airbag Not Deployed Not Deployed Knee Airbag Unavailable Unavailable LOSS INDICATORS This section lists indicators and/or inconsistencies with reported circumstances. Indicator Description Risk Alert Drive Down Frontal collision where the driver accelerates up to impact, with no pre-impact brake application. N/A No Avoidance Maneuver No driver input for either brake or steering maneuver within the 2 seconds prior to impact. No Possible Distracted Driver In a frontal collision, driver did not either brake or steer 2 seconds prior to impact. No No Pre-Impact Speed Reduction Brake is only applied lightly with no meaningful reduction in speed. No Steered-To Sideswipe Driver steers either left or right, causing an impact on the steered- to side. No Swoop & Squat Driver steers to make a lane change and quickly applies brakes. No Panic Stop Rear-end collision where driver brakes just prior to impact. Yes Possible Non-Recent Event Accident recording may not be recent. Event data recorded 50 or more engine starts prior to data retrieval. Possible issues include Unrelated Damage or Past Posting (no insurance at time of collision). No Possible Intentional Damage Event data recorded on successive engine starts (sequential ignition cycles), or multiple events recorded on the same ignition cycle, where pre-crash data does not overlap. No Pre-Damaged Vehicle Evidence of prior accident damage, where data of multiple events was recorded at different engine starts. Possible issues include Unrelated Damage to Incident, staged Hit & Run, Phantom Accident, or Paper Accident. No Unbuckled Driver Driver not wearing seat belt at the time of crash data recording. Yes Unbuckled Passenger Front passenger not wearing seat belt at the time of crash data recording. No
Read page 7 text
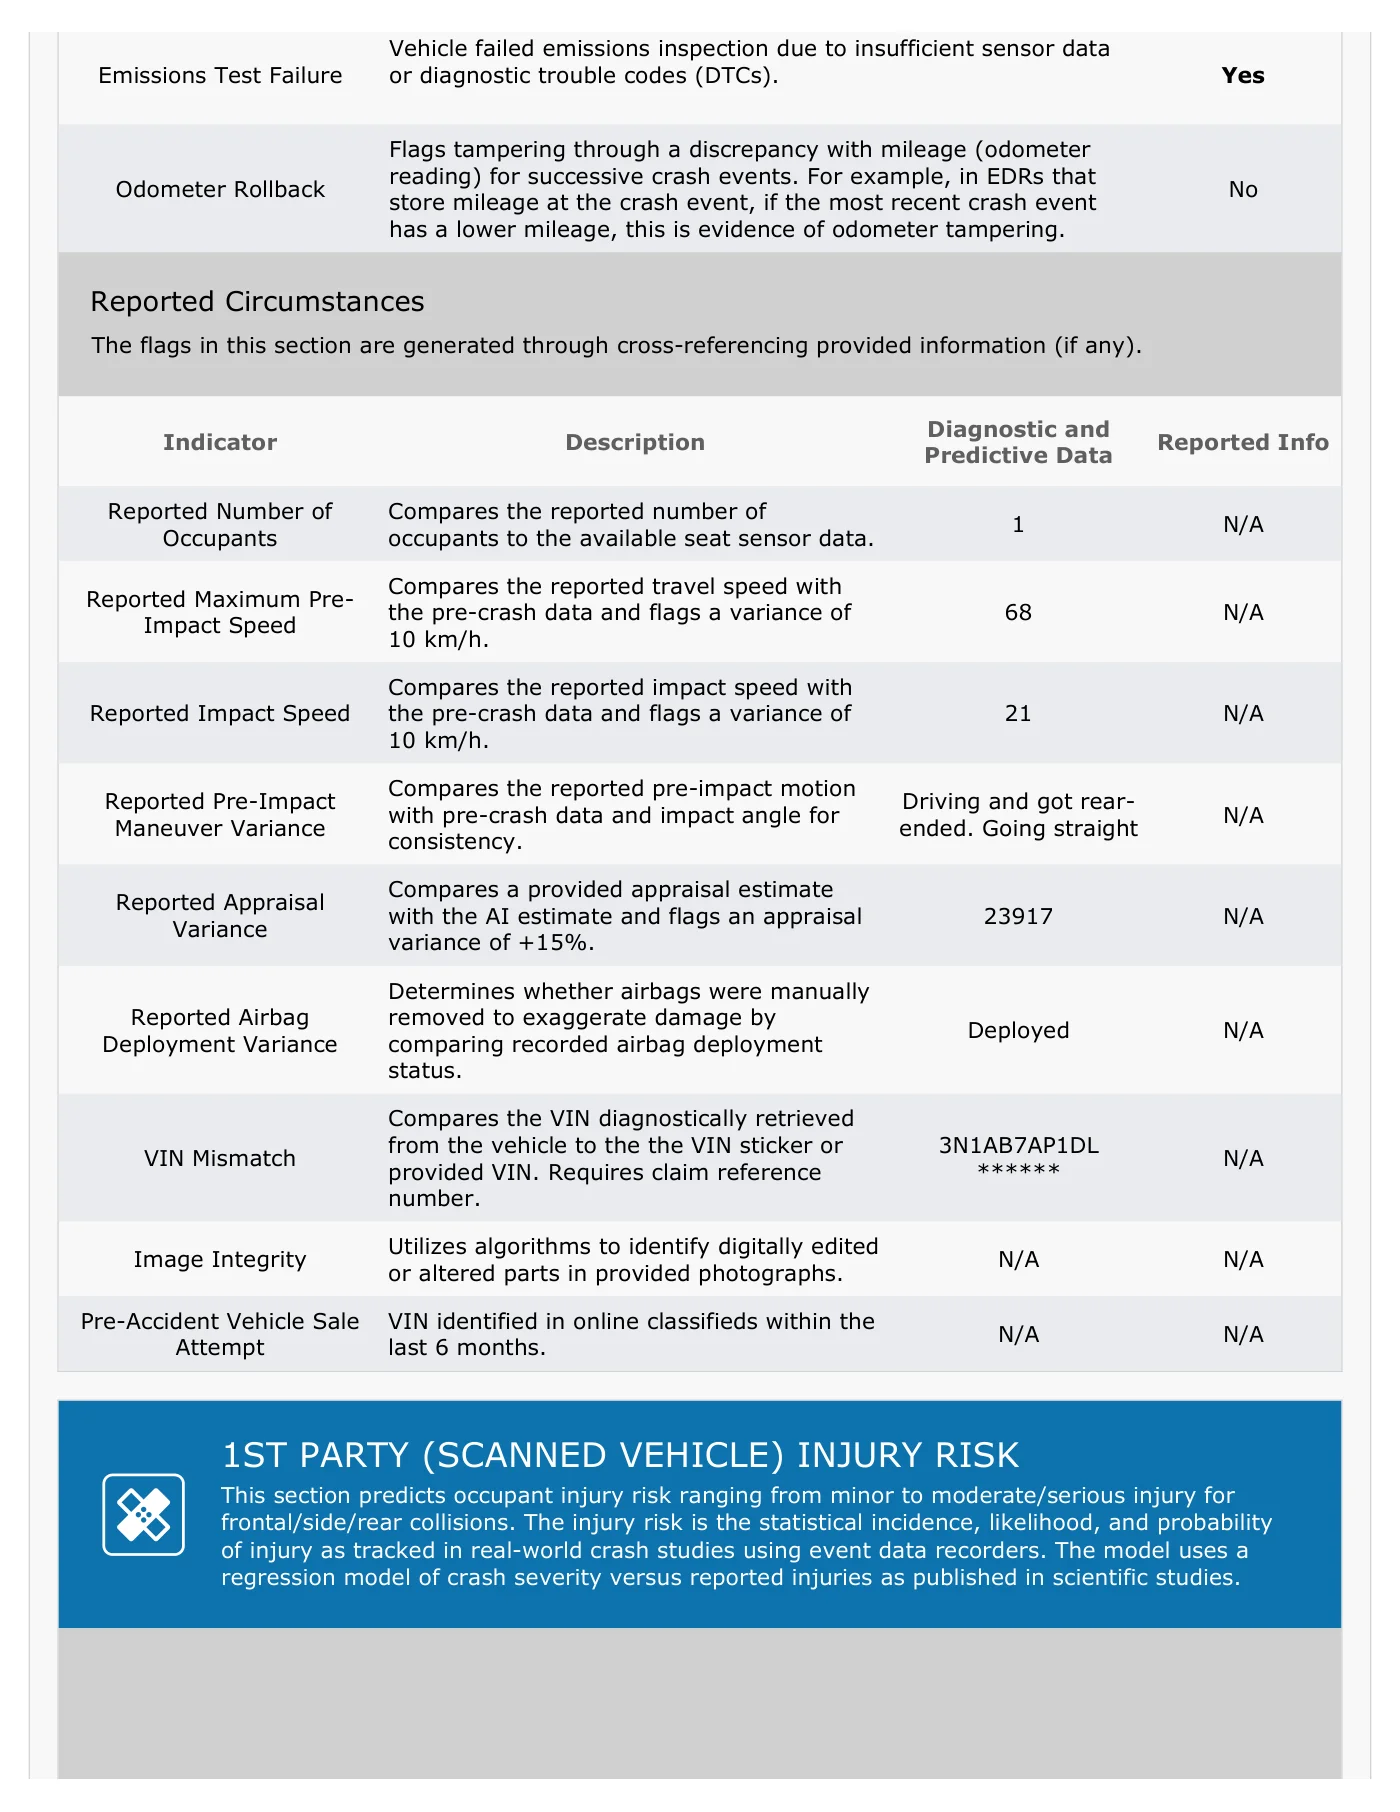
Emissions Test Failure Vehicle failed emissions inspection due to insufficient sensor data or diagnostic trouble codes (DTCs). Yes Odometer Rollback Flags tampering through a discrepancy with mileage (odometer reading) for successive crash events. For example, in EDRs that store mileage at the crash event, if the most recent crash event has a lower mileage, this is evidence of odometer tampering. No Reported Circumstances The flags in this section are generated through cross-referencing provided information (if any). Indicator Description Diagnostic and Predictive Data Reported Info Reported Number of Occupants Compares the reported number of occupants to the available seat sensor data. 1 N/A Reported Maximum Pre- Impact Speed Compares the reported travel speed with the pre-crash data and flags a variance of 10 km/h. 68 N/A Reported Impact Speed Compares the reported impact speed with the pre-crash data and flags a variance of 10 km/h. 21 N/A Reported Pre-Impact Maneuver Variance Compares the reported pre-impact motion with pre-crash data and impact angle for consistency. Driving and got rear- ended. Going straight N/A Reported Appraisal Variance Compares a provided appraisal estimate with the AI estimate and flags an appraisal variance of +15%. 23917 N/A Reported Airbag Deployment Variance Determines whether airbags were manually removed to exaggerate damage by comparing recorded airbag deployment status. Deployed N/A VIN Mismatch Compares the VIN diagnostically retrieved from the vehicle to the the VIN sticker or provided VIN. Requires claim reference number. 3N1AB7AP1DL ****** N/A Image Integrity Utilizes algorithms to identify digitally edited or altered parts in provided photographs. N/A N/A Pre-Accident Vehicle Sale Attempt VIN identified in online classifieds within the last 6 months. N/A N/A 1ST PARTY (SCANNED VEHICLE) INJURY RISK This section predicts occupant injury risk ranging from minor to moderate/serious injury for frontal/side/rear collisions. The injury risk is the statistical incidence, likelihood, and probability of injury as tracked in real-world crash studies using event data recorders. The model uses a regression model of crash severity versus reported injuries as published in scientific studies.
Read page 8 text
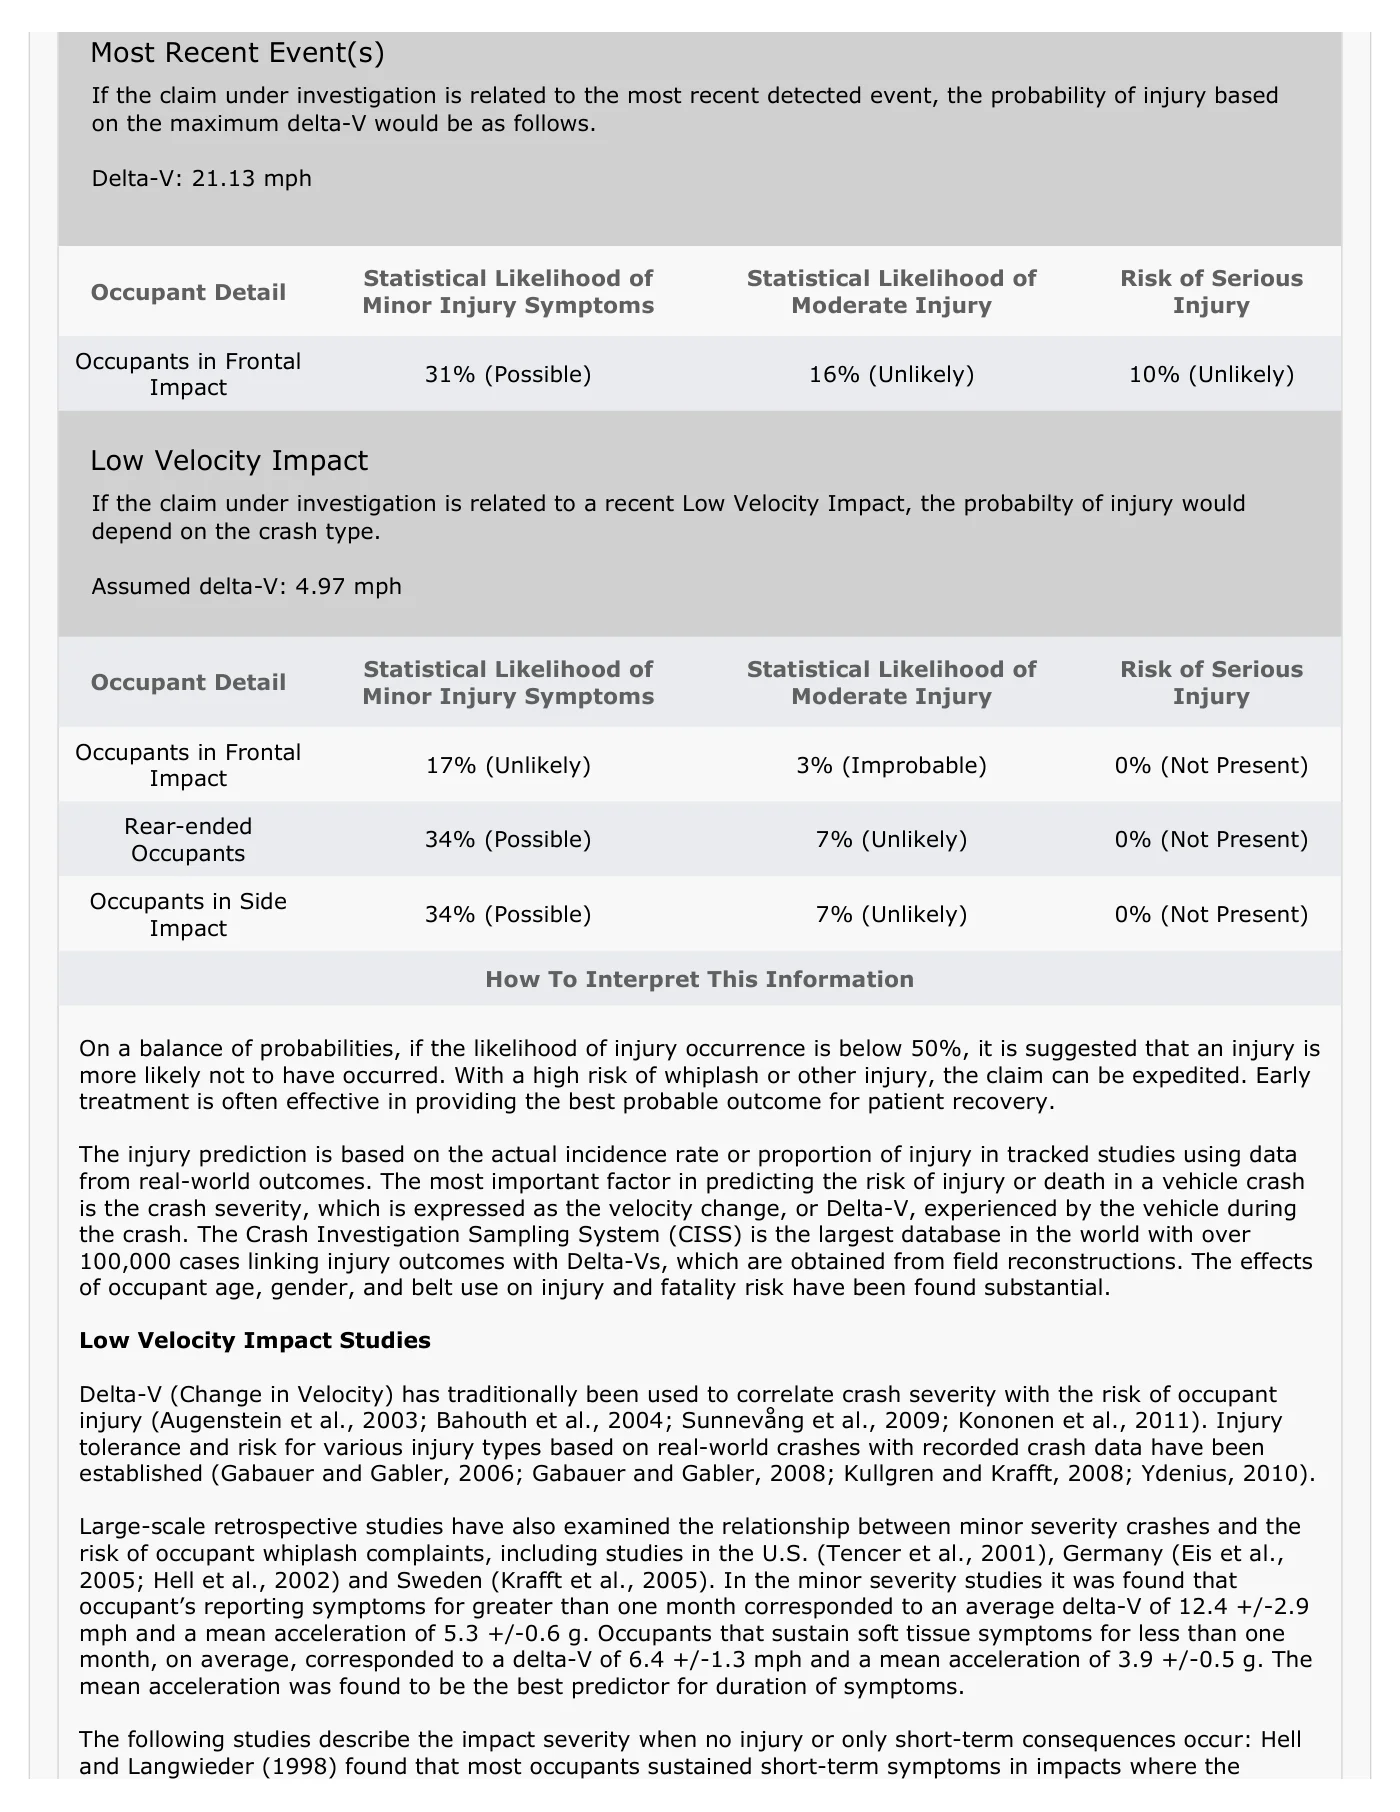
Most Recent Event(s) If the claim under investigation is related to the most recent detected event, the probability of injury based on the maximum delta-V would be as follows. Delta-V: 21.13 mph Occupant Detail Statistical Likelihood of Minor Injury Symptoms Statistical Likelihood of Moderate Injury Risk of Serious Injury Occupants in Frontal Impact 31% (Possible) 16% (Unlikely) 10% (Unlikely) Low Velocity Impact If the claim under investigation is related to a recent Low Velocity Impact, the probabilty of injury would depend on the crash type. Assumed delta-V: 4.97 mph Occupant Detail Statistical Likelihood of Minor Injury Symptoms Statistical Likelihood of Moderate Injury Risk of Serious Injury Occupants in Frontal Impact 17% (Unlikely) 3% (Improbable) 0% (Not Present) Rear-ended Occupants 34% (Possible) 7% (Unlikely) 0% (Not Present) Occupants in Side Impact 34% (Possible) 7% (Unlikely) 0% (Not Present) How To Interpret This Information On a balance of probabilities, if the likelihood of injury occurrence is below 50%, it is suggested that an injury is more likely not to have occurred. With a high risk of whiplash or other injury, the claim can be expedited. Early treatment is often effective in providing the best probable outcome for patient recovery. The injury prediction is based on the actual incidence rate or proportion of injury in tracked studies using data from real-world outcomes. The most important factor in predicting the risk of injury or death in a vehicle crash is the crash severity, which is expressed as the velocity change, or Delta-V, experienced by the vehicle during the crash. The Crash Investigation Sampling System (CISS) is the largest database in the world with over 100,000 cases linking injury outcomes with Delta-Vs, which are obtained from field reconstructions. The effects of occupant age, gender, and belt use on injury and fatality risk have been found substantial. Low Velocity Impact Studies Delta-V (Change in Velocity) has traditionally been used to correlate crash severity with the risk of occupant injury (Augenstein et al., 2003; Bahouth et al., 2004; Sunnevång et al., 2009; Kononen et al., 2011). Injury tolerance and risk for various injury types based on real-world crashes with recorded crash data have been established (Gabauer and Gabler, 2006; Gabauer and Gabler, 2008; Kullgren and Krafft, 2008; Ydenius, 2010). Large-scale retrospective studies have also examined the relationship between minor severity crashes and the risk of occupant whiplash complaints, including studies in the U.S. (Tencer et al., 2001), Germany (Eis et al., 2005; Hell et al., 2002) and Sweden (Krafft et al., 2005). In the minor severity studies it was found that occupant’s reporting symptoms for greater than one month corresponded to an average delta-V of 12.4 +/-2.9 mph and a mean acceleration of 5.3 +/-0.6 g. Occupants that sustain soft tissue symptoms for less than one month, on average, corresponded to a delta-V of 6.4 +/-1.3 mph and a mean acceleration of 3.9 +/-0.5 g. The mean acceleration was found to be the best predictor for duration of symptoms. The following studies describe the impact severity when no injury or only short-term consequences occur: Hell and Langwieder (1998) found that most occupants sustained short-term symptoms in impacts where the
Read page 9 text
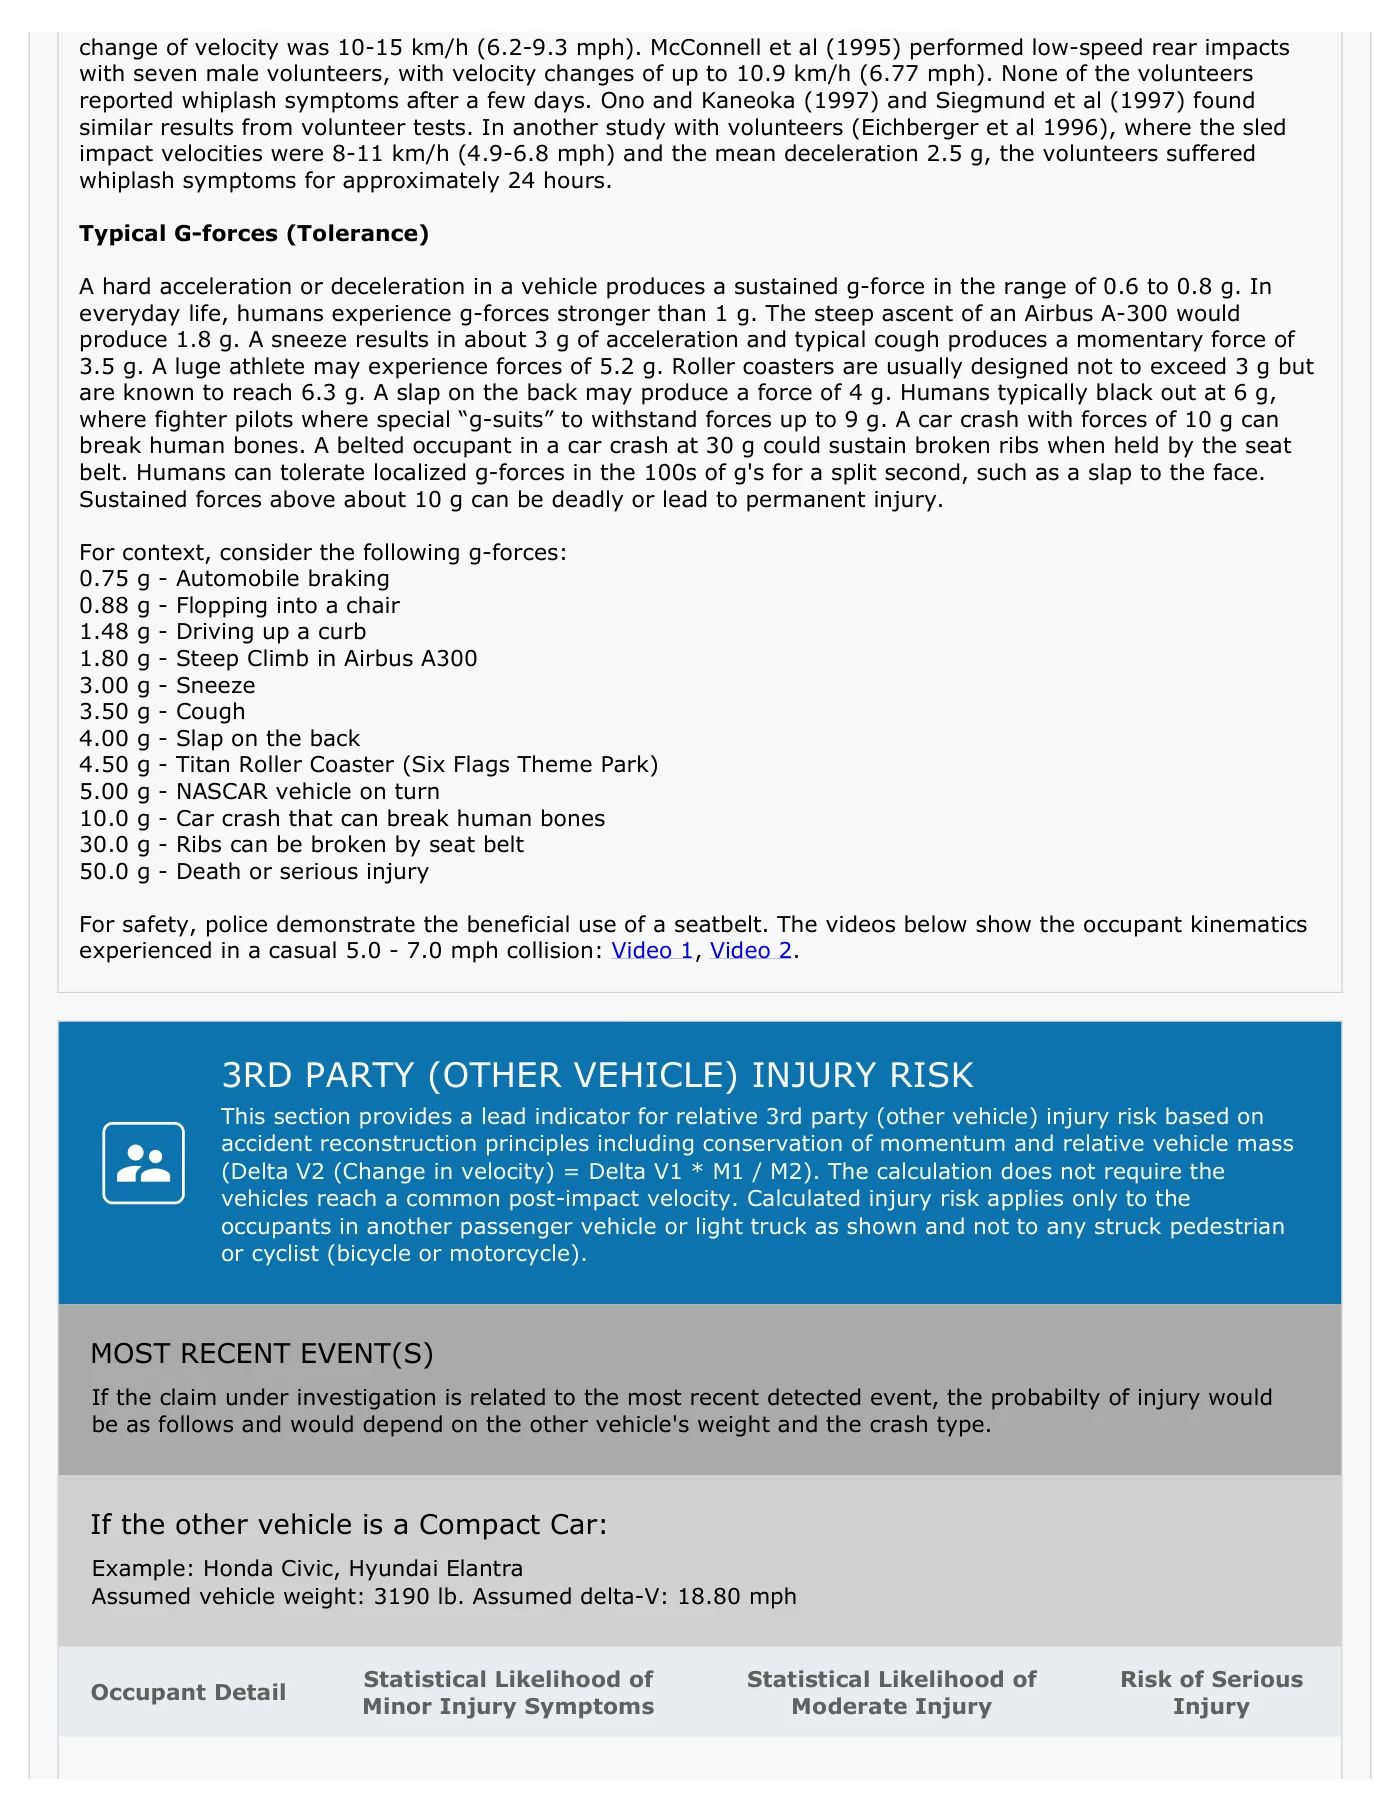
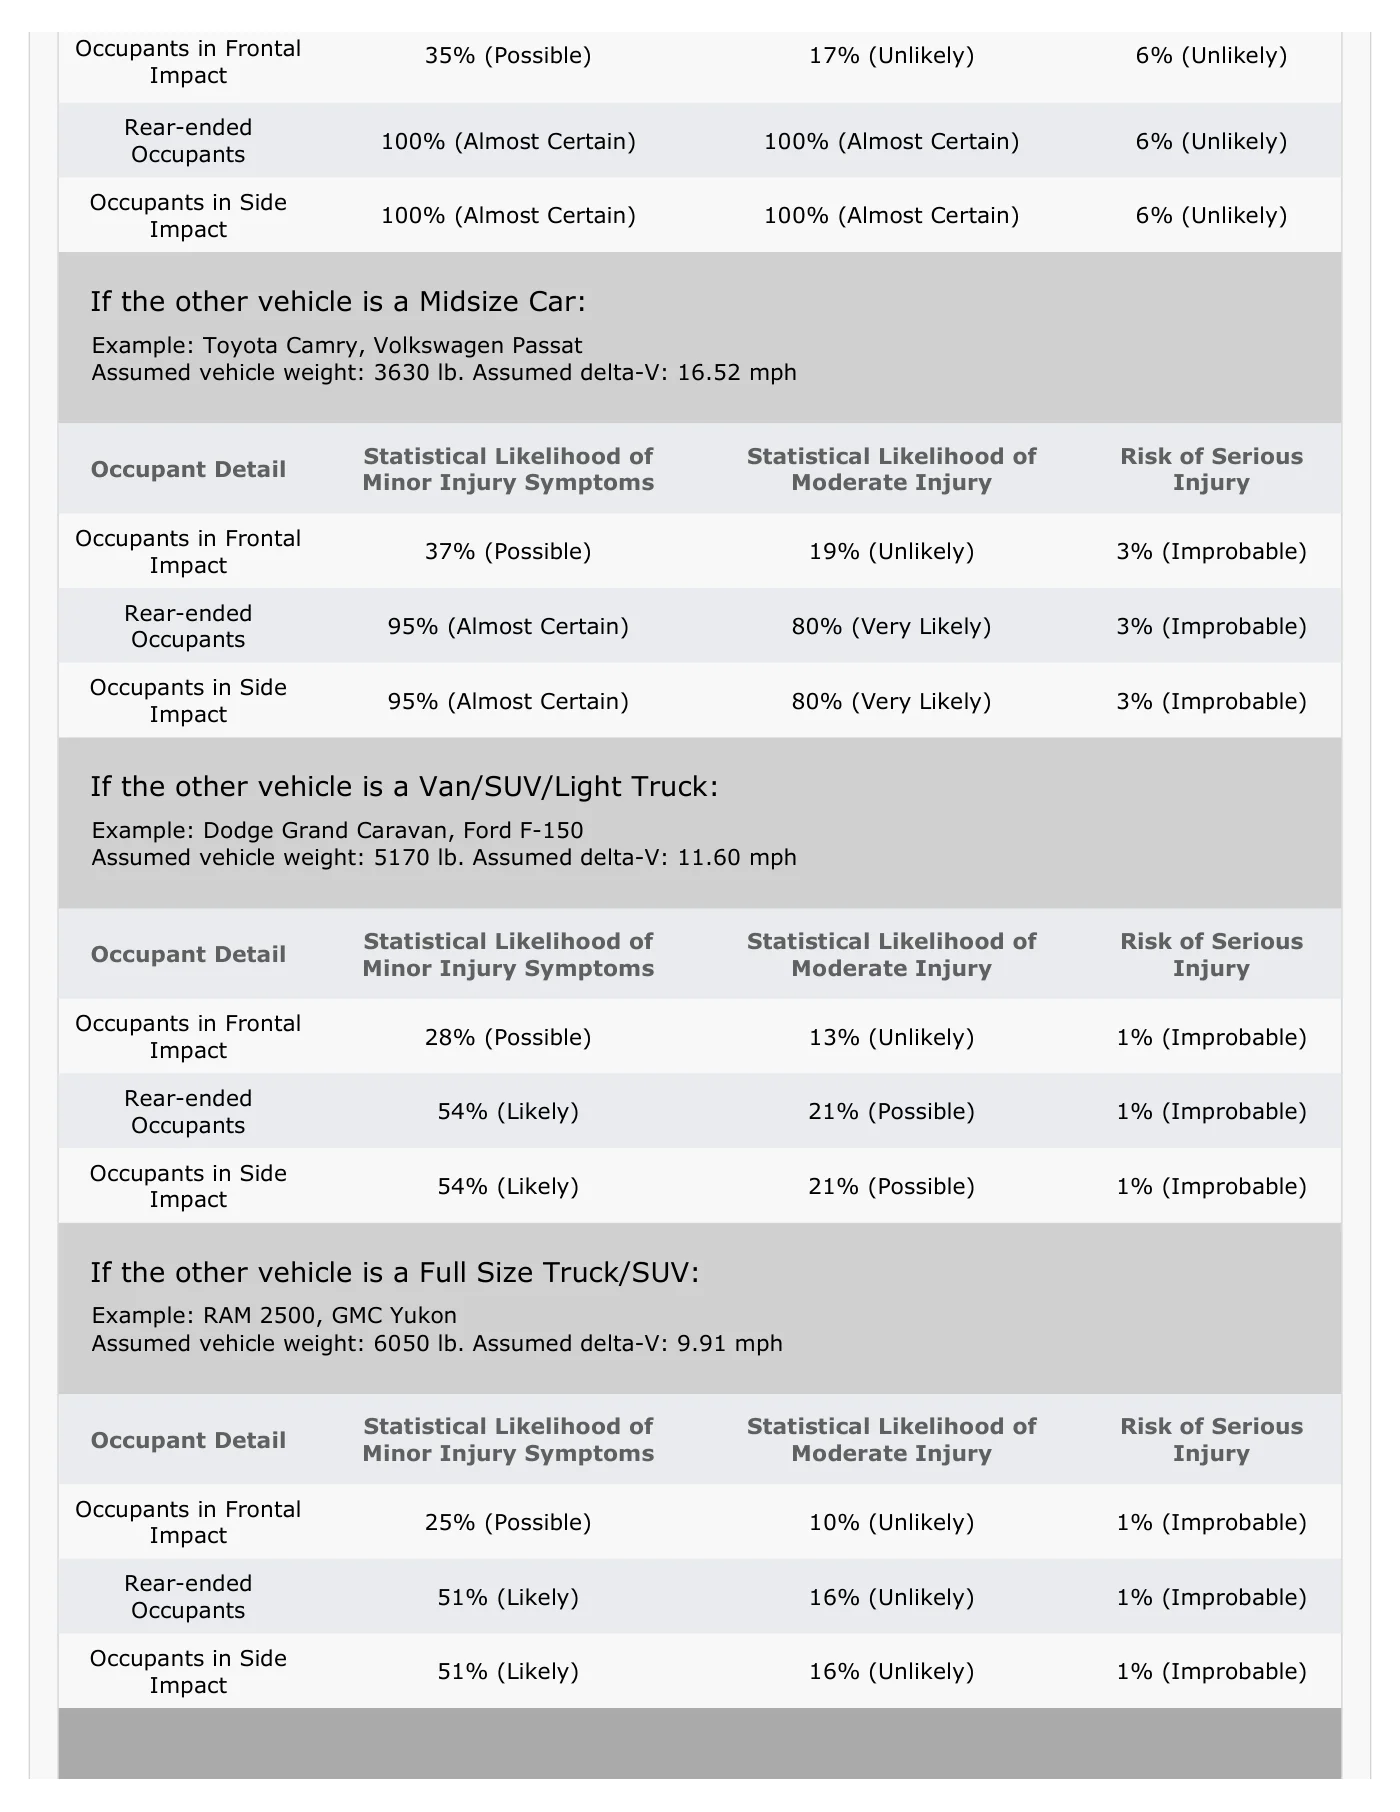
change of velocity was 10-15 km/h (6.2-9.3 mph). McConnell et al (1995) performed low-speed rear impacts with seven male volunteers, with velocity changes of up to 10.9 km/h (6.77 mph). None of the volunteers reported whiplash symptoms after a few days. Ono and Kaneoka (1997) and Siegmund et al (1997) found similar results from volunteer tests. In another study with volunteers (Eichberger et al 1996), where the sled impact velocities were 8-11 km/h (4.9-6.8 mph) and the mean deceleration 2.5 g, the volunteers suffered whiplash symptoms for approximately 24 hours. Typical G-forces (Tolerance) A hard acceleration or deceleration in a vehicle produces a sustained g-force in the range of 0.6 to 0.8 g. In everyday life, humans experience g-forces stronger than 1 g. The steep ascent of an Airbus A-300 would produce 1.8 g. A sneeze results in about 3 g of acceleration and typical cough produces a momentary force of 3.5 g. A luge athlete may experience forces of 5.2 g. Roller coasters are usually designed not to exceed 3 g but are known to reach 6.3 g. A slap on the back may produce a force of 4 g. Humans typically black out at 6 g, where fighter pilots where special “g-suits” to withstand forces up to 9 g. A car crash with forces of 10 g can break human bones. A belted occupant in a car crash at 30 g could sustain broken ribs when held by the seat belt. Humans can tolerate localized g-forces in the 100s of g's for a split second, such as a slap to the face. Sustained forces above about 10 g can be deadly or lead to permanent injury. For context, consider the following g-forces: 0.75 g - Automobile braking 0.88 g - Flopping into a chair 1.48 g - Driving up a curb 1.80 g - Steep Climb in Airbus A300 3.00 g - Sneeze 3.50 g - Cough 4.00 g - Slap on the back 4.50 g - Titan Roller Coaster (Six Flags Theme Park) 5.00 g - NASCAR vehicle on turn 10.0 g - Car crash that can break human bones 30.0 g - Ribs can be broken by seat belt 50.0 g - Death or serious injury For safety, police demonstrate the beneficial use of a seatbelt. The videos below show the occupant kinematics experienced in a casual 5.0 - 7.0 mph collision: Video 1, Video 2. 3RD PARTY (OTHER VEHICLE) INJURY RISK This section provides a lead indicator for relative 3rd party (other vehicle) injury risk based on accident reconstruction principles including conservation of momentum and relative vehicle mass (Delta V2 (Change in velocity) = Delta V1 * M1 / M2). The calculation does not require the vehicles reach a common post-impact velocity. Calculated injury risk applies only to the occupants in another passenger vehicle or light truck as shown and not to any struck pedestrian or cyclist (bicycle or motorcycle). MOST RECENT EVENT(S) If the claim under investigation is related to the most recent detected event, the probabilty of injury would be as follows and would depend on the other vehicle's weight and the crash type. If the other vehicle is a Compact Car: Example: Honda Civic, Hyundai Elantra Assumed vehicle weight: 3190 lb. Assumed delta-V: 18.80 mph Occupant Detail Statistical Likelihood of Minor Injury Symptoms Statistical Likelihood of Moderate Injury Risk of Serious Injury
Read page 10 text
Occupants in Frontal Impact 35% (Possible) 17% (Unlikely) 6% (Unlikely) Rear-ended Occupants 100% (Almost Certain) 100% (Almost Certain) 6% (Unlikely) Occupants in Side Impact 100% (Almost Certain) 100% (Almost Certain) 6% (Unlikely) If the other vehicle is a Midsize Car: Example: Toyota Camry, Volkswagen Passat Assumed vehicle weight: 3630 lb. Assumed delta-V: 16.52 mph Occupant Detail Statistical Likelihood of Minor Injury Symptoms Statistical Likelihood of Moderate Injury Risk of Serious Injury Occupants in Frontal Impact 37% (Possible) 19% (Unlikely) 3% (Improbable) Rear-ended Occupants 95% (Almost Certain) 80% (Very Likely) 3% (Improbable) Occupants in Side Impact 95% (Almost Certain) 80% (Very Likely) 3% (Improbable) If the other vehicle is a Van/SUV/Light Truck: Example: Dodge Grand Caravan, Ford F-150 Assumed vehicle weight: 5170 lb. Assumed delta-V: 11.60 mph Occupant Detail Statistical Likelihood of Minor Injury Symptoms Statistical Likelihood of Moderate Injury Risk of Serious Injury Occupants in Frontal Impact 28% (Possible) 13% (Unlikely) 1% (Improbable) Rear-ended Occupants 54% (Likely) 21% (Possible) 1% (Improbable) Occupants in Side Impact 54% (Likely) 21% (Possible) 1% (Improbable) If the other vehicle is a Full Size Truck/SUV: Example: RAM 2500, GMC Yukon Assumed vehicle weight: 6050 lb. Assumed delta-V: 9.91 mph Occupant Detail Statistical Likelihood of Minor Injury Symptoms Statistical Likelihood of Moderate Injury Risk of Serious Injury Occupants in Frontal Impact 25% (Possible) 10% (Unlikely) 1% (Improbable) Rear-ended Occupants 51% (Likely) 16% (Unlikely) 1% (Improbable) Occupants in Side Impact 51% (Likely) 16% (Unlikely) 1% (Improbable)
Read page 11 text
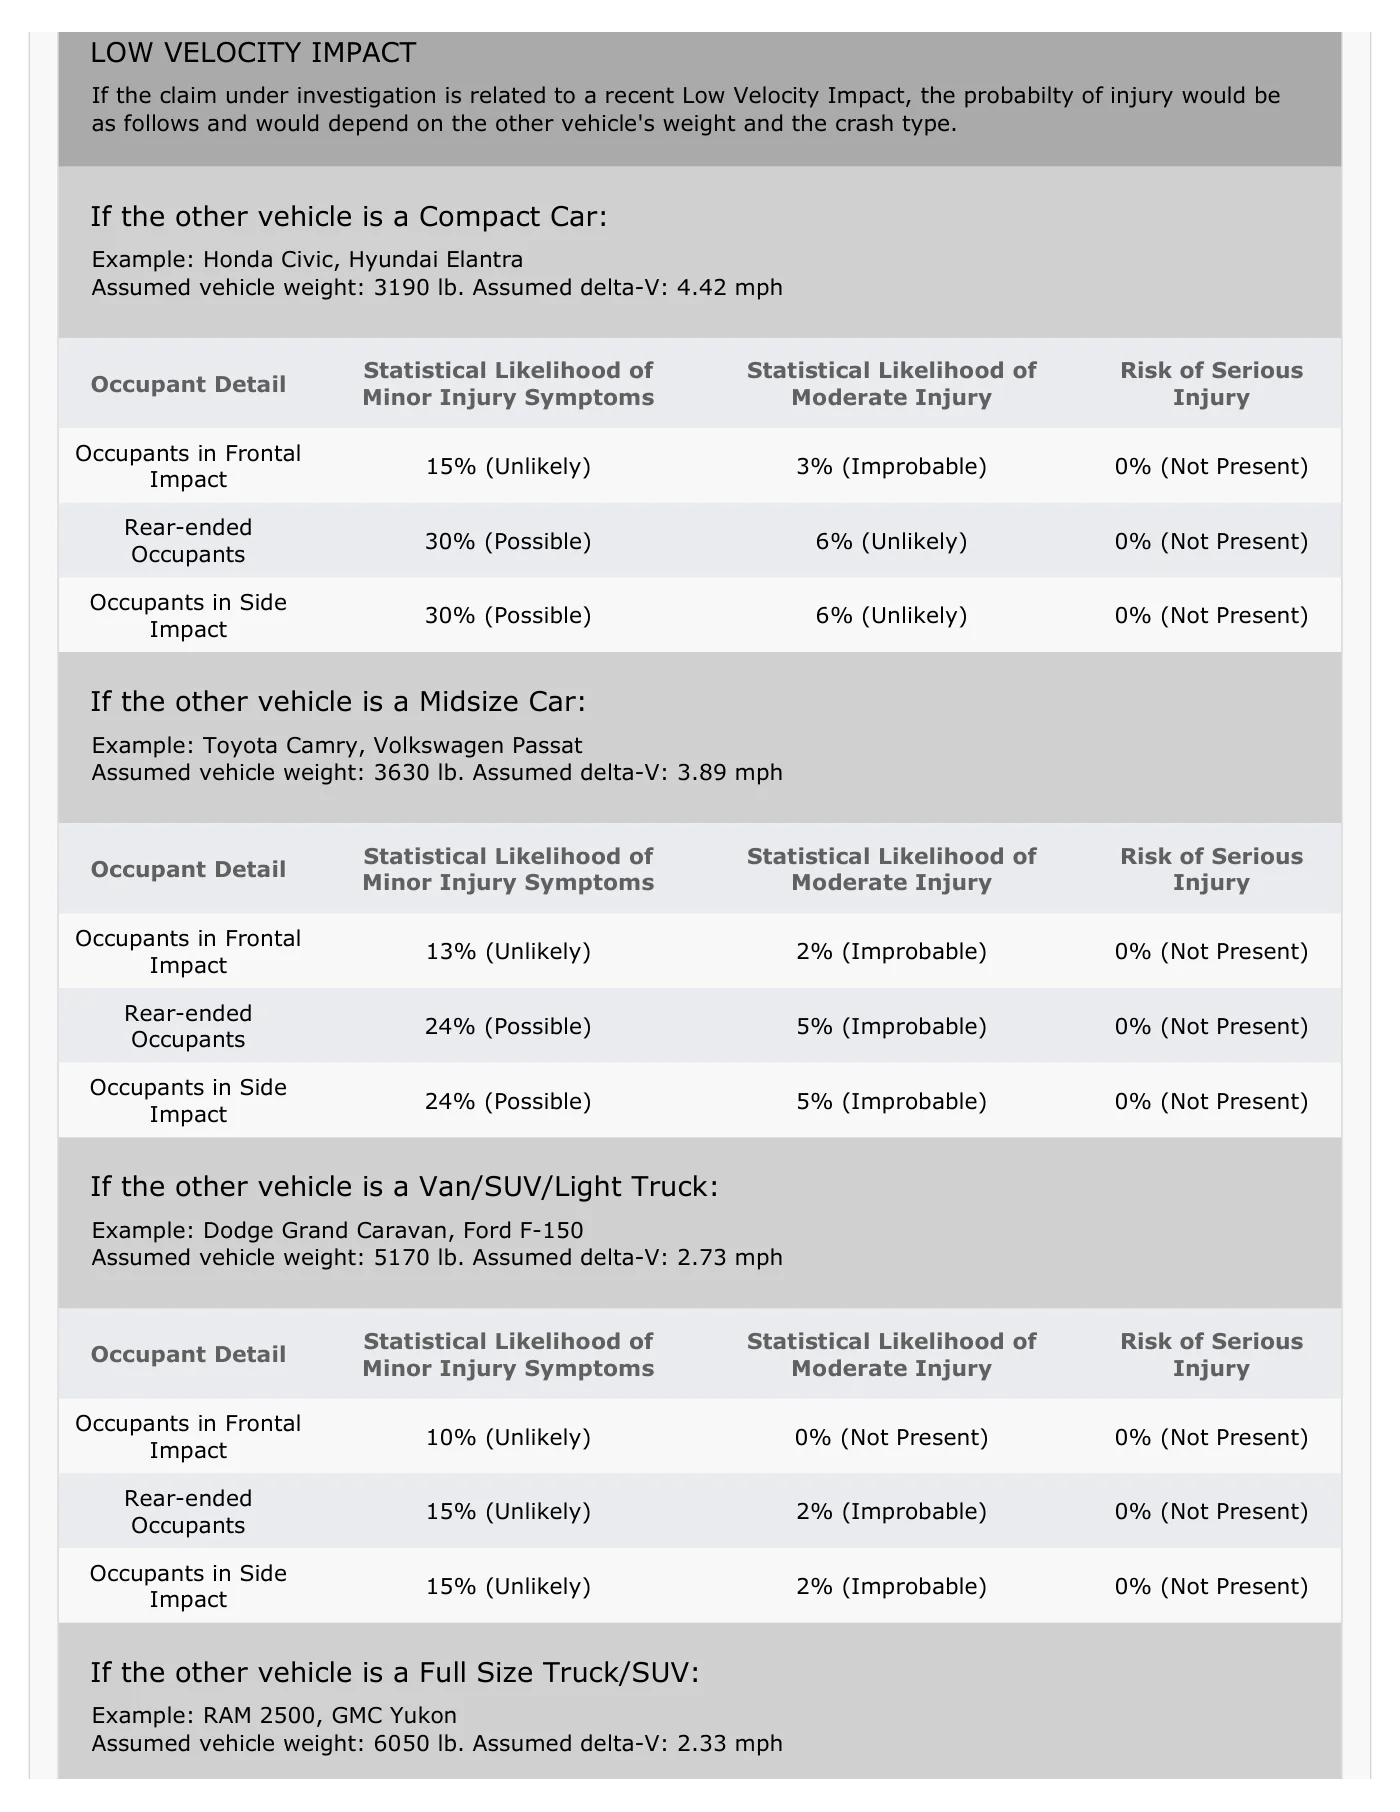
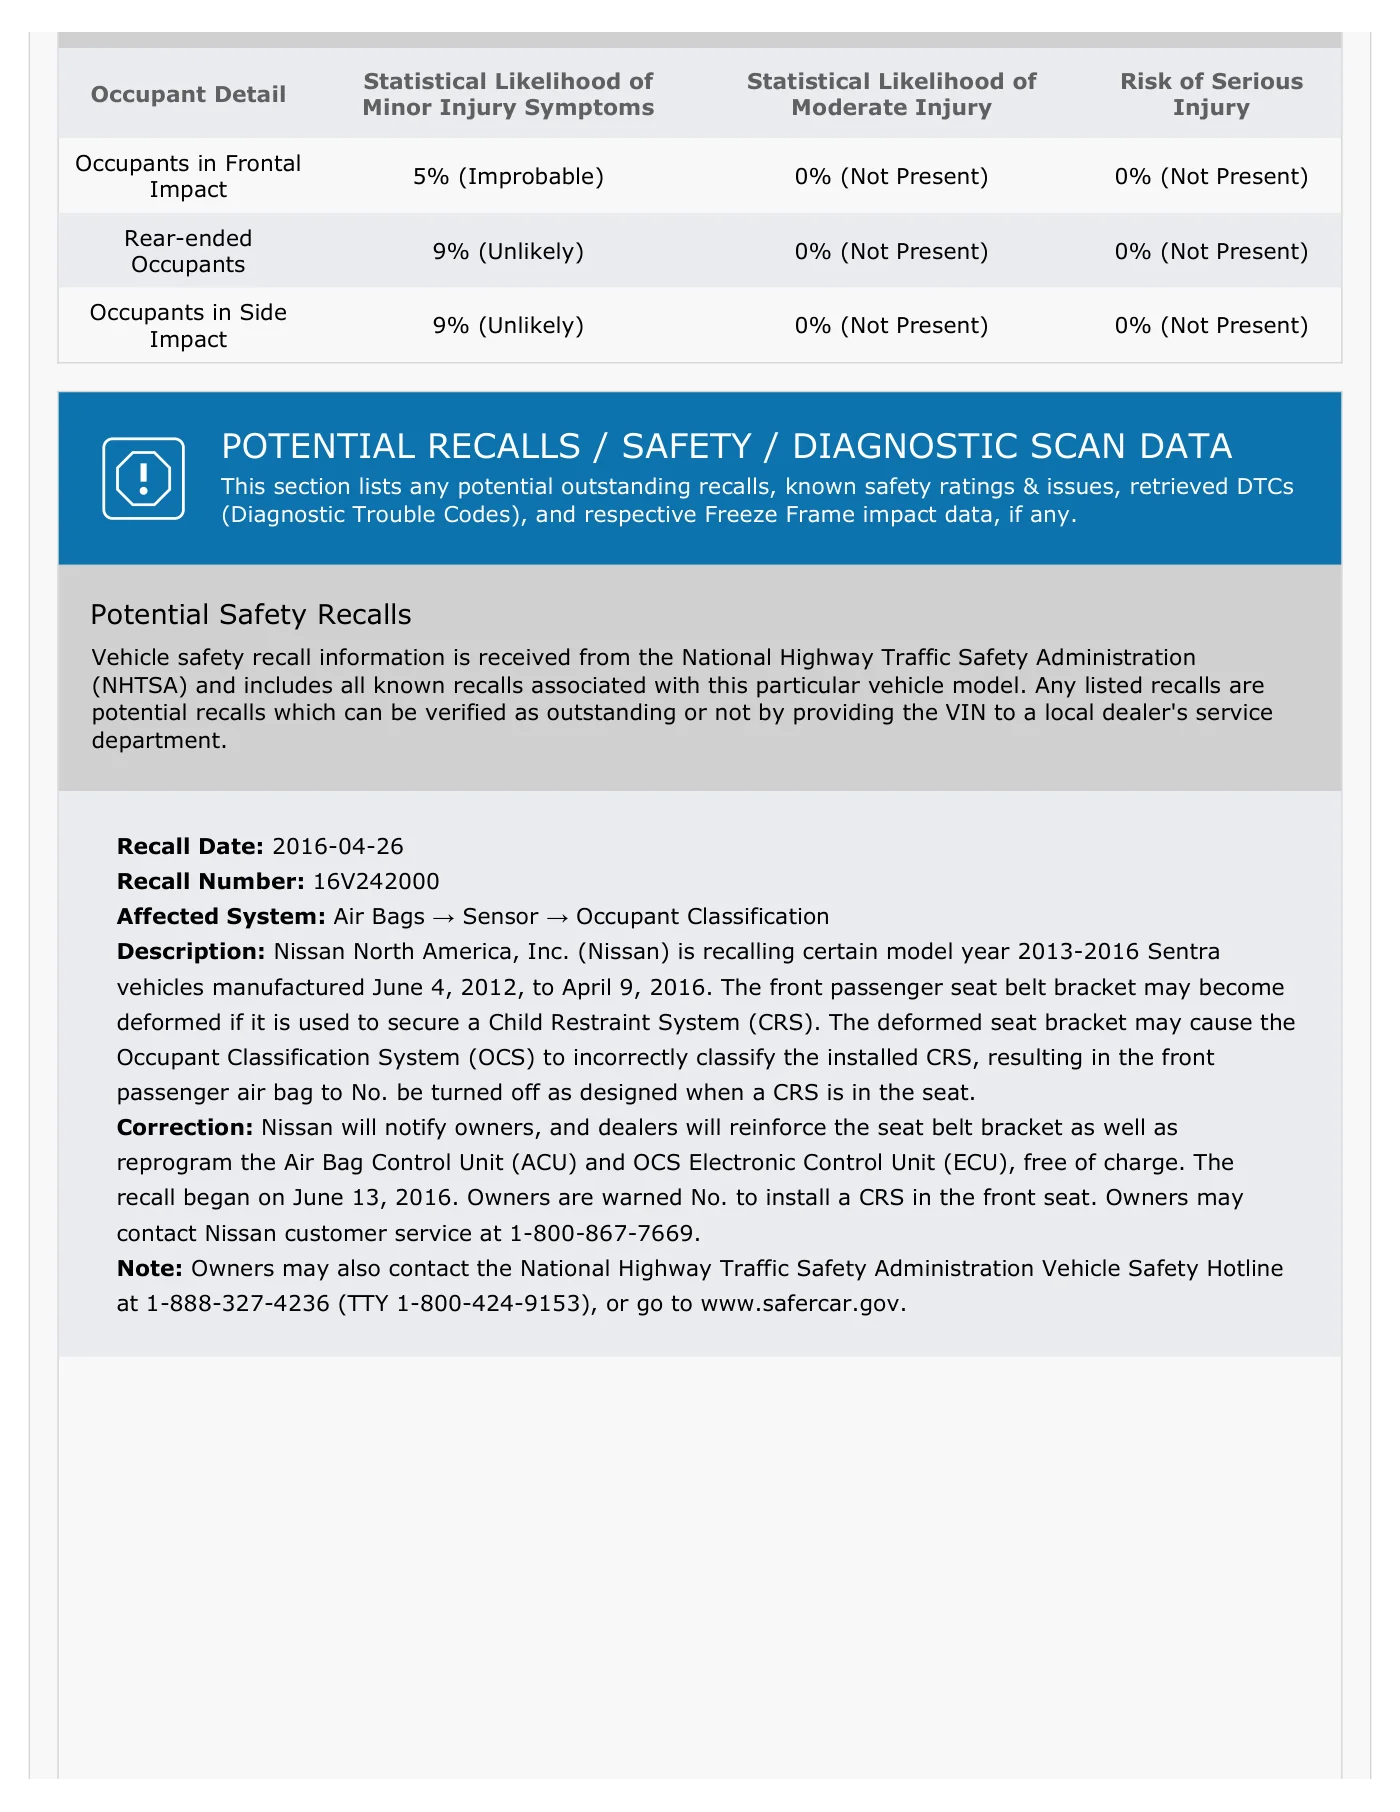
LOW VELOCITY IMPACT If the claim under investigation is related to a recent Low Velocity Impact, the probabilty of injury would be as follows and would depend on the other vehicle's weight and the crash type. If the other vehicle is a Compact Car: Example: Honda Civic, Hyundai Elantra Assumed vehicle weight: 3190 lb. Assumed delta-V: 4.42 mph Occupant Detail Statistical Likelihood of Minor Injury Symptoms Statistical Likelihood of Moderate Injury Risk of Serious Injury Occupants in Frontal Impact 15% (Unlikely) 3% (Improbable) 0% (Not Present) Rear-ended Occupants 30% (Possible) 6% (Unlikely) 0% (Not Present) Occupants in Side Impact 30% (Possible) 6% (Unlikely) 0% (Not Present) If the other vehicle is a Midsize Car: Example: Toyota Camry, Volkswagen Passat Assumed vehicle weight: 3630 lb. Assumed delta-V: 3.89 mph Occupant Detail Statistical Likelihood of Minor Injury Symptoms Statistical Likelihood of Moderate Injury Risk of Serious Injury Occupants in Frontal Impact 13% (Unlikely) 2% (Improbable) 0% (Not Present) Rear-ended Occupants 24% (Possible) 5% (Improbable) 0% (Not Present) Occupants in Side Impact 24% (Possible) 5% (Improbable) 0% (Not Present) If the other vehicle is a Van/SUV/Light Truck: Example: Dodge Grand Caravan, Ford F-150 Assumed vehicle weight: 5170 lb. Assumed delta-V: 2.73 mph Occupant Detail Statistical Likelihood of Minor Injury Symptoms Statistical Likelihood of Moderate Injury Risk of Serious Injury Occupants in Frontal Impact 10% (Unlikely) 0% (Not Present) 0% (Not Present) Rear-ended Occupants 15% (Unlikely) 2% (Improbable) 0% (Not Present) Occupants in Side Impact 15% (Unlikely) 2% (Improbable) 0% (Not Present) If the other vehicle is a Full Size Truck/SUV: Example: RAM 2500, GMC Yukon Assumed vehicle weight: 6050 lb. Assumed delta-V: 2.33 mph
Read page 12 text
Occupant Detail Statistical Likelihood of Minor Injury Symptoms Statistical Likelihood of Moderate Injury Risk of Serious Injury Occupants in Frontal Impact 5% (Improbable) 0% (Not Present) 0% (Not Present) Rear-ended Occupants 9% (Unlikely) 0% (Not Present) 0% (Not Present) Occupants in Side Impact 9% (Unlikely) 0% (Not Present) 0% (Not Present) POTENTIAL RECALLS / SAFETY / DIAGNOSTIC SCAN DATA This section lists any potential outstanding recalls, known safety ratings & issues, retrieved DTCs (Diagnostic Trouble Codes), and respective Freeze Frame impact data, if any. Potential Safety Recalls Vehicle safety recall information is received from the National Highway Traffic Safety Administration (NHTSA) and includes all known recalls associated with this particular vehicle model. Any listed recalls are potential recalls which can be verified as outstanding or not by providing the VIN to a local dealer's service department. Recall Date: 2016-04-26 Recall Number: 16V242000 Affected System: Air Bags → Sensor → Occupant Classification Description: Nissan North America, Inc. (Nissan) is recalling certain model year 2013-2016 Sentra vehicles manufactured June 4, 2012, to April 9, 2016. The front passenger seat belt bracket may become deformed if it is used to secure a Child Restraint System (CRS). The deformed seat bracket may cause the Occupant Classification System (OCS) to incorrectly classify the installed CRS, resulting in the front passenger air bag to No. be turned off as designed when a CRS is in the seat. Correction: Nissan will notify owners, and dealers will reinforce the seat belt bracket as well as reprogram the Air Bag Control Unit (ACU) and OCS Electronic Control Unit (ECU), free of charge. The recall began on June 13, 2016. Owners are warned No. to install a CRS in the front seat. Owners may contact Nissan customer service at 1-800-867-7669. Note: Owners may also contact the National Highway Traffic Safety Administration Vehicle Safety Hotline at 1-888-327-4236 (TTY 1-800-424-9153), or go to www.safercar.gov.
Read page 13 text
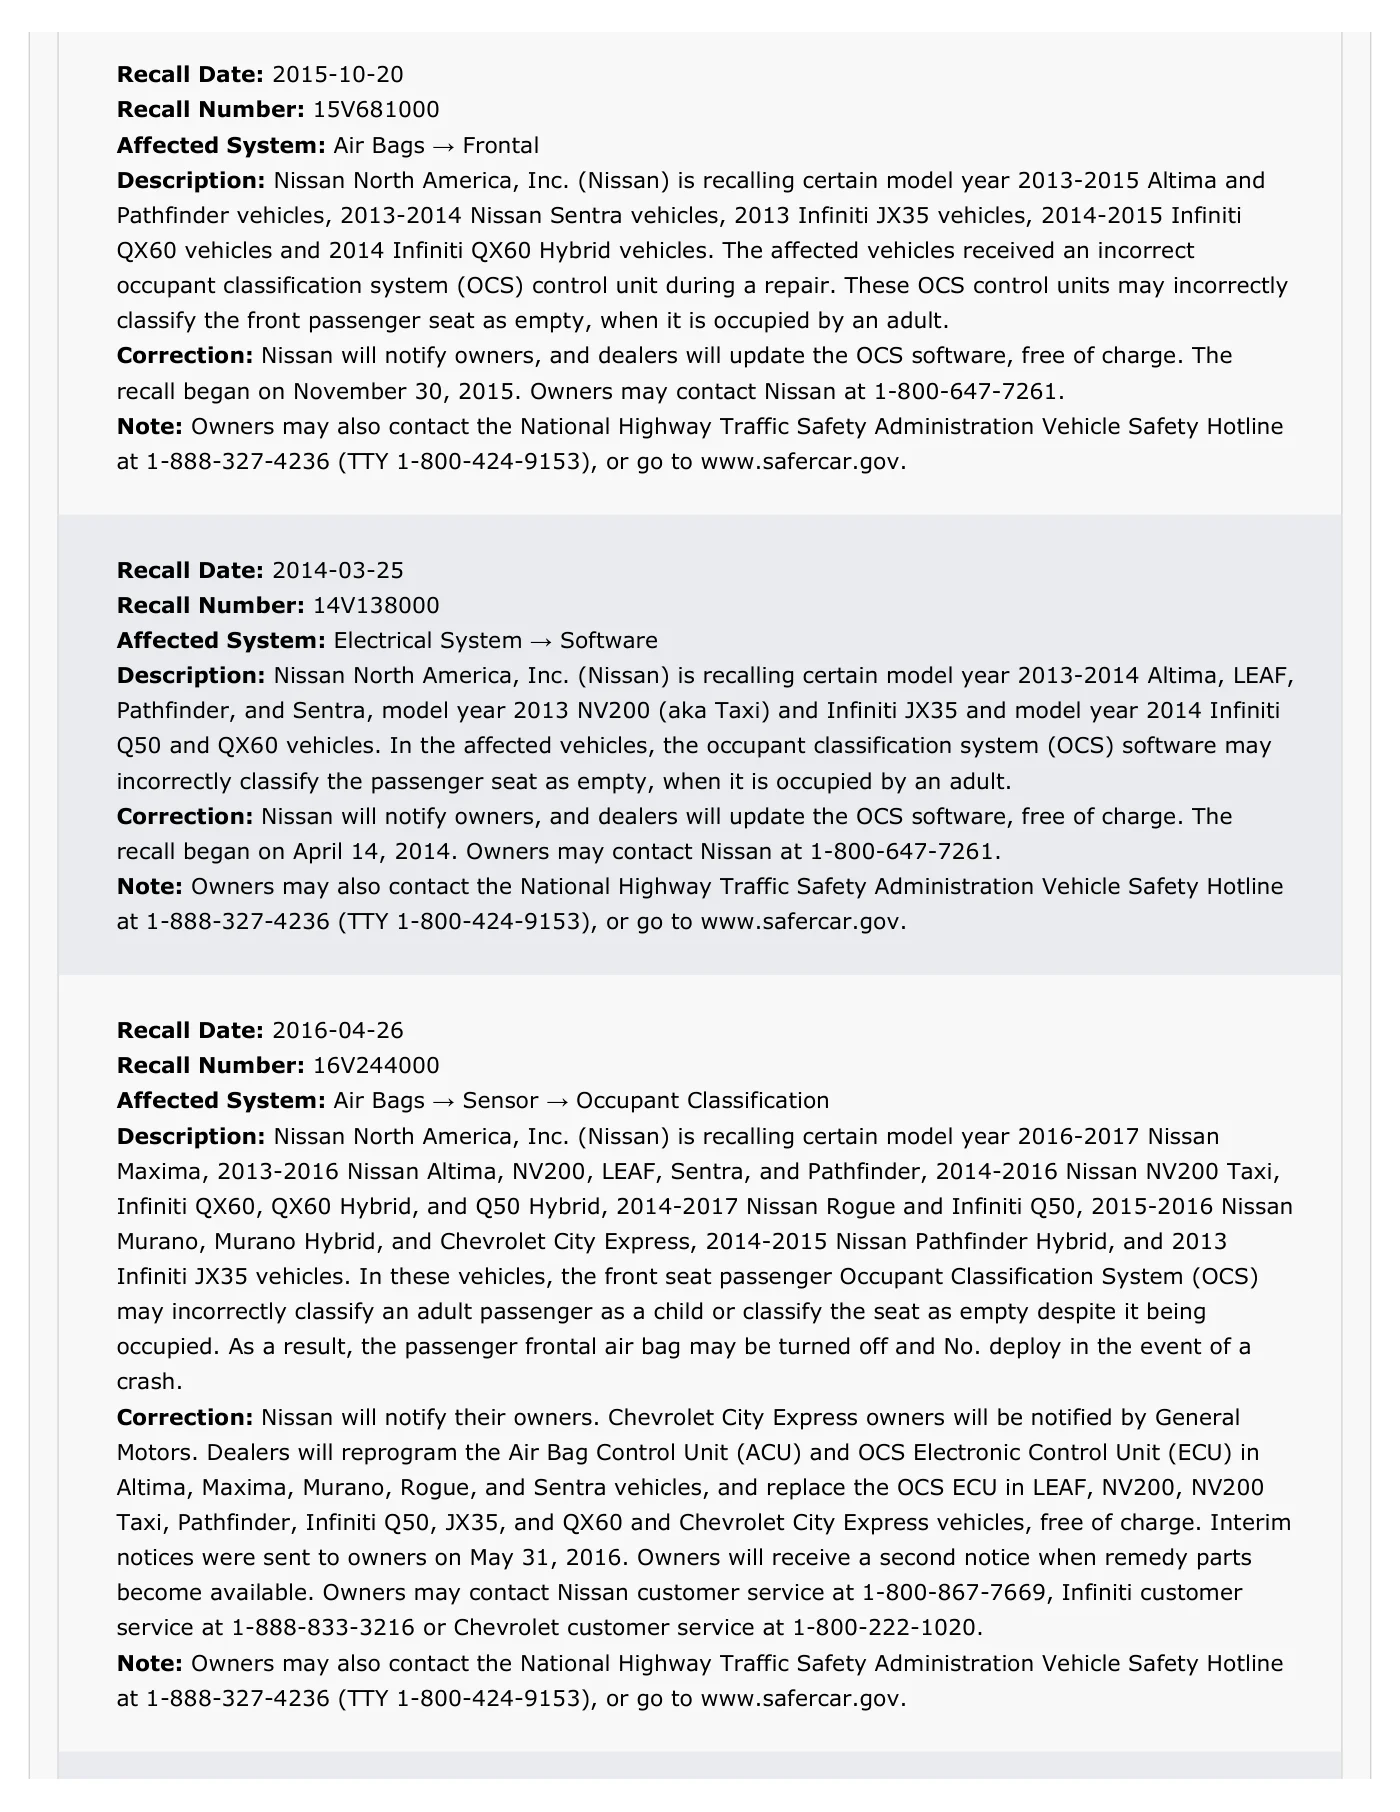
Recall Date: 2015-10-20 Recall Number: 15V681000 Affected System: Air Bags → Frontal Description: Nissan North America, Inc. (Nissan) is recalling certain model year 2013-2015 Altima and Pathfinder vehicles, 2013-2014 Nissan Sentra vehicles, 2013 Infiniti JX35 vehicles, 2014-2015 Infiniti QX60 vehicles and 2014 Infiniti QX60 Hybrid vehicles. The affected vehicles received an incorrect occupant classification system (OCS) control unit during a repair. These OCS control units may incorrectly classify the front passenger seat as empty, when it is occupied by an adult. Correction: Nissan will notify owners, and dealers will update the OCS software, free of charge. The recall began on November 30, 2015. Owners may contact Nissan at 1-800-647-7261. Note: Owners may also contact the National Highway Traffic Safety Administration Vehicle Safety Hotline at 1-888-327-4236 (TTY 1-800-424-9153), or go to www.safercar.gov. Recall Date: 2014-03-25 Recall Number: 14V138000 Affected System: Electrical System → Software Description: Nissan North America, Inc. (Nissan) is recalling certain model year 2013-2014 Altima, LEAF, Pathfinder, and Sentra, model year 2013 NV200 (aka Taxi) and Infiniti JX35 and model year 2014 Infiniti Q50 and QX60 vehicles. In the affected vehicles, the occupant classification system (OCS) software may incorrectly classify the passenger seat as empty, when it is occupied by an adult. Correction: Nissan will notify owners, and dealers will update the OCS software, free of charge. The recall began on April 14, 2014. Owners may contact Nissan at 1-800-647-7261. Note: Owners may also contact the National Highway Traffic Safety Administration Vehicle Safety Hotline at 1-888-327-4236 (TTY 1-800-424-9153), or go to www.safercar.gov. Recall Date: 2016-04-26 Recall Number: 16V244000 Affected System: Air Bags → Sensor → Occupant Classification Description: Nissan North America, Inc. (Nissan) is recalling certain model year 2016-2017 Nissan Maxima, 2013-2016 Nissan Altima, NV200, LEAF, Sentra, and Pathfinder, 2014-2016 Nissan NV200 Taxi, Infiniti QX60, QX60 Hybrid, and Q50 Hybrid, 2014-2017 Nissan Rogue and Infiniti Q50, 2015-2016 Nissan Murano, Murano Hybrid, and Chevrolet City Express, 2014-2015 Nissan Pathfinder Hybrid, and 2013 Infiniti JX35 vehicles. In these vehicles, the front seat passenger Occupant Classification System (OCS) may incorrectly classify an adult passenger as a child or classify the seat as empty despite it being occupied. As a result, the passenger frontal air bag may be turned off and No. deploy in the event of a crash. Correction: Nissan will notify their owners. Chevrolet City Express owners will be notified by General Motors. Dealers will reprogram the Air Bag Control Unit (ACU) and OCS Electronic Control Unit (ECU) in Altima, Maxima, Murano, Rogue, and Sentra vehicles, and replace the OCS ECU in LEAF, NV200, NV200 Taxi, Pathfinder, Infiniti Q50, JX35, and QX60 and Chevrolet City Express vehicles, free of charge. Interim notices were sent to owners on May 31, 2016. Owners will receive a second notice when remedy parts become available. Owners may contact Nissan customer service at 1-800-867-7669, Infiniti customer service at 1-888-833-3216 or Chevrolet customer service at 1-800-222-1020. Note: Owners may also contact the National Highway Traffic Safety Administration Vehicle Safety Hotline at 1-888-327-4236 (TTY 1-800-424-9153), or go to www.safercar.gov.
Read page 14 text
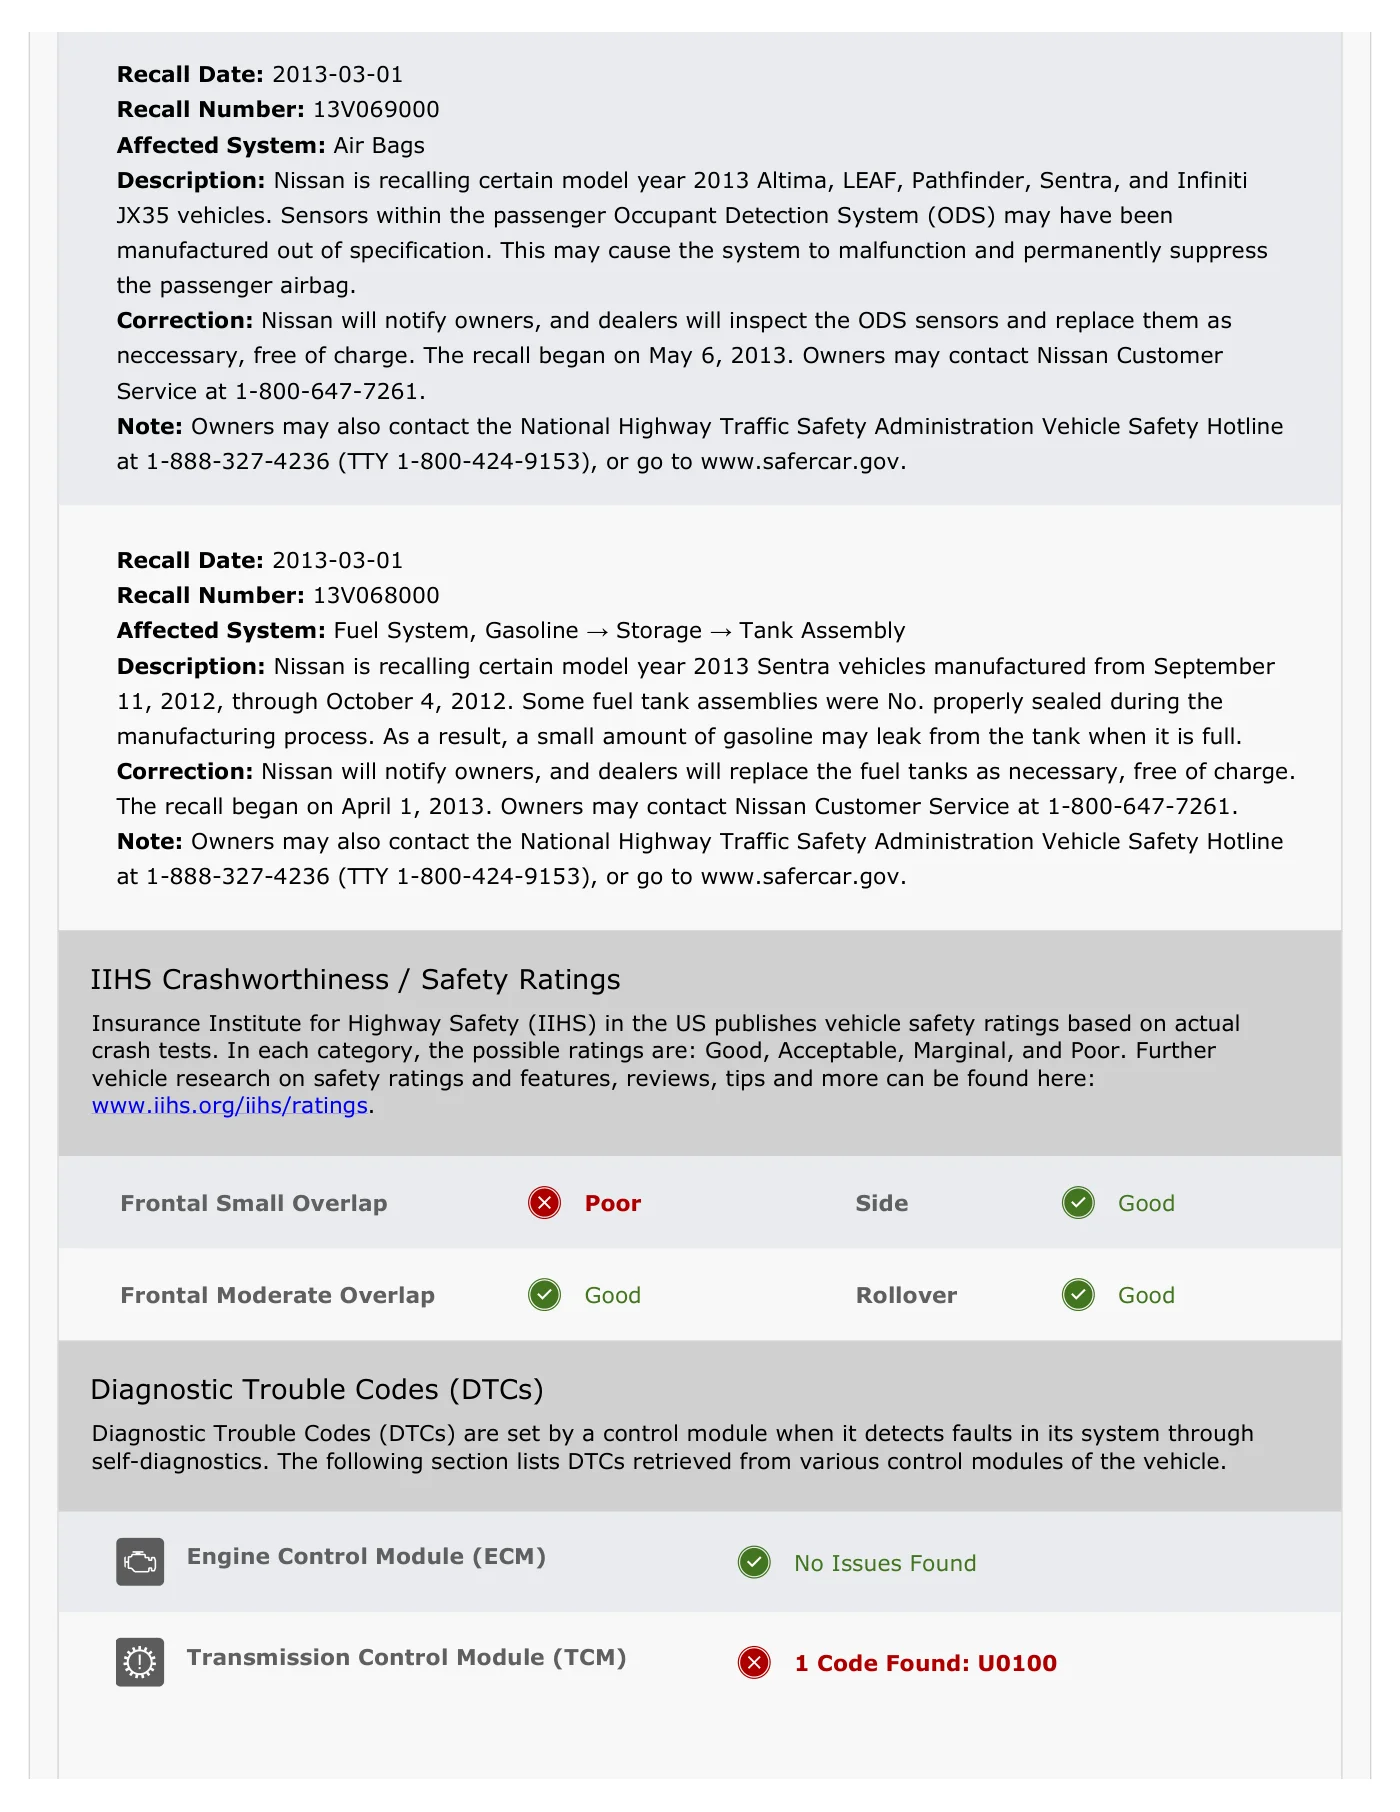
Recall Date: 2013-03-01 Recall Number: 13V069000 Affected System: Air Bags Description: Nissan is recalling certain model year 2013 Altima, LEAF, Pathfinder, Sentra, and Infiniti JX35 vehicles. Sensors within the passenger Occupant Detection System (ODS) may have been manufactured out of specification. This may cause the system to malfunction and permanently suppress the passenger airbag. Correction: Nissan will notify owners, and dealers will inspect the ODS sensors and replace them as neccessary, free of charge. The recall began on May 6, 2013. Owners may contact Nissan Customer Service at 1-800-647-7261. Note: Owners may also contact the National Highway Traffic Safety Administration Vehicle Safety Hotline at 1-888-327-4236 (TTY 1-800-424-9153), or go to www.safercar.gov. Recall Date: 2013-03-01 Recall Number: 13V068000 Affected System: Fuel System, Gasoline → Storage → Tank Assembly Description: Nissan is recalling certain model year 2013 Sentra vehicles manufactured from September 11, 2012, through October 4, 2012. Some fuel tank assemblies were No. properly sealed during the manufacturing process. As a result, a small amount of gasoline may leak from the tank when it is full. Correction: Nissan will notify owners, and dealers will replace the fuel tanks as necessary, free of charge. The recall began on April 1, 2013. Owners may contact Nissan Customer Service at 1-800-647-7261. Note: Owners may also contact the National Highway Traffic Safety Administration Vehicle Safety Hotline at 1-888-327-4236 (TTY 1-800-424-9153), or go to www.safercar.gov. IIHS Crashworthiness / Safety Ratings Insurance Institute for Highway Safety (IIHS) in the US publishes vehicle safety ratings based on actual crash tests. In each category, the possible ratings are: Good, Acceptable, Marginal, and Poor. Further vehicle research on safety ratings and features, reviews, tips and more can be found here: www.iihs.org/iihs/ratings. Frontal Small Overlap Poor Side Good Frontal Moderate Overlap Good Rollover Good Diagnostic Trouble Codes (DTCs) Diagnostic Trouble Codes (DTCs) are set by a control module when it detects faults in its system through self-diagnostics. The following section lists DTCs retrieved from various control modules of the vehicle. Engine Control Module (ECM) No Issues Found Transmission Control Module (TCM) 1 Code Found: U0100
Read page 15 text
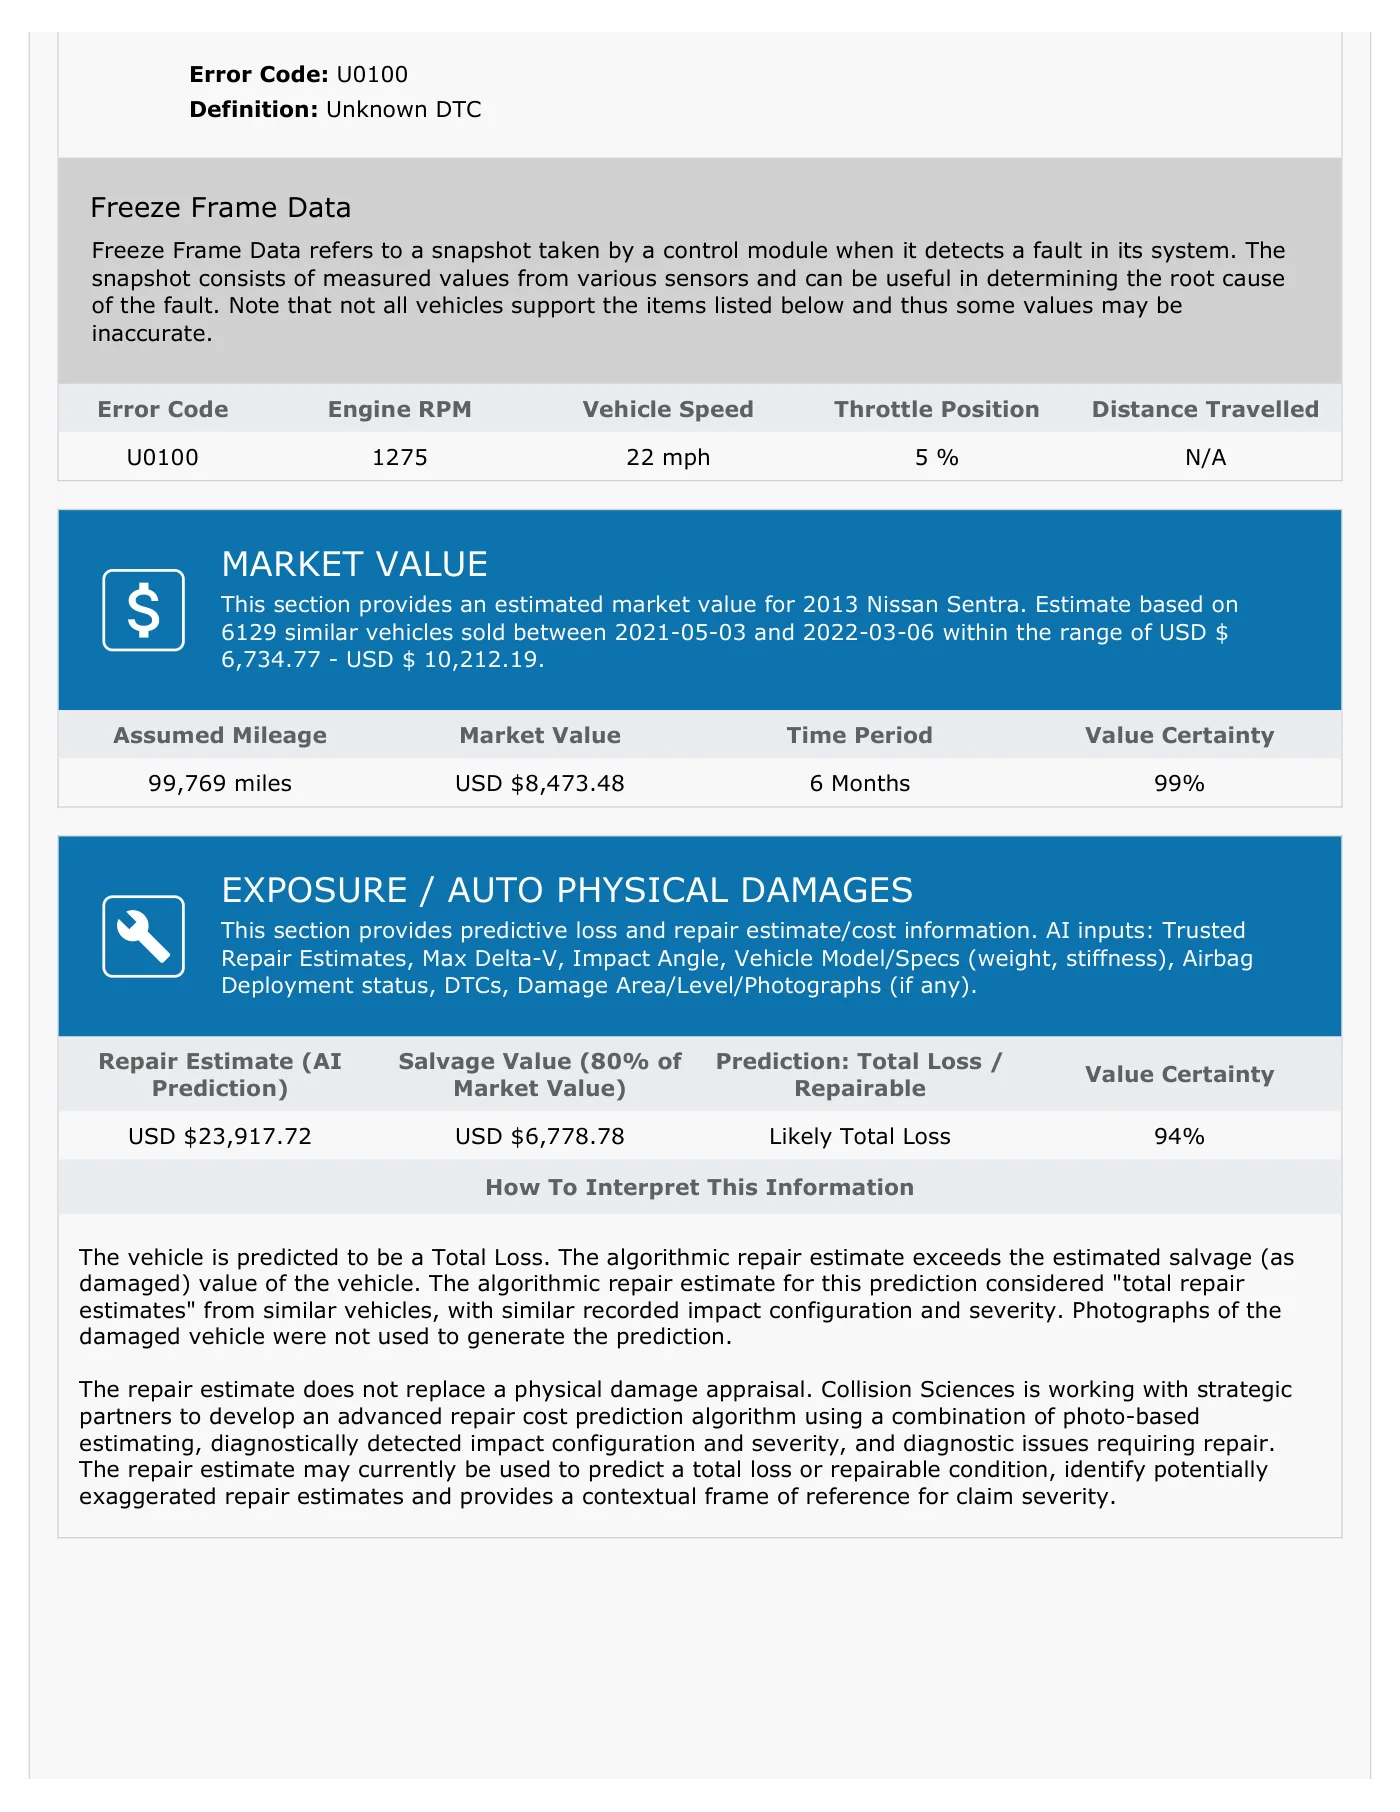
Error Code: U0100 Definition: Unknown DTC Freeze Frame Data Freeze Frame Data refers to a snapshot taken by a control module when it detects a fault in its system. The snapshot consists of measured values from various sensors and can be useful in determining the root cause of the fault. Note that not all vehicles support the items listed below and thus some values may be inaccurate. Error Code Engine RPM Vehicle Speed Throttle Position Distance Travelled U0100 1275 22 mph 5 % N/A MARKET VALUE This section provides an estimated market value for 2013 Nissan Sentra. Estimate based on 6129 similar vehicles sold between 2021-05-03 and 2022-03-06 within the range of USD $ 6,734.77 - USD $ 10,212.19. Assumed Mileage Market Value Time Period Value Certainty 99,769 miles USD $8,473.48 6 Months 99% EXPOSURE / AUTO PHYSICAL DAMAGES This section provides predictive loss and repair estimate/cost information. AI inputs: Trusted Repair Estimates, Max Delta-V, Impact Angle, Vehicle Model/Specs (weight, stiffness), Airbag Deployment status, DTCs, Damage Area/Level/Photographs (if any). Repair Estimate (AI Prediction) Salvage Value (80% of Market Value) Prediction: Total Loss / Repairable Value Certainty USD $23,917.72 USD $6,778.78 Likely Total Loss 94% How To Interpret This Information The vehicle is predicted to be a Total Loss. The algorithmic repair estimate exceeds the estimated salvage (as damaged) value of the vehicle. The algorithmic repair estimate for this prediction considered "total repair estimates" from similar vehicles, with similar recorded impact configuration and severity. Photographs of the damaged vehicle were not used to generate the prediction. The repair estimate does not replace a physical damage appraisal. Collision Sciences is working with strategic partners to develop an advanced repair cost prediction algorithm using a combination of photo-based estimating, diagnostically detected impact configuration and severity, and diagnostic issues requiring repair. The repair estimate may currently be used to predict a total loss or repairable condition, identify potentially exaggerated repair estimates and provides a contextual frame of reference for claim severity.
Read page 16 text
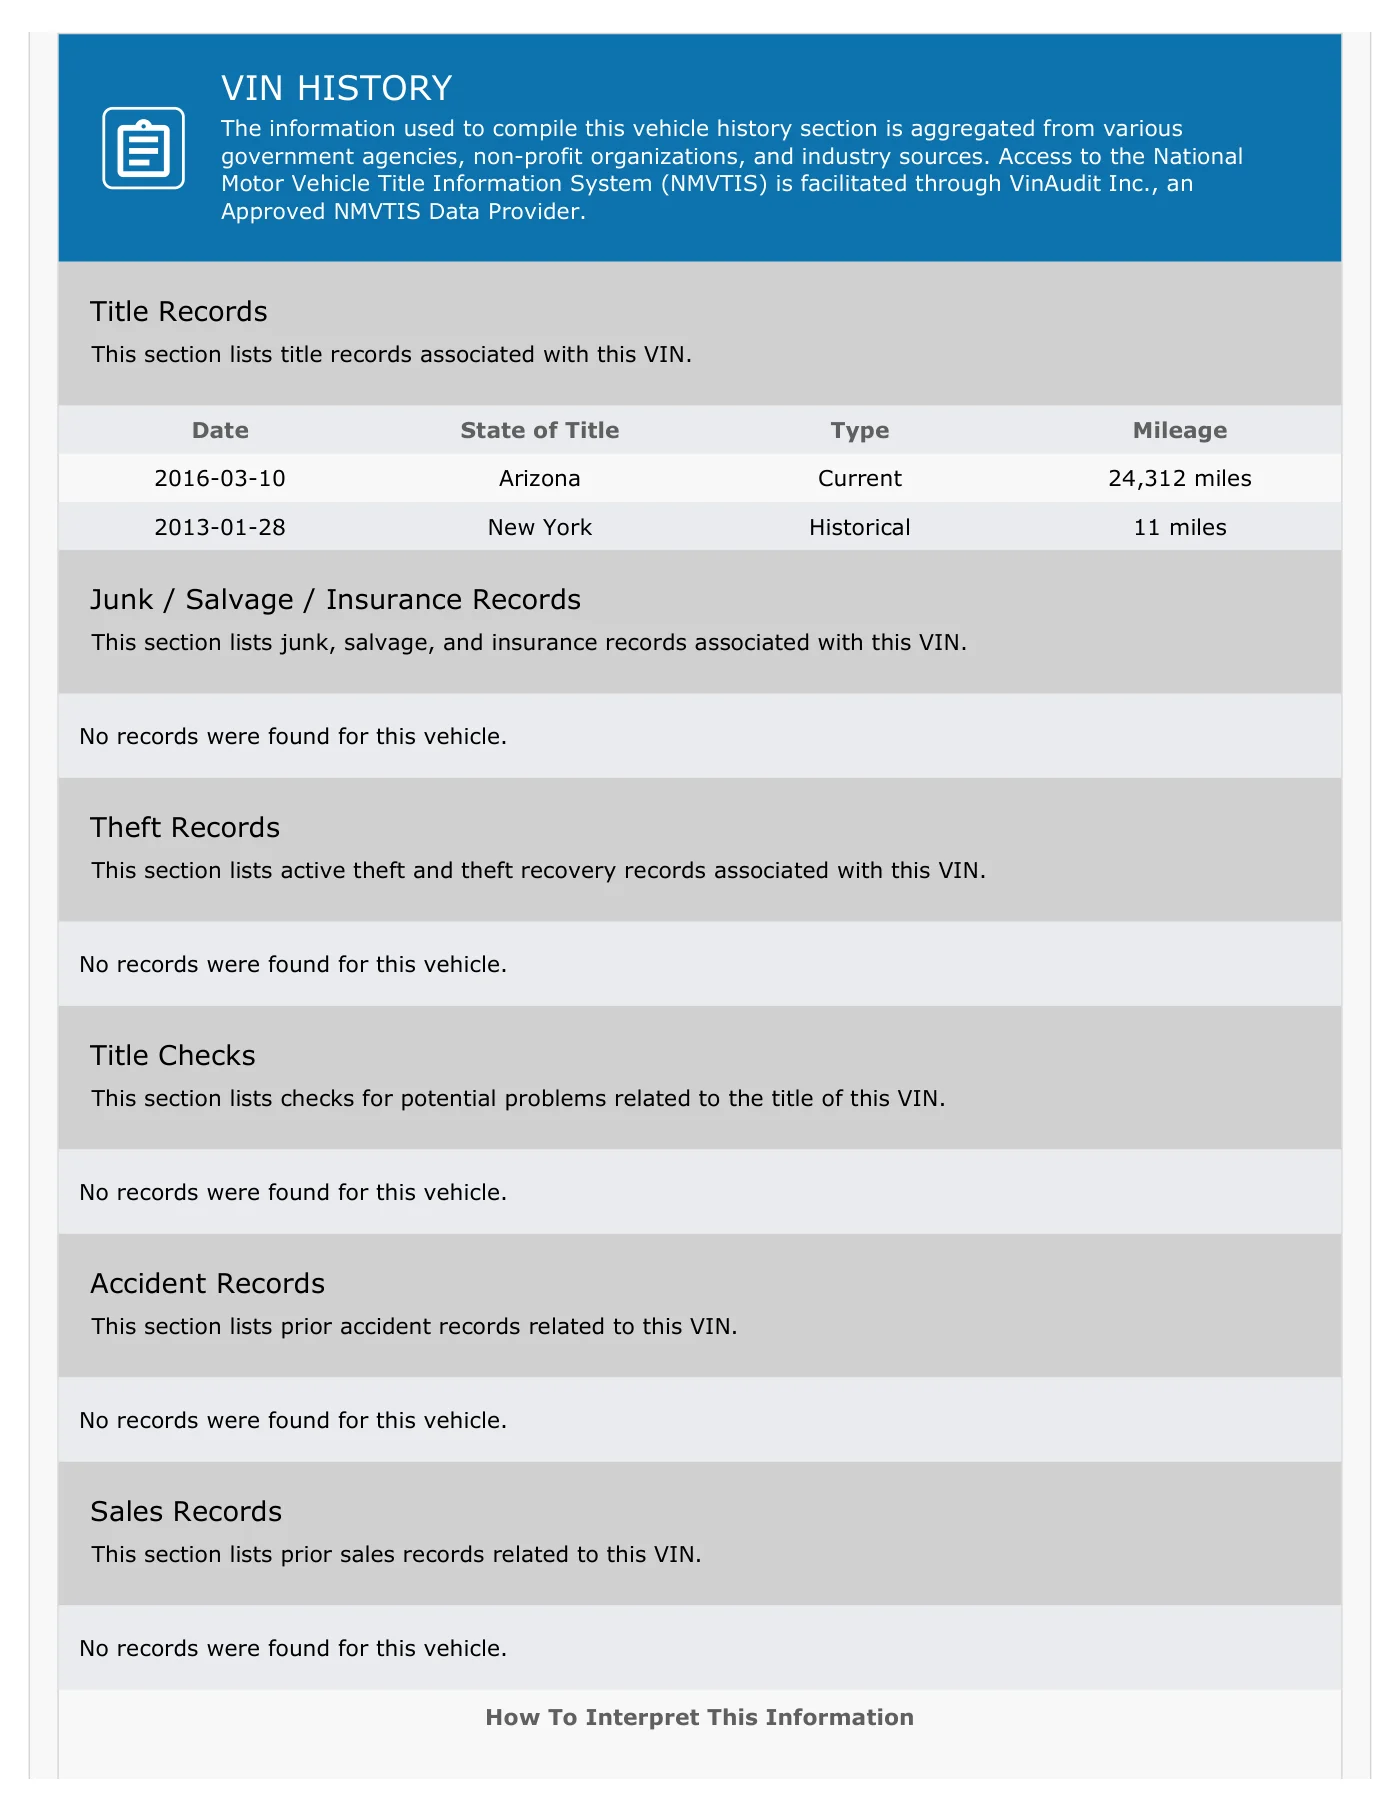
VIN HISTORY The information used to compile this vehicle history section is aggregated from various government agencies, non-profit organizations, and industry sources. Access to the National Motor Vehicle Title Information System (NMVTIS) is facilitated through VinAudit Inc., an Approved NMVTIS Data Provider. Title Records This section lists title records associated with this VIN. Date State of Title Type Mileage 2016-03-10 Arizona Current 24,312 miles 2013-01-28 New York Historical 11 miles Junk / Salvage / Insurance Records This section lists junk, salvage, and insurance records associated with this VIN. No records were found for this vehicle. Theft Records This section lists active theft and theft recovery records associated with this VIN. No records were found for this vehicle. Title Checks This section lists checks for potential problems related to the title of this VIN. No records were found for this vehicle. Accident Records This section lists prior accident records related to this VIN. No records were found for this vehicle. Sales Records This section lists prior sales records related to this VIN. No records were found for this vehicle. How To Interpret This Information
Read page 17 text
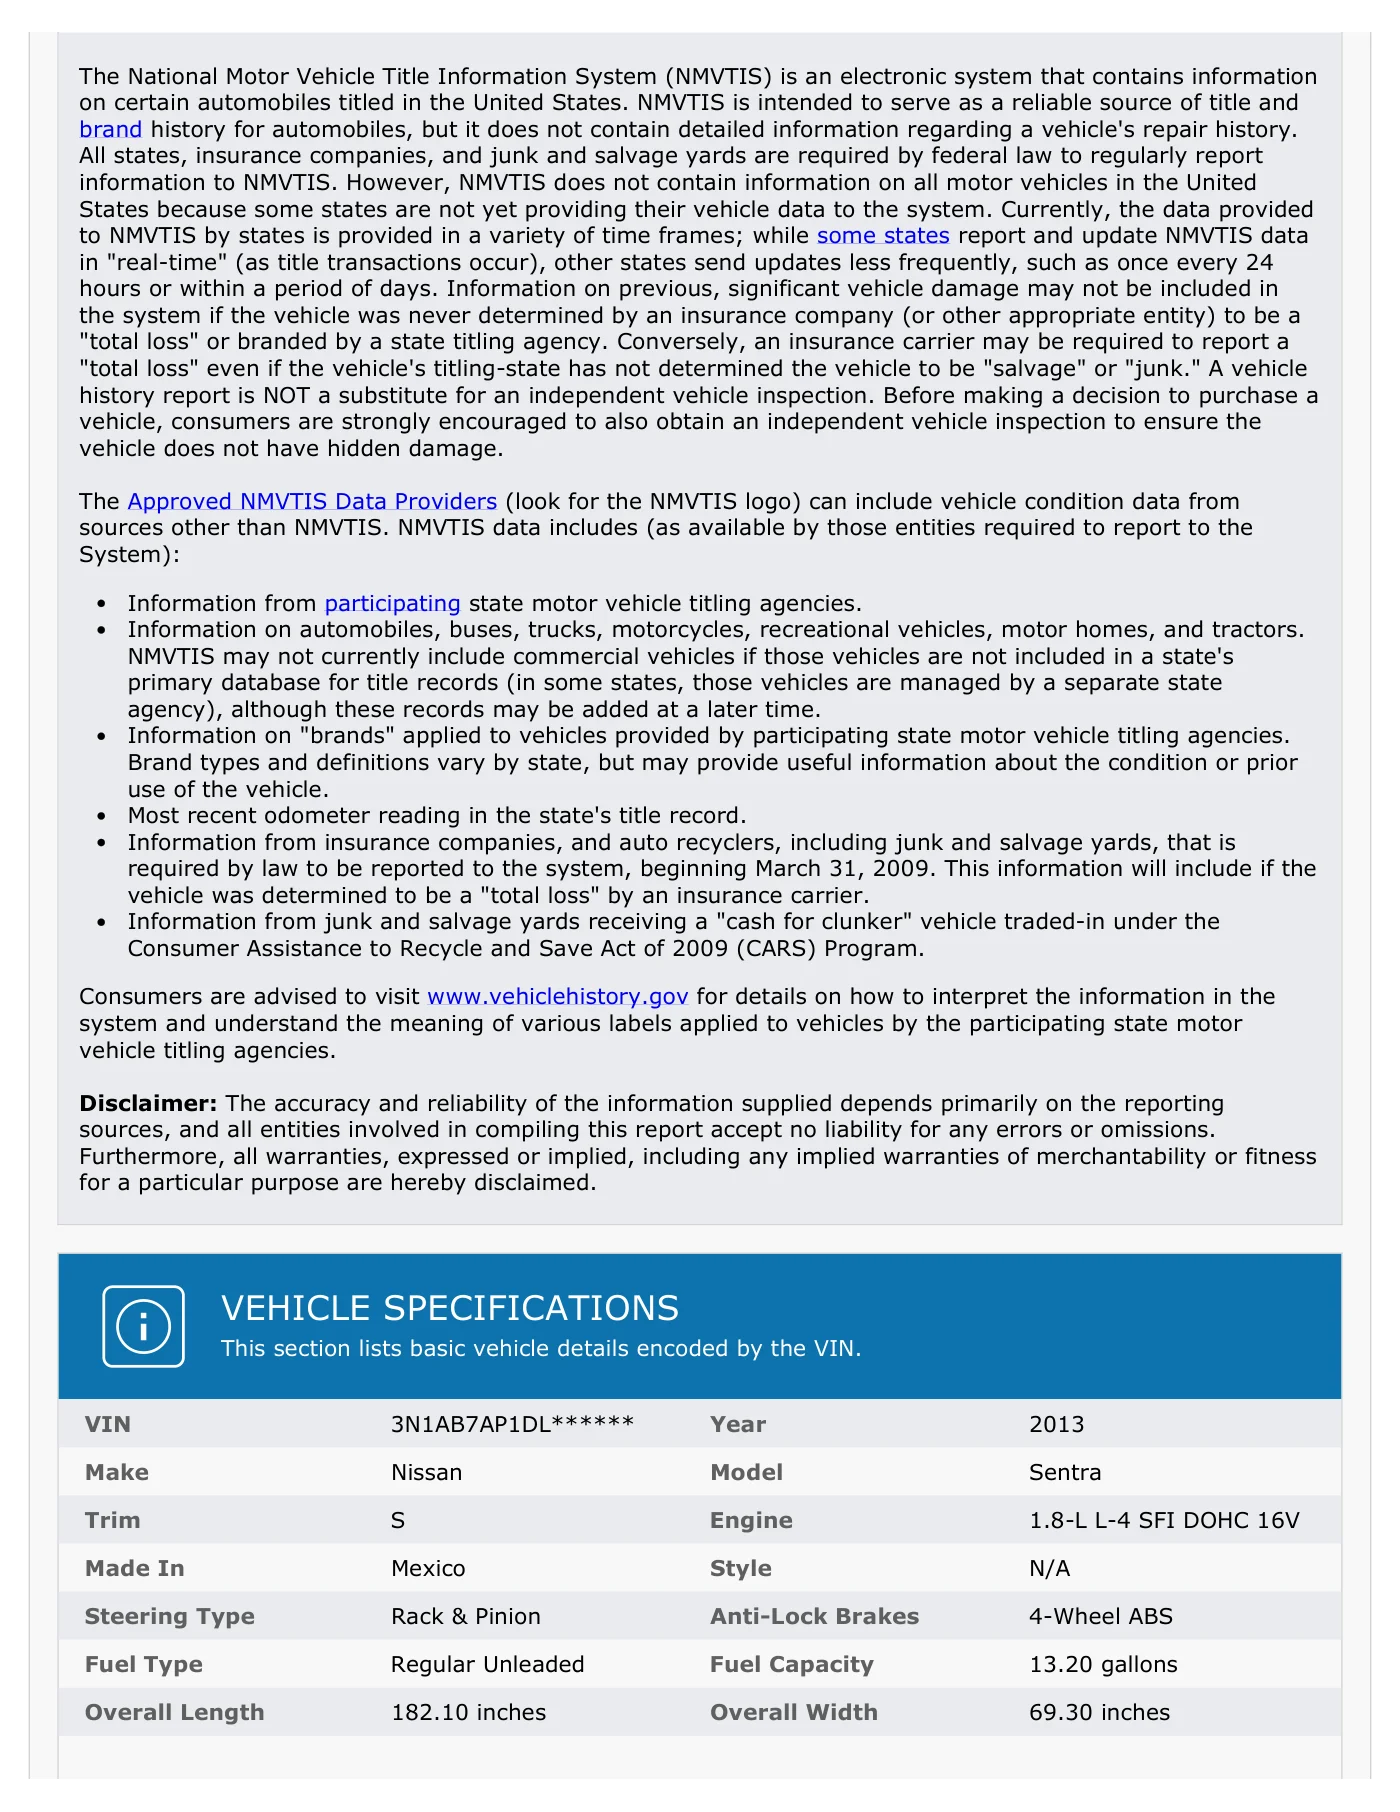
The National Motor Vehicle Title Information System (NMVTIS) is an electronic system that contains information on certain automobiles titled in the United States. NMVTIS is intended to serve as a reliable source of title and brand history for automobiles, but it does not contain detailed information regarding a vehicle's repair history. All states, insurance companies, and junk and salvage yards are required by federal law to regularly report information to NMVTIS. However, NMVTIS does not contain information on all motor vehicles in the United States because some states are not yet providing their vehicle data to the system. Currently, the data provided to NMVTIS by states is provided in a variety of time frames; while some states report and update NMVTIS data in "real-time" (as title transactions occur), other states send updates less frequently, such as once every 24 hours or within a period of days. Information on previous, significant vehicle damage may not be included in the system if the vehicle was never determined by an insurance company (or other appropriate entity) to be a "total loss" or branded by a state titling agency. Conversely, an insurance carrier may be required to report a "total loss" even if the vehicle's titling-state has not determined the vehicle to be "salvage" or "junk." A vehicle history report is NOT a substitute for an independent vehicle inspection. Before making a decision to purchase a vehicle, consumers are strongly encouraged to also obtain an independent vehicle inspection to ensure the vehicle does not have hidden damage. The Approved NMVTIS Data Providers (look for the NMVTIS logo) can include vehicle condition data from sources other than NMVTIS. NMVTIS data includes (as available by those entities required to report to the System): Consumers are advised to visit www.vehiclehistory.gov for details on how to interpret the information in the system and understand the meaning of various labels applied to vehicles by the participating state motor vehicle titling agencies. Disclaimer: The accuracy and reliability of the information supplied depends primarily on the reporting sources, and all entities involved in compiling this report accept no liability for any errors or omissions. Furthermore, all warranties, expressed or implied, including any implied warranties of merchantability or fitness for a particular purpose are hereby disclaimed. VEHICLE SPECIFICATIONS This section lists basic vehicle details encoded by the VIN. VIN 3N1AB7AP1DL****** Year 2013 Make Nissan Model Sentra Trim S Engine 1.8-L L-4 SFI DOHC 16V Made In Mexico Style N/A Steering Type Rack & Pinion Anti-Lock Brakes 4-Wheel ABS Fuel Type Regular Unleaded Fuel Capacity 13.20 gallons Overall Length 182.10 inches Overall Width 69.30 inches Information from participating state motor vehicle titling agencies. Information on automobiles, buses, trucks, motorcycles, recreational vehicles, motor homes, and tractors. NMVTIS may not currently include commercial vehicles if those vehicles are not included in a state's primary database for title records (in some states, those vehicles are managed by a separate state agency), although these records may be added at a later time. Information on "brands" applied to vehicles provided by participating state motor vehicle titling agencies. Brand types and definitions vary by state, but may provide useful information about the condition or prior use of the vehicle. Most recent odometer reading in the state's title record. Information from insurance companies, and auto recyclers, including junk and salvage yards, that is required by law to be reported to the system, beginning March 31, 2009. This information will include if the vehicle was determined to be a "total loss" by an insurance carrier. Information from junk and salvage yards receiving a "cash for clunker" vehicle traded-in under the Consumer Assistance to Recycle and Save Act of 2009 (CARS) Program.
Read page 18 text
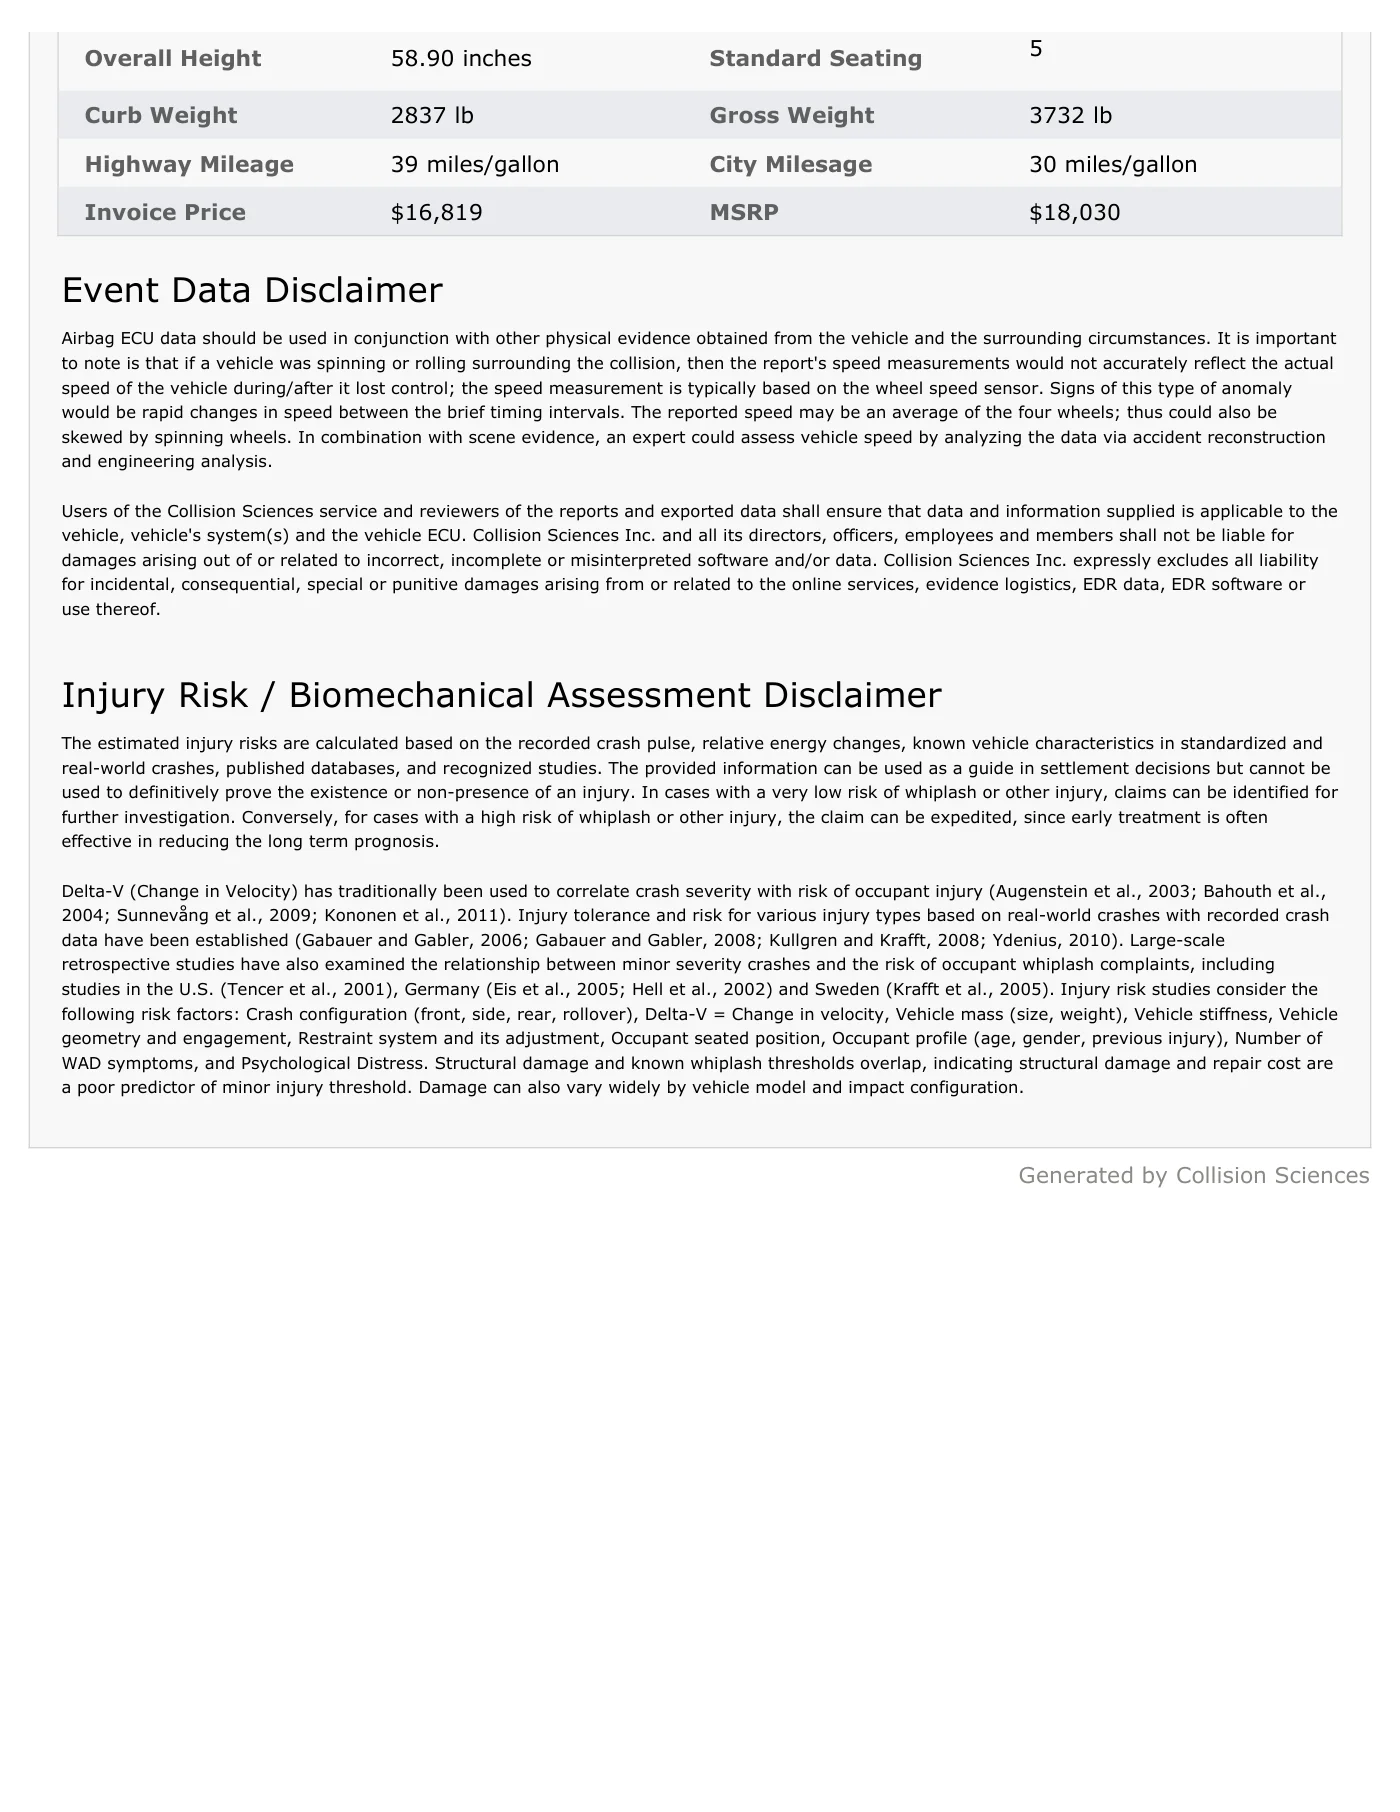
Generated by Collision Sciences Overall Height 58.90 inches Standard Seating 5 Curb Weight 2837 lb Gross Weight 3732 lb Highway Mileage 39 miles/gallon City Milesage 30 miles/gallon Invoice Price $16,819 MSRP $18,030 Event Data Disclaimer Airbag ECU data should be used in conjunction with other physical evidence obtained from the vehicle and the surrounding circumstances. It is important to note is that if a vehicle was spinning or rolling surrounding the collision, then the report's speed measurements would not accurately reflect the actual speed of the vehicle during/after it lost control; the speed measurement is typically based on the wheel speed sensor. Signs of this type of anomaly would be rapid changes in speed between the brief timing intervals. The reported speed may be an average of the four wheels; thus could also be skewed by spinning wheels. In combination with scene evidence, an expert could assess vehicle speed by analyzing the data via accident reconstruction and engineering analysis. Users of the Collision Sciences service and reviewers of the reports and exported data shall ensure that data and information supplied is applicable to the vehicle, vehicle's system(s) and the vehicle ECU. Collision Sciences Inc. and all its directors, officers, employees and members shall not be liable for damages arising out of or related to incorrect, incomplete or misinterpreted software and/or data. Collision Sciences Inc. expressly excludes all liability for incidental, consequential, special or punitive damages arising from or related to the online services, evidence logistics, EDR data, EDR software or use thereof. Injury Risk / Biomechanical Assessment Disclaimer The estimated injury risks are calculated based on the recorded crash pulse, relative energy changes, known vehicle characteristics in standardized and real-world crashes, published databases, and recognized studies. The provided information can be used as a guide in settlement decisions but cannot be used to definitively prove the existence or non-presence of an injury. In cases with a very low risk of whiplash or other injury, claims can be identified for further investigation. Conversely, for cases with a high risk of whiplash or other injury, the claim can be expedited, since early treatment is often effective in reducing the long term prognosis. Delta-V (Change in Velocity) has traditionally been used to correlate crash severity with risk of occupant injury (Augenstein et al., 2003; Bahouth et al., 2004; Sunnevång et al., 2009; Kononen et al., 2011). Injury tolerance and risk for various injury types based on real-world crashes with recorded crash data have been established (Gabauer and Gabler, 2006; Gabauer and Gabler, 2008; Kullgren and Krafft, 2008; Ydenius, 2010). Large-scale retrospective studies have also examined the relationship between minor severity crashes and the risk of occupant whiplash complaints, including studies in the U.S. (Tencer et al., 2001), Germany (Eis et al., 2005; Hell et al., 2002) and Sweden (Krafft et al., 2005). Injury risk studies consider the following risk factors: Crash configuration (front, side, rear, rollover), Delta-V = Change in velocity, Vehicle mass (size, weight), Vehicle stiffness, Vehicle geometry and engagement, Restraint system and its adjustment, Occupant seated position, Occupant profile (age, gender, previous injury), Number of WAD symptoms, and Psychological Distress. Structural damage and known whiplash thresholds overlap, indicating structural damage and repair cost are a poor predictor of minor injury threshold. Damage can also vary widely by vehicle model and impact configuration.