
Source page 1
Read page 1 extracted text
Extracted text may not preserve table columns. Refer to the page image or original PDF for data relationships.
P a g e | 1 Comparative Forensic Study of CrashScan EDR Outputs and a DEWESoft Krypton Reference System in Controlled Crash Tests Ing. Peter Vertal, Ph.D., Ing. Michal Frydryn, Ph.D., prof. Gustav Kasanicky, CSc., MBA Abstract: This study focuses on the critical validation of the CrashScan application, a tool designed for retrieving Event Data Recorder (EDR) information from Airbag Control Modules (ACMs). Through a series of controlled crash tests, including low-speed frontal impacts, high- speed frontal impacts, and rollover scenarios, this research rigorously compares CrashScan outputs with data obtained from an independent, high-resolution DEWESoft Krypton reference measurement system. The objective is to assess the reliability and consistency of CrashScan data for forensic accident reconstruction, while also identifying the inherent capabilities and limitations of EDR systems in capturing complex crash dynamics. Introduction frontal collision against a rigid barrier, and a dynamic rollover sequence. The combination of EDR retrieval, high-frequency Event Data Recorders (EDRs) embedded in modern vehicles accelerometric reference measurements, and 3D scanning of have become an increasingly important source of objective vehicle deformations provides a comprehensive basis for information for traffic accident reconstruction and forensic evaluating both the capabilities and the inherent constraints of practice. These systems, integrated primarily within Airbag EDR technology. Control Modules (ACMs), record a limited set of parameters before, during, and after a crash event. While EDRs provide Measuring equipment valuable insight into vehicle dynamics and occupant restraint To ensure the reliability of the recorded and retrieved values, the system behavior, their technical limitations, sampling test vehicles were fitted with an independent measurement frequencies, and data reduction algorithms often raise questions assembly consisting of a DEWESoft Krypton data acquisition regarding their reliability for forensic applications. unit with a dedicated power source, accelerometers supplied by To address these concerns, controlled crash experiments remain Kistler and Measurement Specialties, potentiometers from a fundamental method for evaluating the accuracy and Micro-Epsilon, a seat belt force transducer, and a purpose-built consistency of EDR outputs. By subjecting vehicles to measurement computer. This configuration is hereinafter reproducible impact scenarios and simultaneously recording designated as the Krypton measurement system. reference measurements through high-resolution The measurement computer was engineered specifically for instrumentation, it becomes possible to critically assess the demanding conditions such as crash testing and was therefore evidential value of EDR datasets. Such comparative validation designed without any rotating or freely suspended components. studies are essential for strengthening expert testimony in In essence, it consists of a mainboard with standard PC judicial and insurance proceedings, where data integrity and elements—including a network interface card and Wi-Fi methodological transparency are paramount. module—housed within a robust aluminum enclosure. This unit This article presents a comparative forensic study of EDR data provides configuration of measurement parameters, execution of retrieved with the CrashScan application against an independent acquisition software, and secure storage of collected data. DEWESoft Krypton reference system. Three representative crash Communication is achieved via wireless connection with scenarios were selected: a low-speed frontal impact, a high-speed remote-desktop access.
Source page 2
Read page 2 extracted text
Extracted text may not preserve table columns. Refer to the page image or original PDF for data relationships.
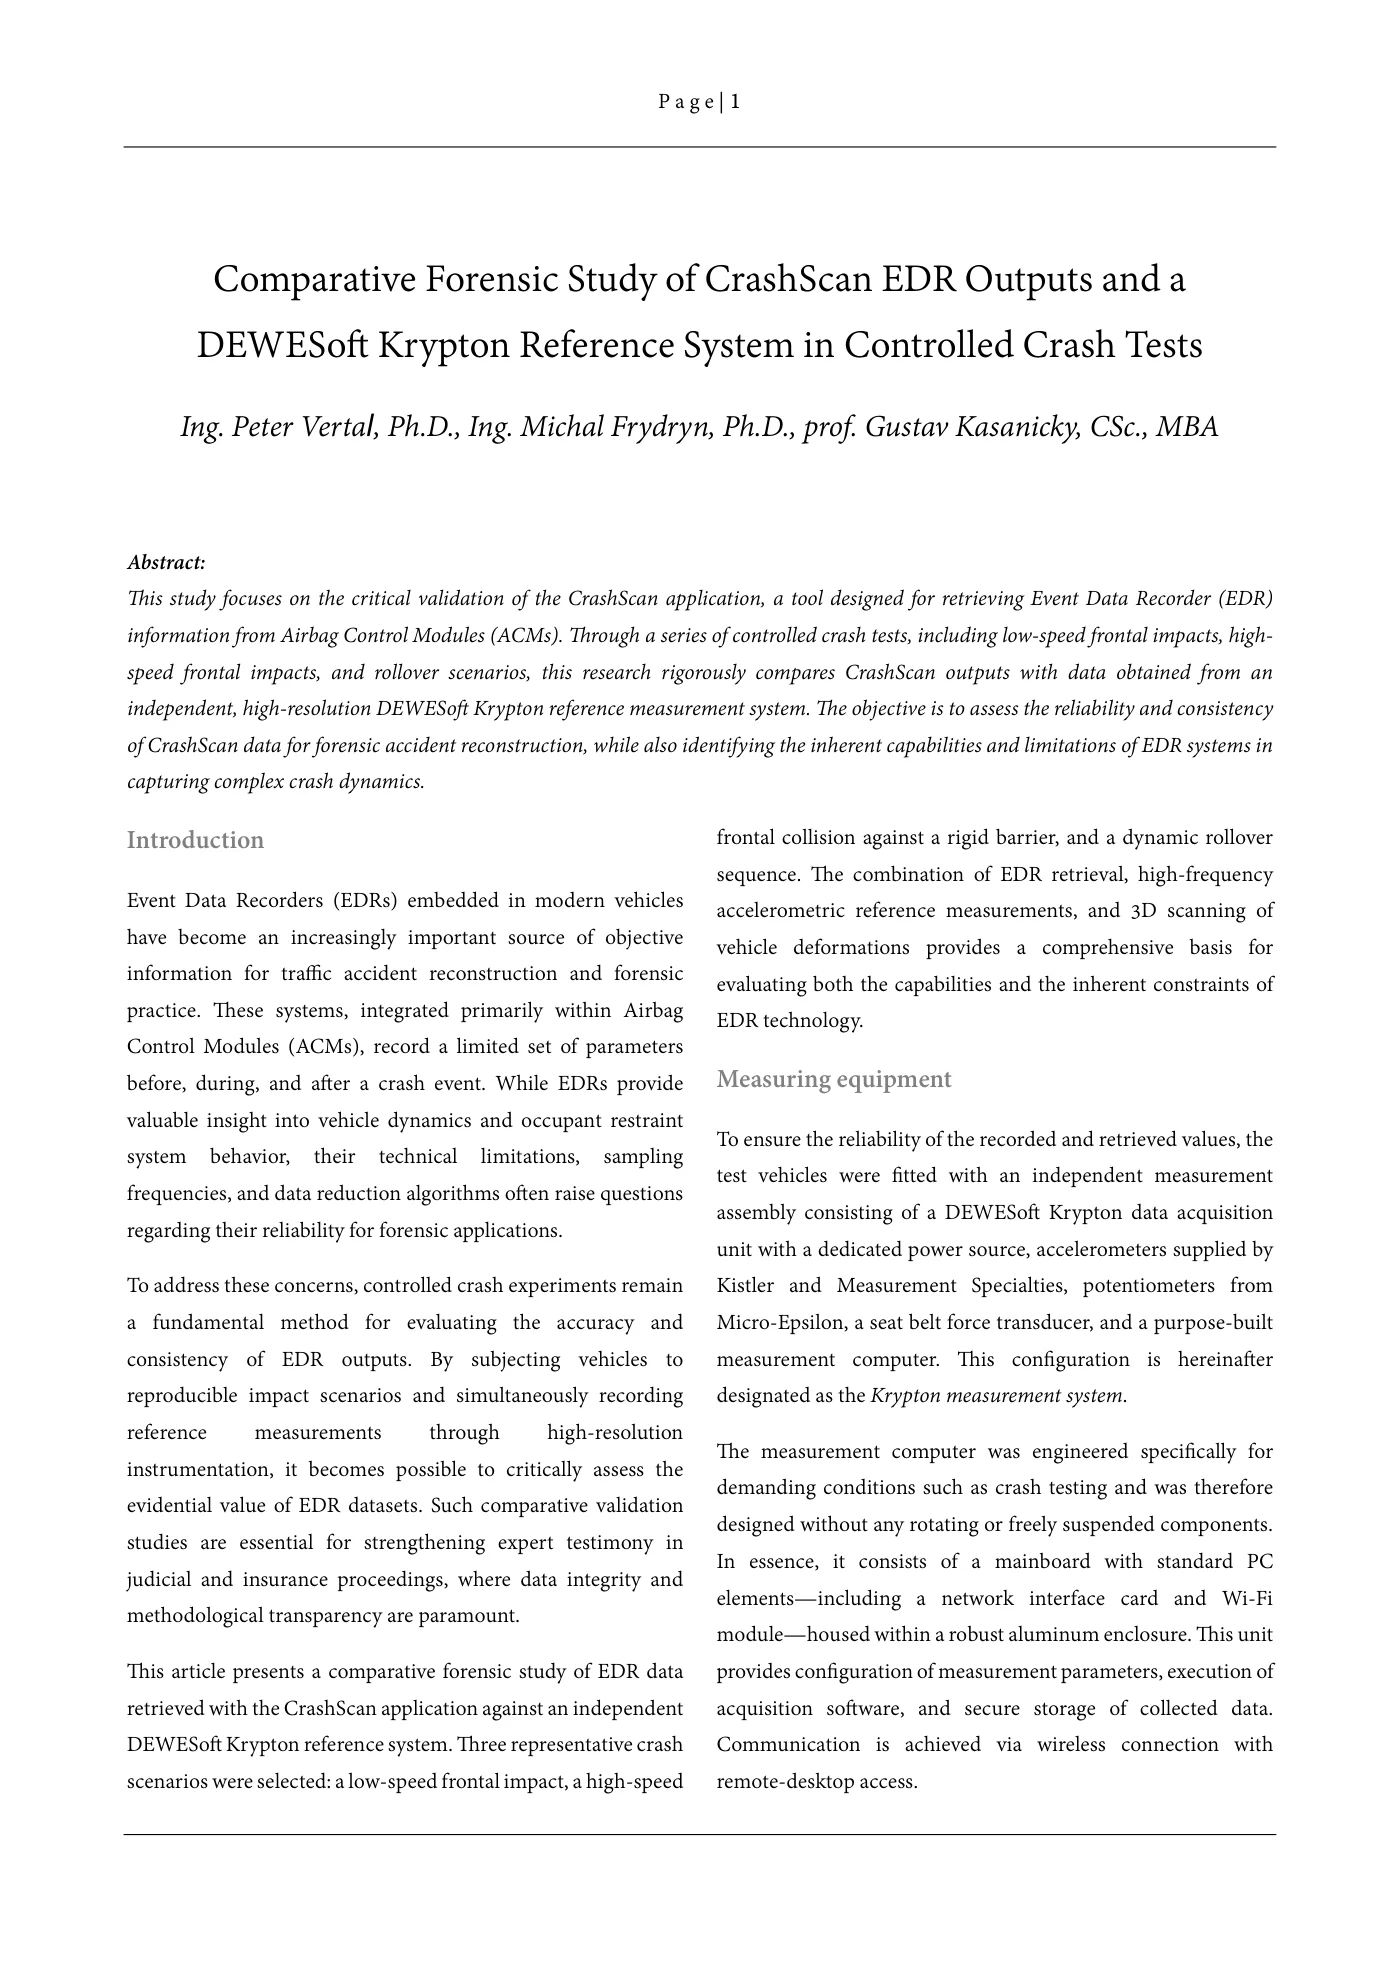
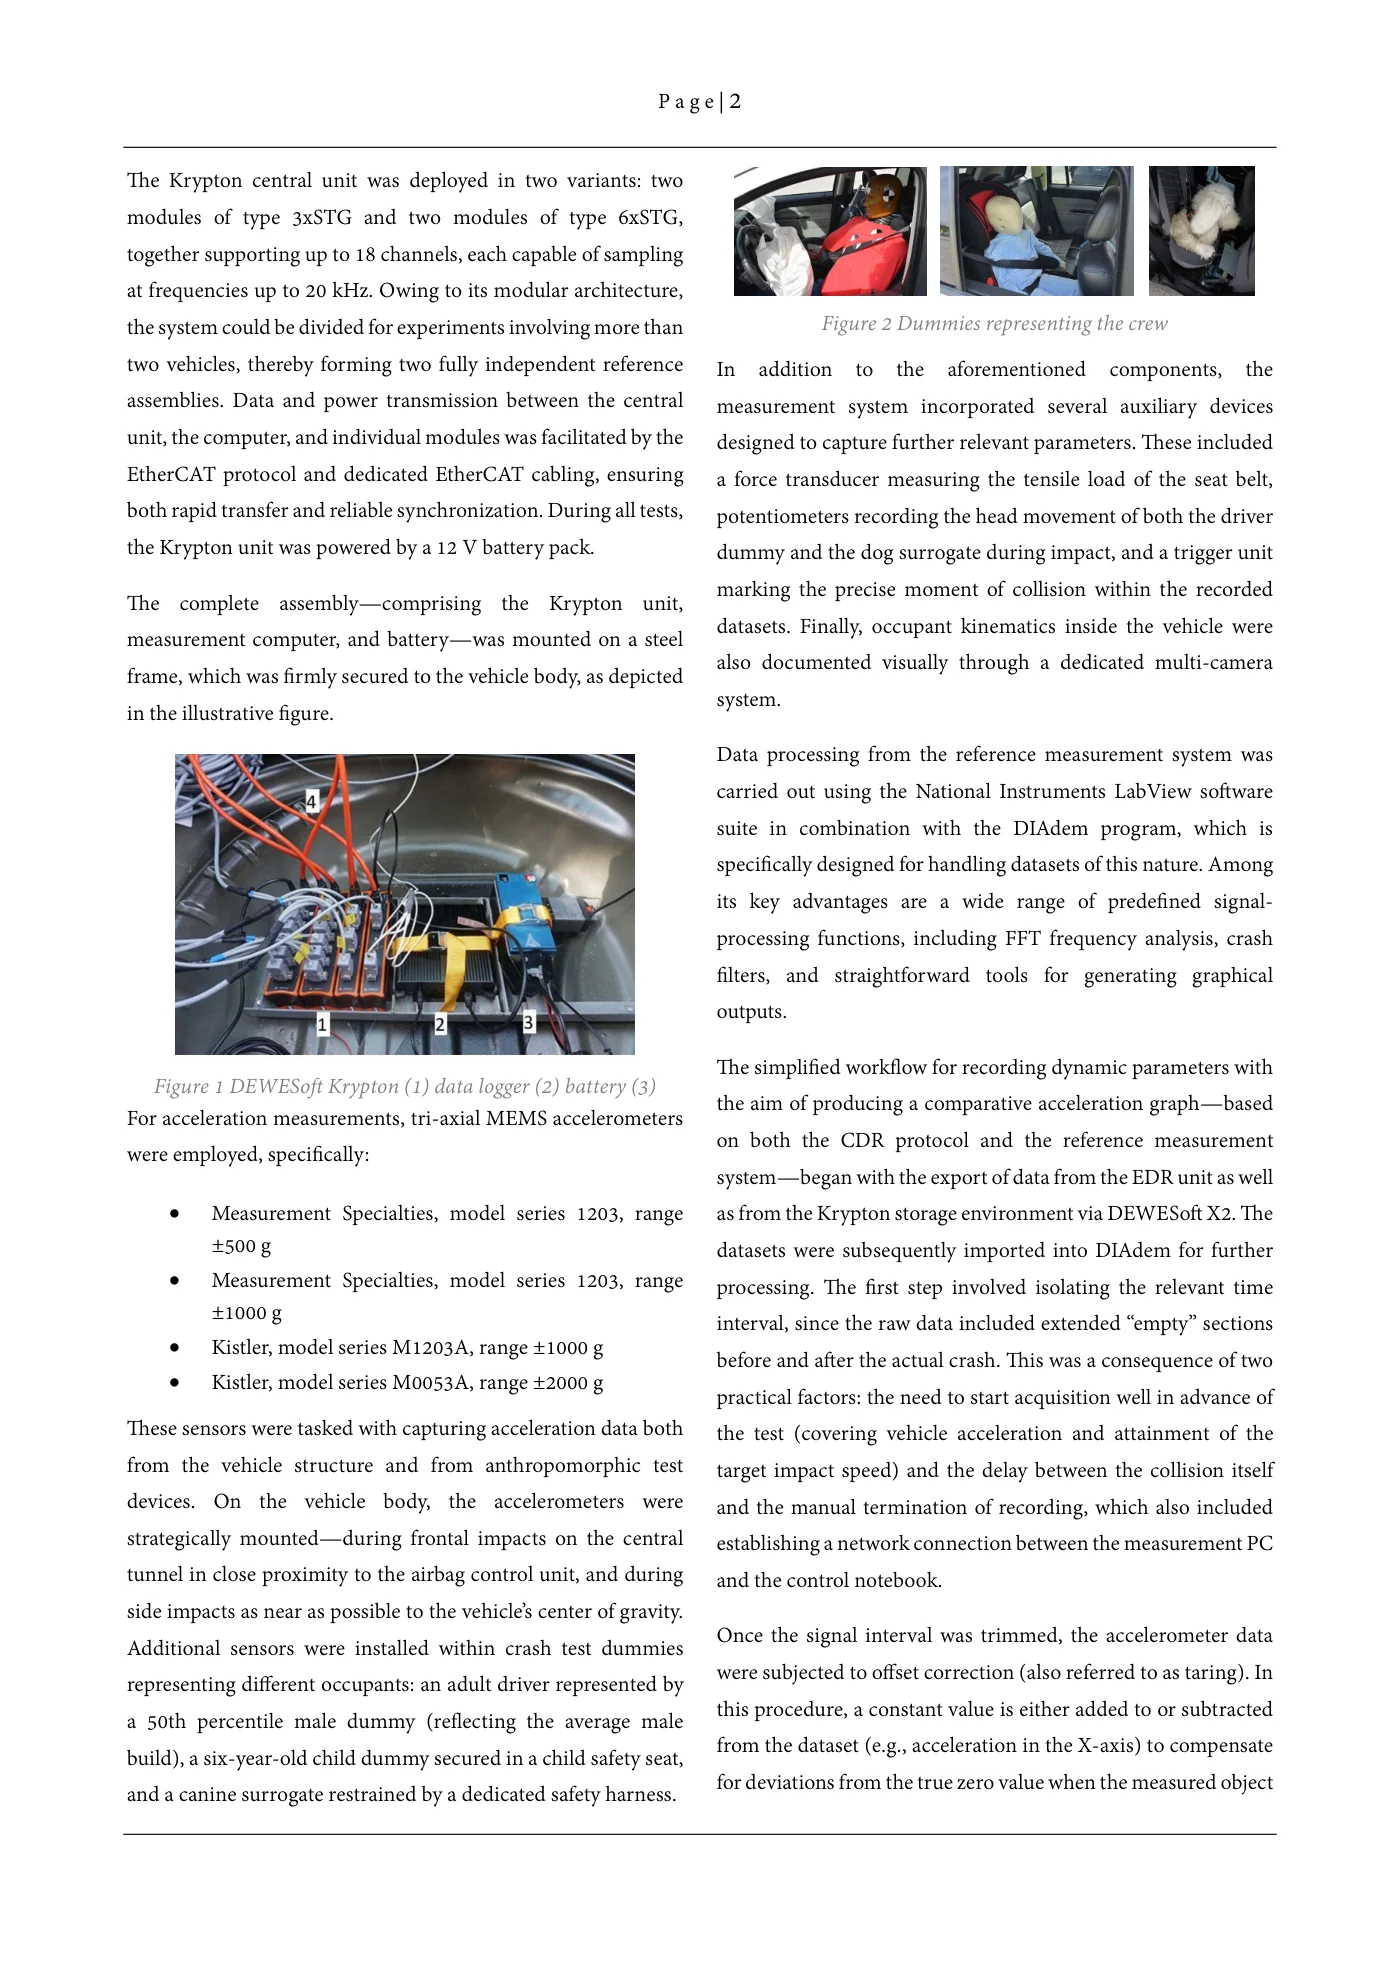
P a g e | 2 The Krypton central unit was deployed in two variants: two modules of type 3xSTG and two modules of type 6xSTG, together supporting up to 18 channels, each capable of sampling at frequencies up to 20 kHz. Owing to its modular architecture, the system could be divided for experiments involving more than Figure 2 Dummies representing the crew two vehicles, thereby forming two fully independent reference In addition to the aforementioned components, the assemblies. Data and power transmission between the central measurement system incorporated several auxiliary devices unit, the computer, and individual modules was facilitated by the designed to capture further relevant parameters. These included EtherCAT protocol and dedicated EtherCAT cabling, ensuring a force transducer measuring the tensile load of the seat belt, both rapid transfer and reliable synchronization. During all tests, potentiometers recording the head movement of both the driver the Krypton unit was powered by a 12 V battery pack. dummy and the dog surrogate during impact, and a trigger unit marking the precise moment of collision within the recordedThe complete assembly—comprising the Krypton unit, datasets. Finally, occupant kinematics inside the vehicle weremeasurement computer, and battery—was mounted on a steel also documented visually through a dedicated multi-cameraframe, which was firmly secured to the vehicle body, as depicted system.in the illustrative figure. Data processing from the reference measurement system was carried out using the National Instruments LabView software suite in combination with the DIAdem program, which is specifically designed for handling datasets of this nature. Among its key advantages are a wide range of predefined signal- processing functions, including FFT frequency analysis, crash filters, and straightforward tools for generating graphical outputs. The simplified workflow for recording dynamic parameters with Figure 1 DEWESoft Krypton (1) data logger (2) battery (3) the aim of producing a comparative acceleration graph—basedFor acceleration measurements, tri-axial MEMS accelerometers on both the CDR protocol and the reference measurementwere employed, specifically: system—began with the export of data from the EDR unit as well • Measurement Specialties, model series 1203, range as from the Krypton storage environment via DEWESoft X2. The ±500 g datasets were subsequently imported into DIAdem for further • Measurement Specialties, model series 1203, range processing. The first step involved isolating the relevant time ±1000 g interval, since the raw data included extended “empty” sections • Kistler, model series M1203A, range ±1000 g before and after the actual crash. This was a consequence of two • Kistler, model series M0053A, range ±2000 g practical factors: the need to start acquisition well in advance of These sensors were tasked with capturing acceleration data both the test (covering vehicle acceleration and attainment of the from the vehicle structure and from anthropomorphic test target impact speed) and the delay between the collision itself devices. On the vehicle body, the accelerometers were and the manual termination of recording, which also included strategically mounted—during frontal impacts on the central establishing a network connection between the measurement PC tunnel in close proximity to the airbag control unit, and during and the control notebook. side impacts as near as possible to the vehicle’s center of gravity. Once the signal interval was trimmed, the accelerometer dataAdditional sensors were installed within crash test dummies were subjected to offset correction (also referred to as taring). Inrepresenting different occupants: an adult driver represented by this procedure, a constant value is either added to or subtracteda 50th percentile male dummy (reflecting the average male from the dataset (e.g., acceleration in the X-axis) to compensatebuild), a six-year-old child dummy secured in a child safety seat, for deviations from the true zero value when the measured objectand a canine surrogate restrained by a dedicated safety harness.
Source page 3
Read page 3 extracted text
Extracted text may not preserve table columns. Refer to the page image or original PDF for data relationships.
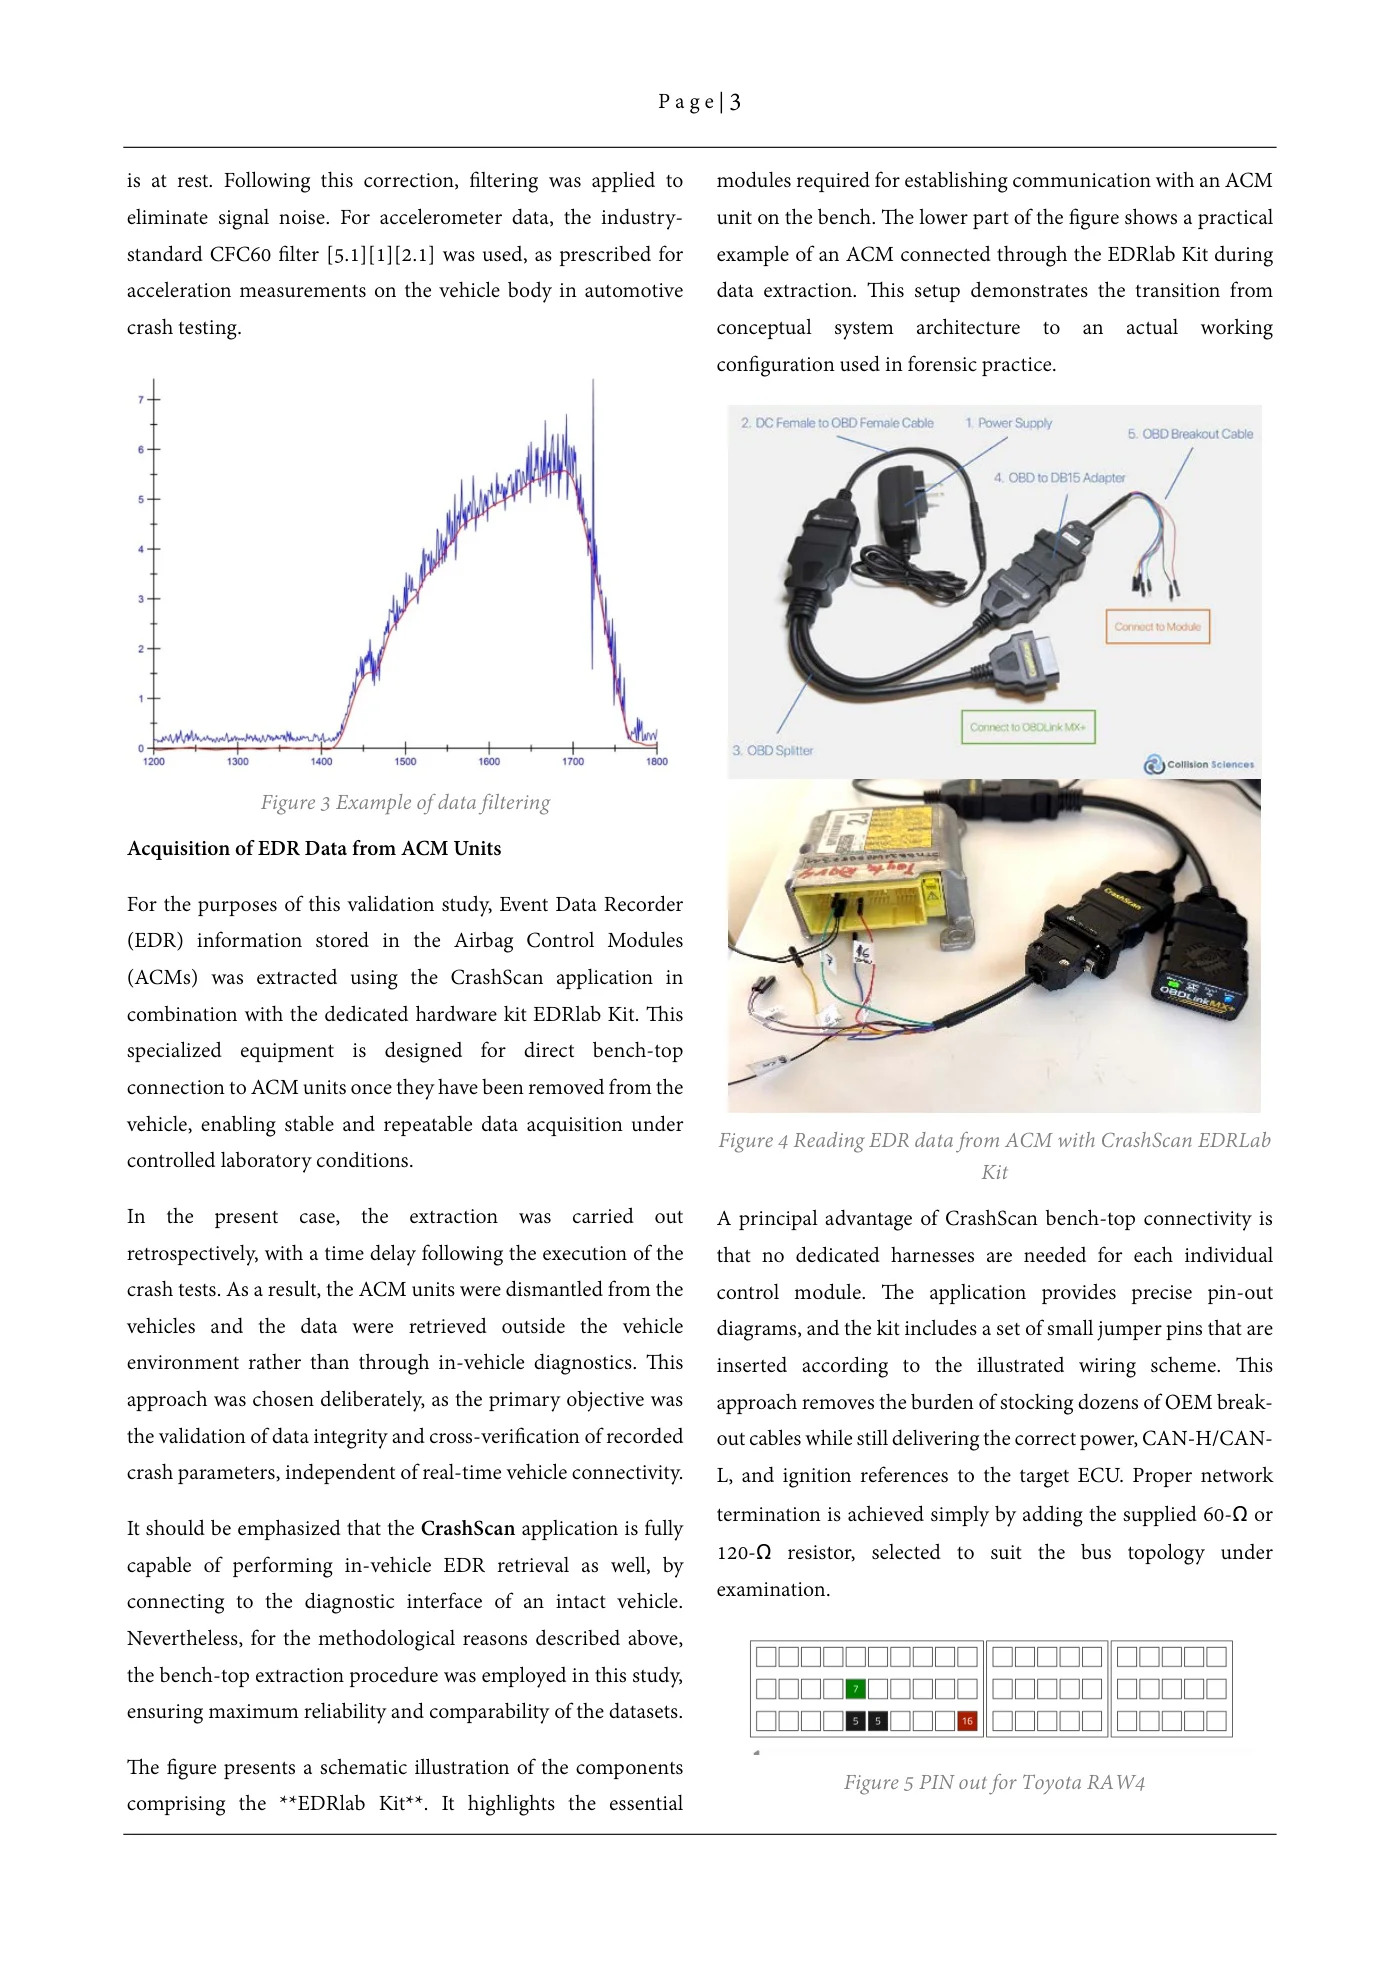
P a g e | 3 is at rest. Following this correction, filtering was applied to modules required for establishing communication with an ACM eliminate signal noise. For accelerometer data, the industry- unit on the bench. The lower part of the figure shows a practical standard CFC60 filter [5.1][1][2.1] was used, as prescribed for example of an ACM connected through the EDRlab Kit during acceleration measurements on the vehicle body in automotive data extraction. This setup demonstrates the transition from crash testing. conceptual system architecture to an actual working configuration used in forensic practice. Figure 3 Example of data filtering Acquisition of EDR Data from ACM Units For the purposes of this validation study, Event Data Recorder (EDR) information stored in the Airbag Control Modules (ACMs) was extracted using the CrashScan application in combination with the dedicated hardware kit EDRlab Kit. This specialized equipment is designed for direct bench-top connection to ACM units once they have been removed from the vehicle, enabling stable and repeatable data acquisition under Figure 4 Reading EDR data from ACM with CrashScan EDRLab controlled laboratory conditions. Kit In the present case, the extraction was carried out A principal advantage of CrashScan bench-top connectivity is retrospectively, with a time delay following the execution of the that no dedicated harnesses are needed for each individual crash tests. As a result, the ACM units were dismantled from the control module. The application provides precise pin-out vehicles and the data were retrieved outside the vehicle diagrams, and the kit includes a set of small jumper pins that are environment rather than through in-vehicle diagnostics. This inserted according to the illustrated wiring scheme. This approach was chosen deliberately, as the primary objective was approach removes the burden of stocking dozens of OEM break- the validation of data integrity and cross-verification of recorded out cables while still delivering the correct power, CAN-H/CAN- crash parameters, independent of real-time vehicle connectivity. L, and ignition references to the target ECU. Proper network termination is achieved simply by adding the supplied 60-Ω orIt should be emphasized that the CrashScan application is fully 120-Ω resistor, selected to suit the bus topology undercapable of performing in-vehicle EDR retrieval as well, by examination.connecting to the diagnostic interface of an intact vehicle. Nevertheless, for the methodological reasons described above, the bench-top extraction procedure was employed in this study, ensuring maximum reliability and comparability of the datasets. The figure presents a schematic illustration of the components Figure 5 PIN out for Toyota RAW4 comprising the **EDRlab Kit**. It highlights the essential
Source page 4
Read page 4 extracted text
Extracted text may not preserve table columns. Refer to the page image or original PDF for data relationships.
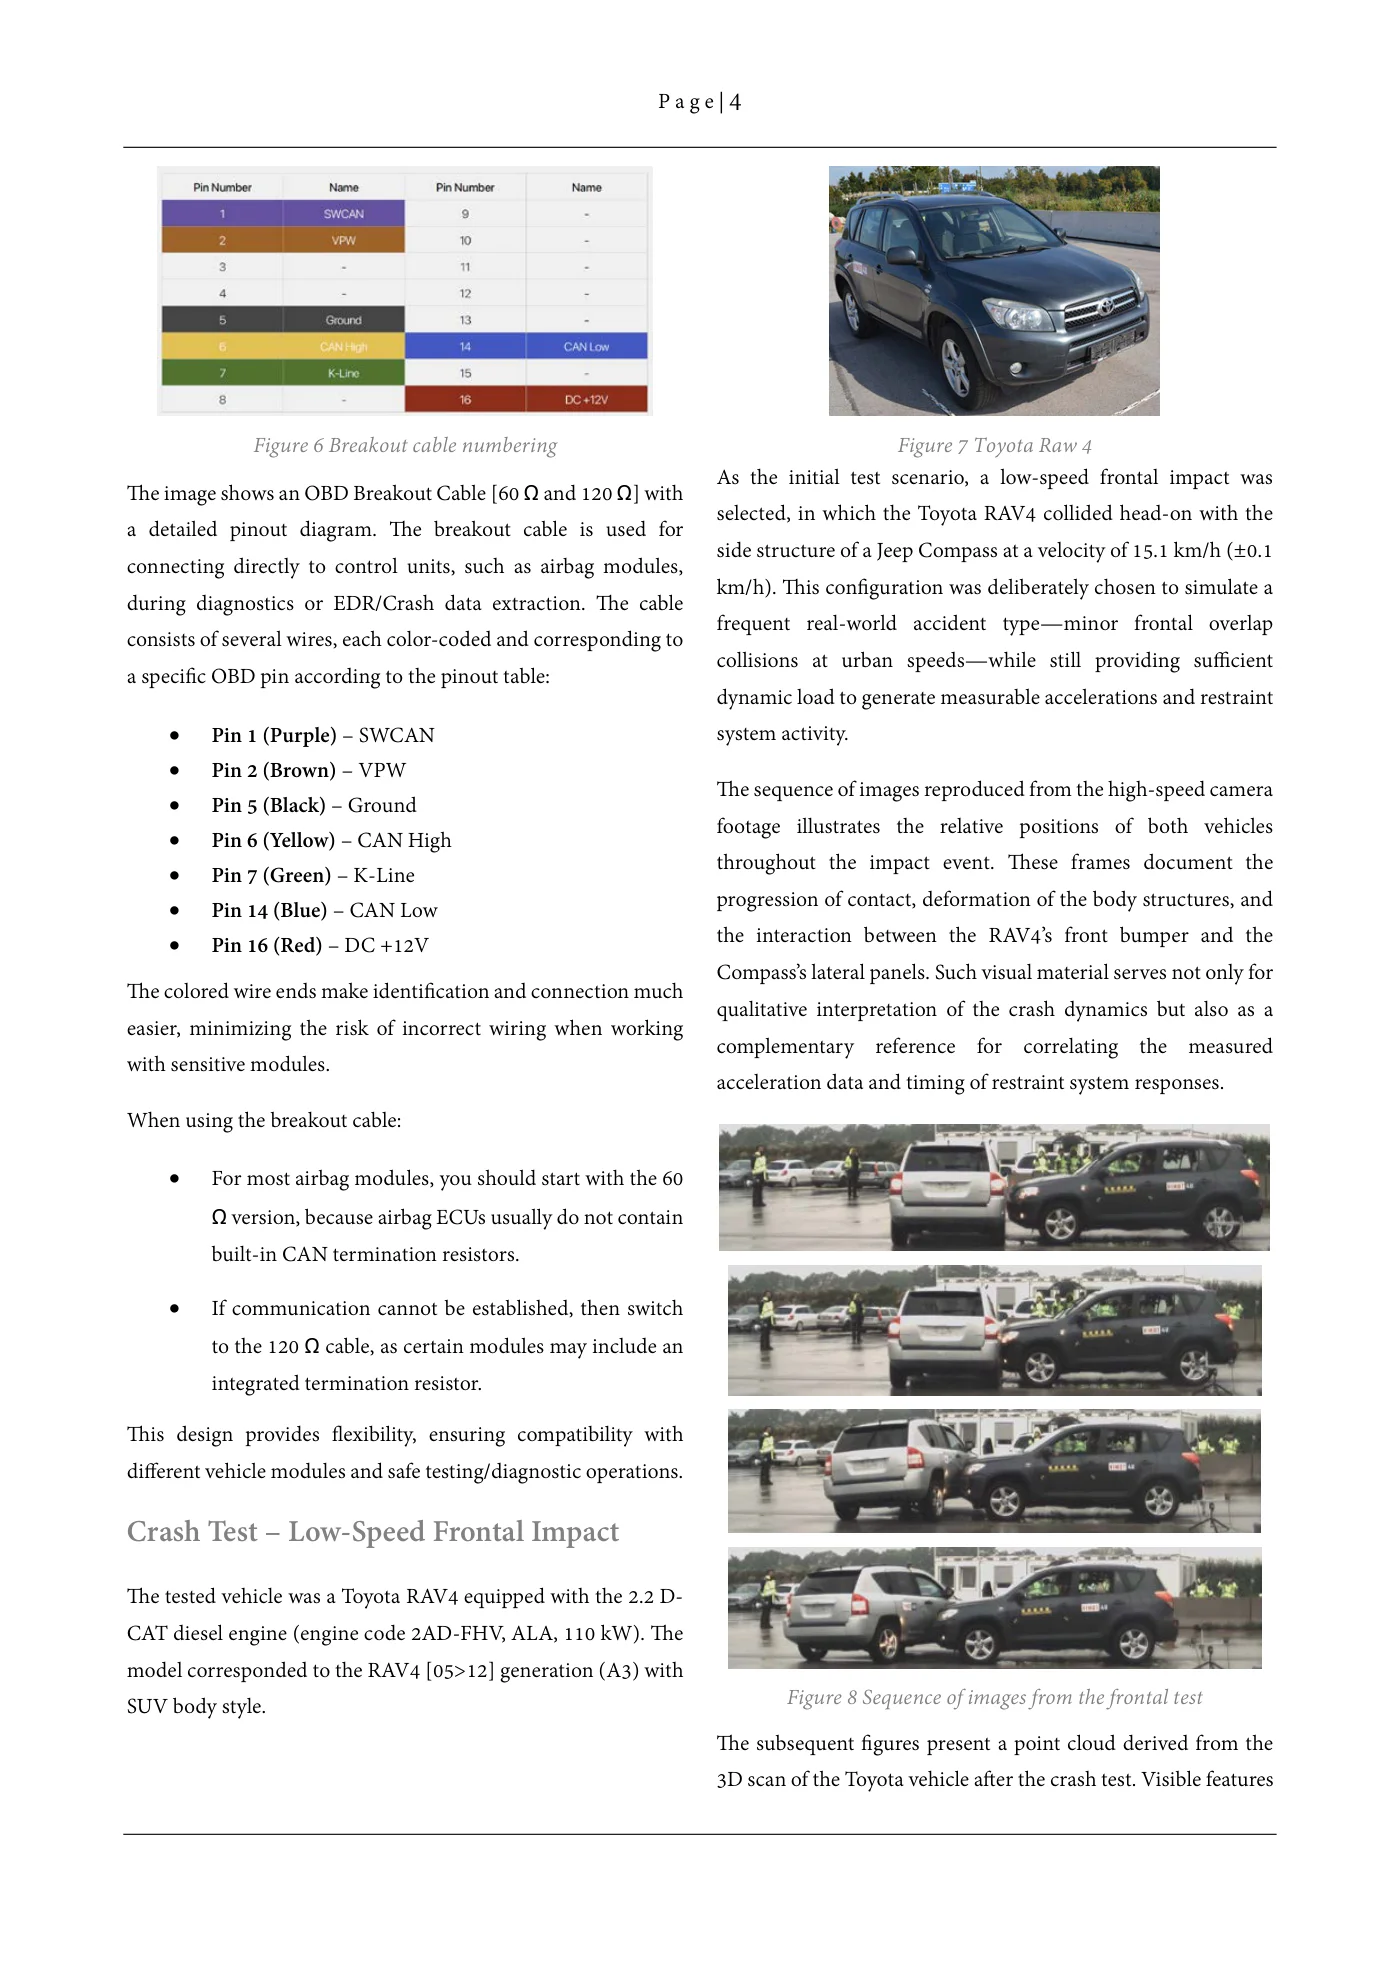
P a g e | 4 Figure 6 Breakout cable numbering Figure 7 Toyota Raw 4 As the initial test scenario, a low-speed frontal impact wasThe image shows an OBD Breakout Cable [60 Ω and 120 Ω] with selected, in which the Toyota RAV4 collided head-on with the a detailed pinout diagram. The breakout cable is used for side structure of a Jeep Compass at a velocity of 15.1 km/h (±0.1 connecting directly to control units, such as airbag modules, km/h). This configuration was deliberately chosen to simulate a during diagnostics or EDR/Crash data extraction. The cable frequent real-world accident type—minor frontal overlap consists of several wires, each color-coded and corresponding to collisions at urban speeds—while still providing sufficient a specific OBD pin according to the pinout table: dynamic load to generate measurable accelerations and restraint • Pin 1 (Purple) – SWCAN system activity. • Pin 2 (Brown) – VPW The sequence of images reproduced from the high-speed camera • Pin 5 (Black) – Ground footage illustrates the relative positions of both vehicles • Pin 6 (Yellow) – CAN High throughout the impact event. These frames document the • Pin 7 (Green) – K-Line progression of contact, deformation of the body structures, and • Pin 14 (Blue) – CAN Low • Pin 16 (Red) – DC +12V the interaction between the RAV4’s front bumper and the Compass’s lateral panels. Such visual material serves not only for The colored wire ends make identification and connection much qualitative interpretation of the crash dynamics but also as a easier, minimizing the risk of incorrect wiring when working complementary reference for correlating the measured with sensitive modules. acceleration data and timing of restraint system responses. When using the breakout cable: • For most airbag modules, you should start with the 60 Ω version, because airbag ECUs usually do not contain built-in CAN termination resistors. • If communication cannot be established, then switch to the 120 Ω cable, as certain modules may include an integrated termination resistor. This design provides flexibility, ensuring compatibility with different vehicle modules and safe testing/diagnostic operations. Crash Test – Low-Speed Frontal Impact The tested vehicle was a Toyota RAV4 equipped with the 2.2 D- CAT diesel engine (engine code 2AD-FHV, ALA, 110 kW). The model corresponded to the RAV4 [05>12] generation (A3) with Figure 8 Sequence of images from the frontal testSUV body style. The subsequent figures present a point cloud derived from the 3D scan of the Toyota vehicle after the crash test. Visible features
Source page 5
Read page 5 extracted text
Extracted text may not preserve table columns. Refer to the page image or original PDF for data relationships.
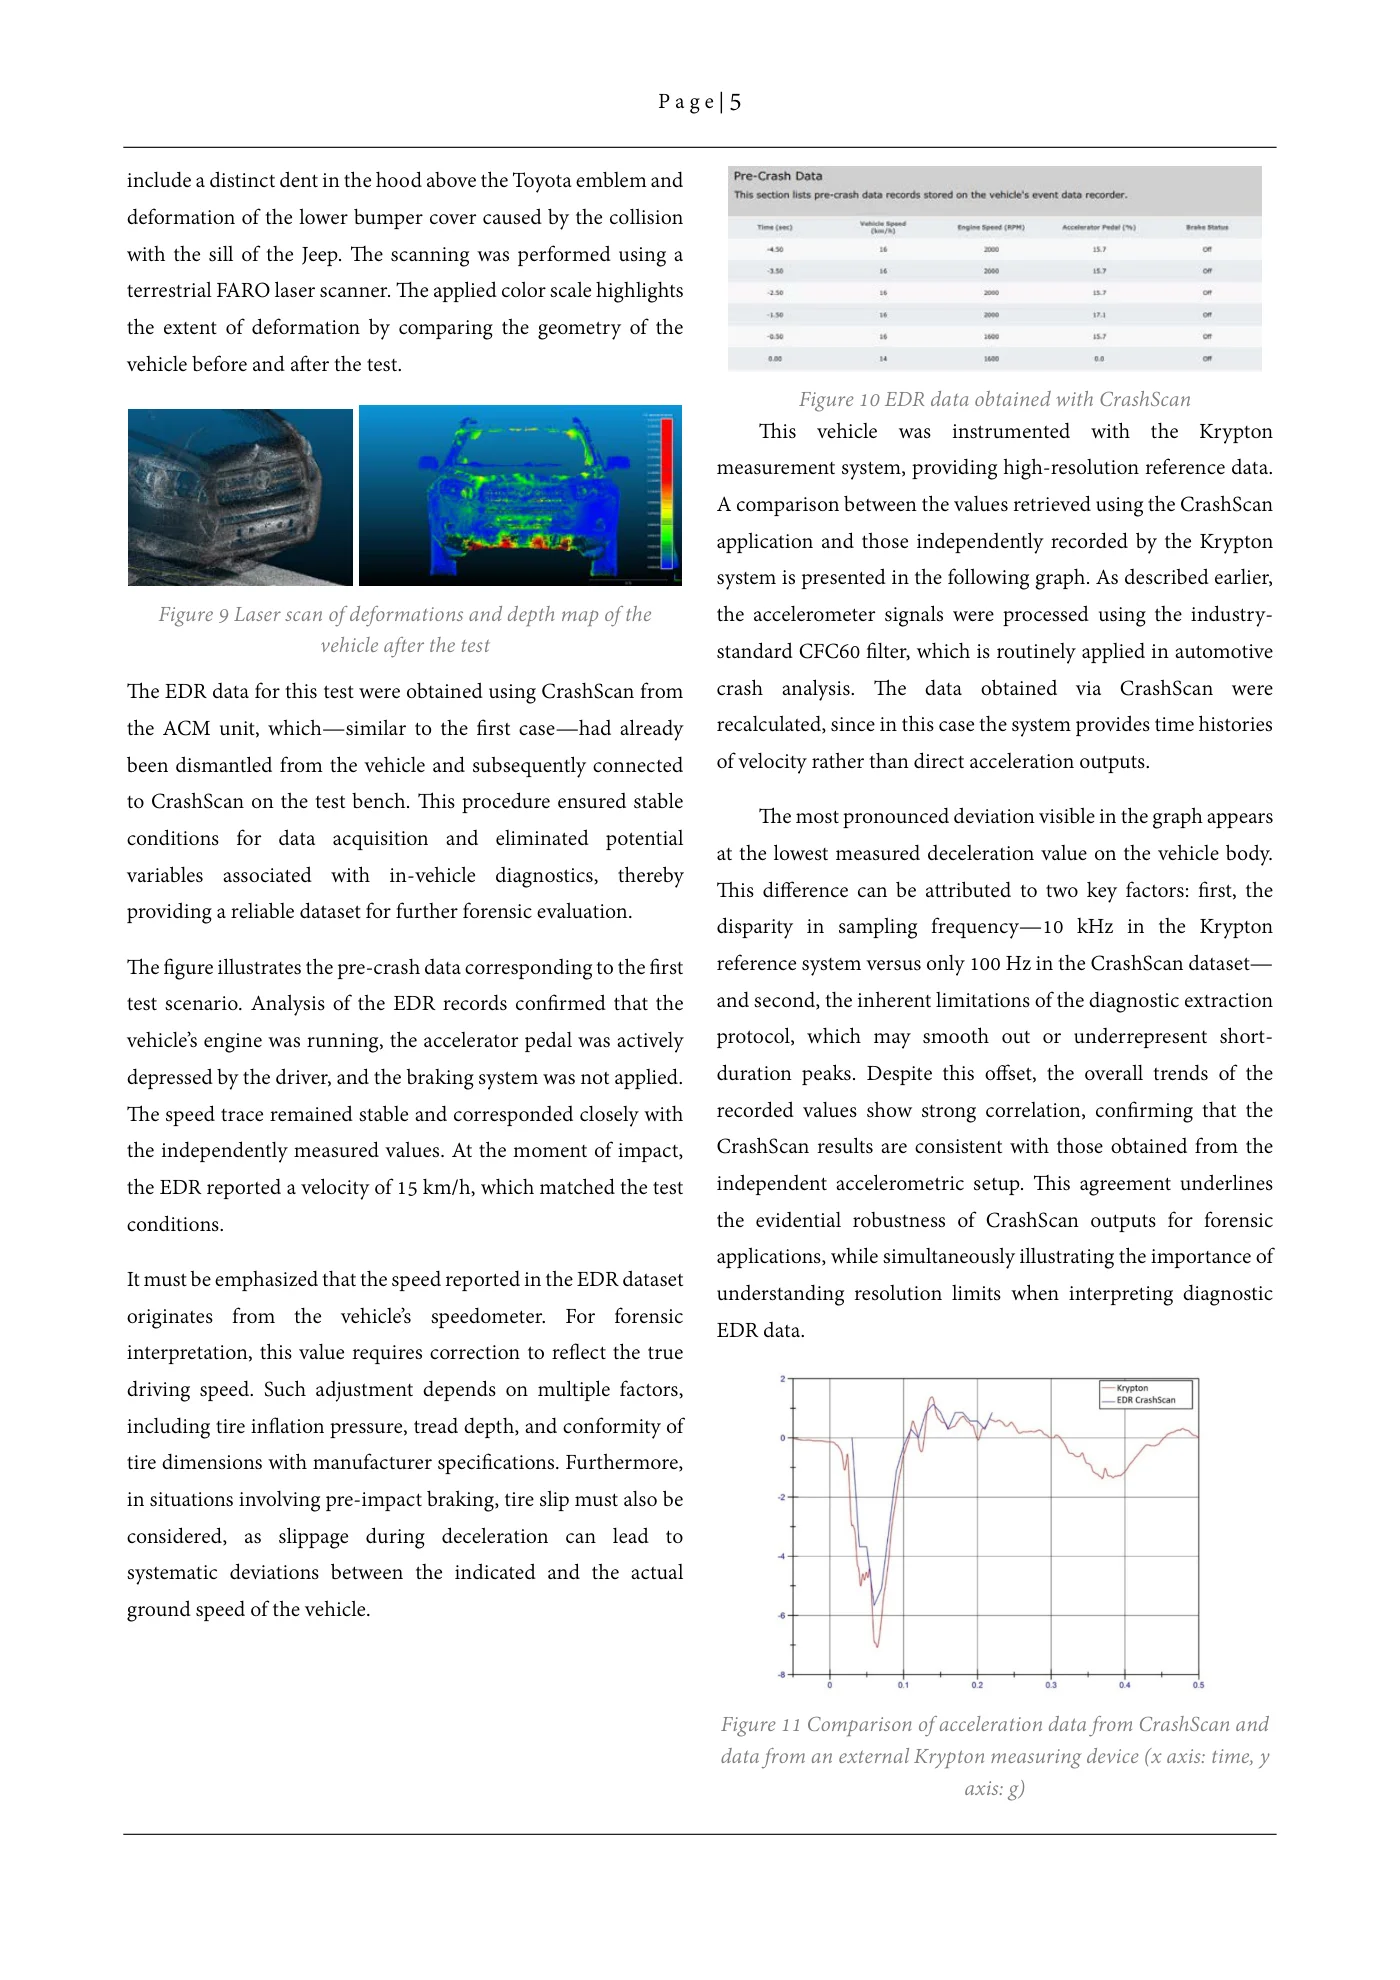
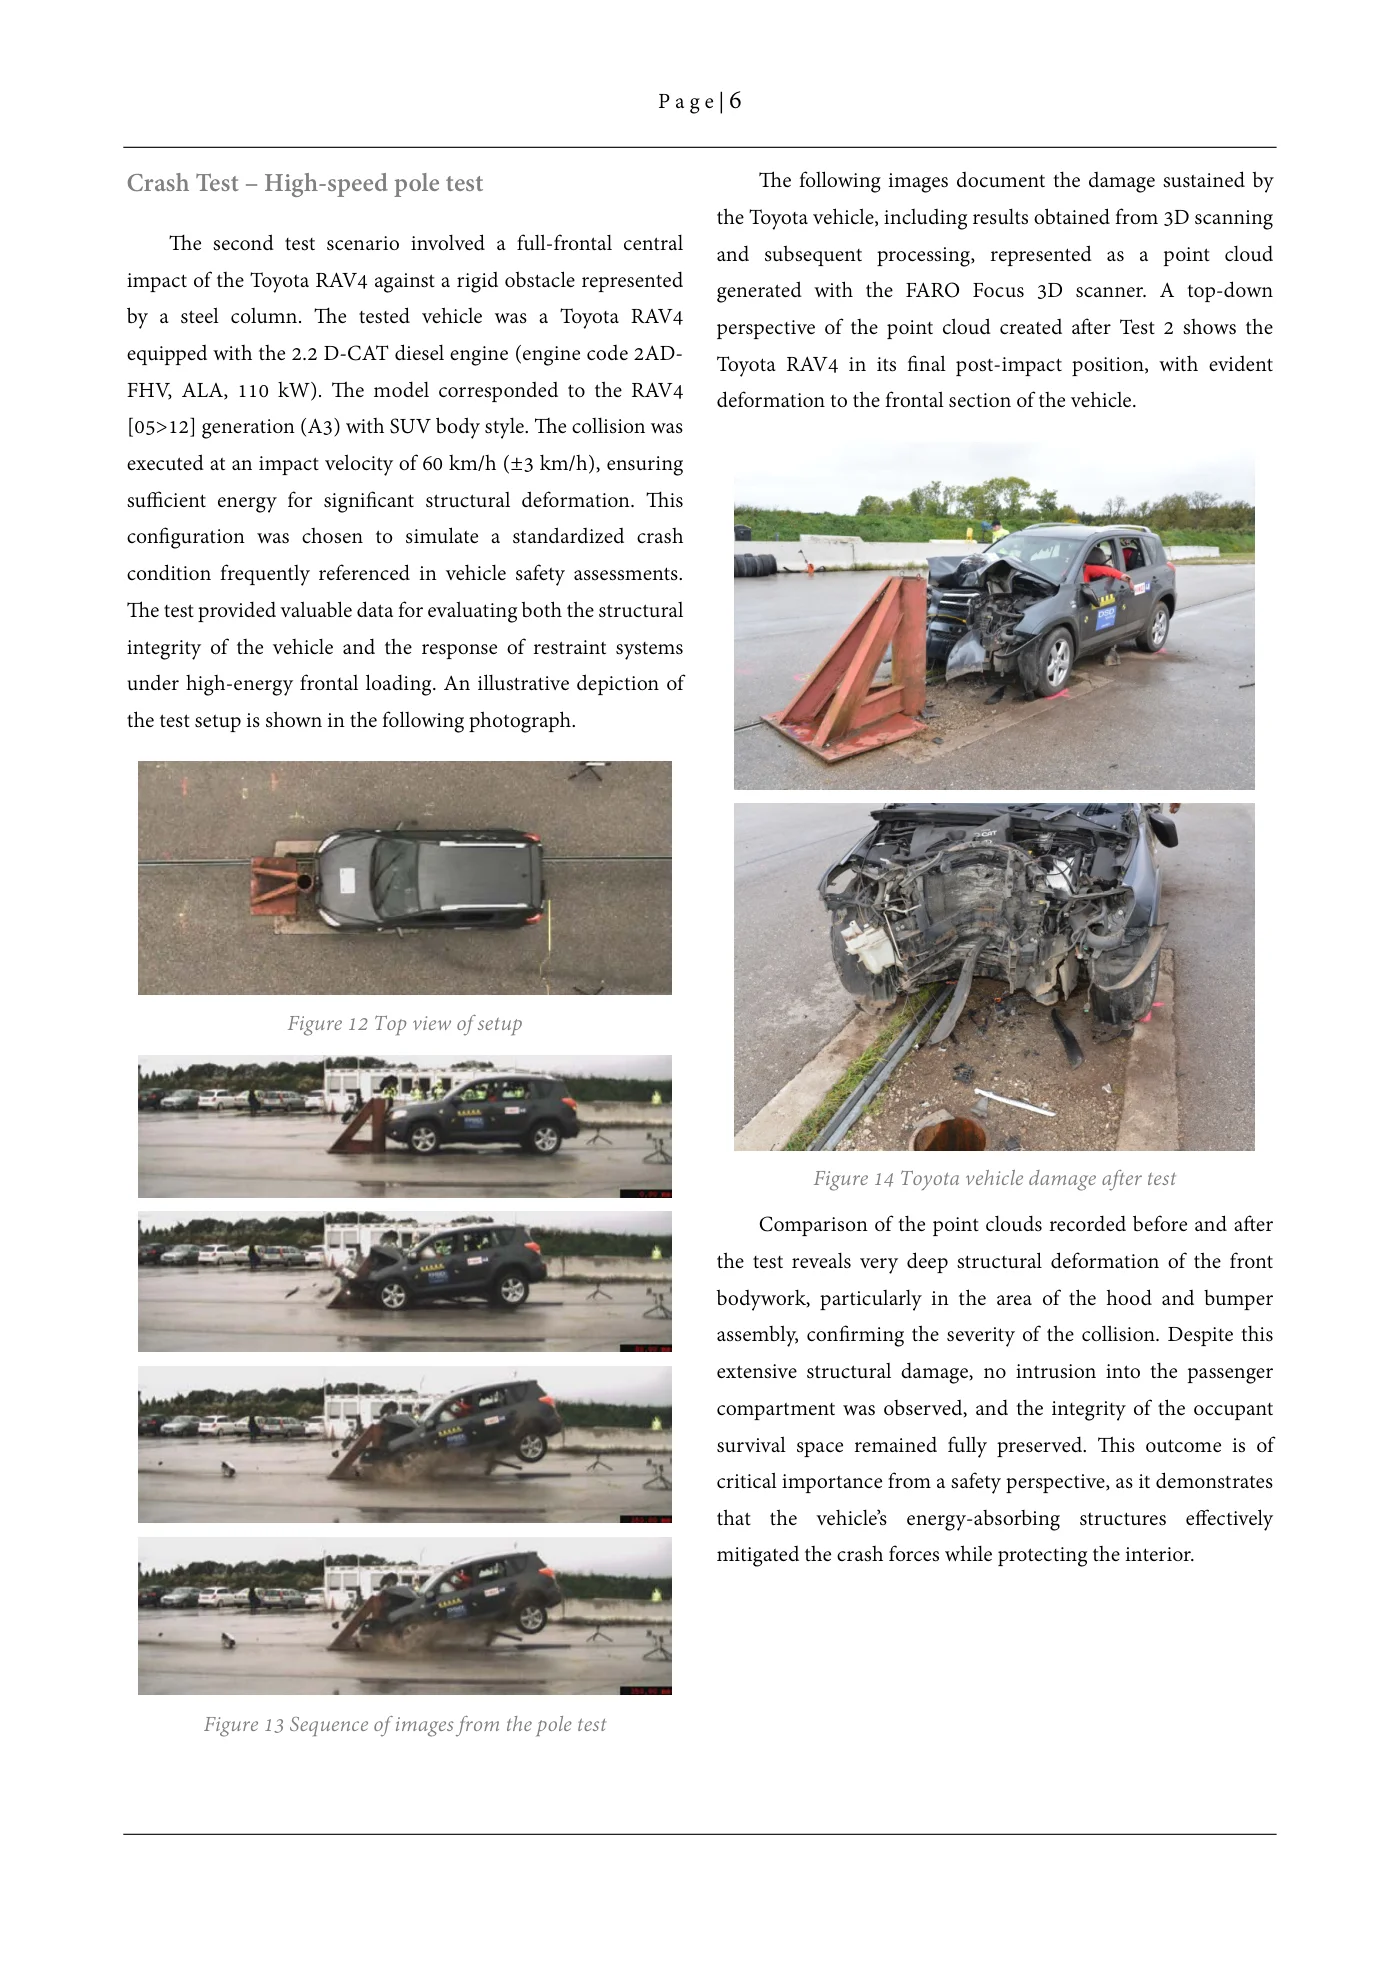
P a g e | 5 include a distinct dent in the hood above the Toyota emblem and deformation of the lower bumper cover caused by the collision with the sill of the Jeep. The scanning was performed using a terrestrial FARO laser scanner. The applied color scale highlights the extent of deformation by comparing the geometry of the vehicle before and after the test. Figure 10 EDR data obtained with CrashScan This vehicle was instrumented with the Krypton measurement system, providing high-resolution reference data. A comparison between the values retrieved using the CrashScan application and those independently recorded by the Krypton system is presented in the following graph. As described earlier, Figure 9 Laser scan of deformations and depth map of the the accelerometer signals were processed using the industry- vehicle after the test standard CFC60 filter, which is routinely applied in automotive The EDR data for this test were obtained using CrashScan from crash analysis. The data obtained via CrashScan were the ACM unit, which—similar to the first case—had already recalculated, since in this case the system provides time histories been dismantled from the vehicle and subsequently connected of velocity rather than direct acceleration outputs. to CrashScan on the test bench. This procedure ensured stable The most pronounced deviation visible in the graph appears conditions for data acquisition and eliminated potential at the lowest measured deceleration value on the vehicle body. variables associated with in-vehicle diagnostics, thereby This difference can be attributed to two key factors: first, the providing a reliable dataset for further forensic evaluation. disparity in sampling frequency—10 kHz in the Krypton The figure illustrates the pre-crash data corresponding to the first reference system versus only 100 Hz in the CrashScan dataset— test scenario. Analysis of the EDR records confirmed that the and second, the inherent limitations of the diagnostic extraction vehicle’s engine was running, the accelerator pedal was actively protocol, which may smooth out or underrepresent short- depressed by the driver, and the braking system was not applied. duration peaks. Despite this offset, the overall trends of the The speed trace remained stable and corresponded closely with recorded values show strong correlation, confirming that the the independently measured values. At the moment of impact, CrashScan results are consistent with those obtained from the the EDR reported a velocity of 15 km/h, which matched the test independent accelerometric setup. This agreement underlines conditions. the evidential robustness of CrashScan outputs for forensic applications, while simultaneously illustrating the importance of It must be emphasized that the speed reported in the EDR dataset understanding resolution limits when interpreting diagnostic originates from the vehicle’s speedometer. For forensic EDR data. interpretation, this value requires correction to reflect the true driving speed. Such adjustment depends on multiple factors, including tire inflation pressure, tread depth, and conformity of tire dimensions with manufacturer specifications. Furthermore, in situations involving pre-impact braking, tire slip must also be considered, as slippage during deceleration can lead to systematic deviations between the indicated and the actual ground speed of the vehicle. Figure 11 Comparison of acceleration data from CrashScan and data from an external Krypton measuring device (x axis: time, y axis: g)
Source page 6
Read page 6 extracted text
Extracted text may not preserve table columns. Refer to the page image or original PDF for data relationships.
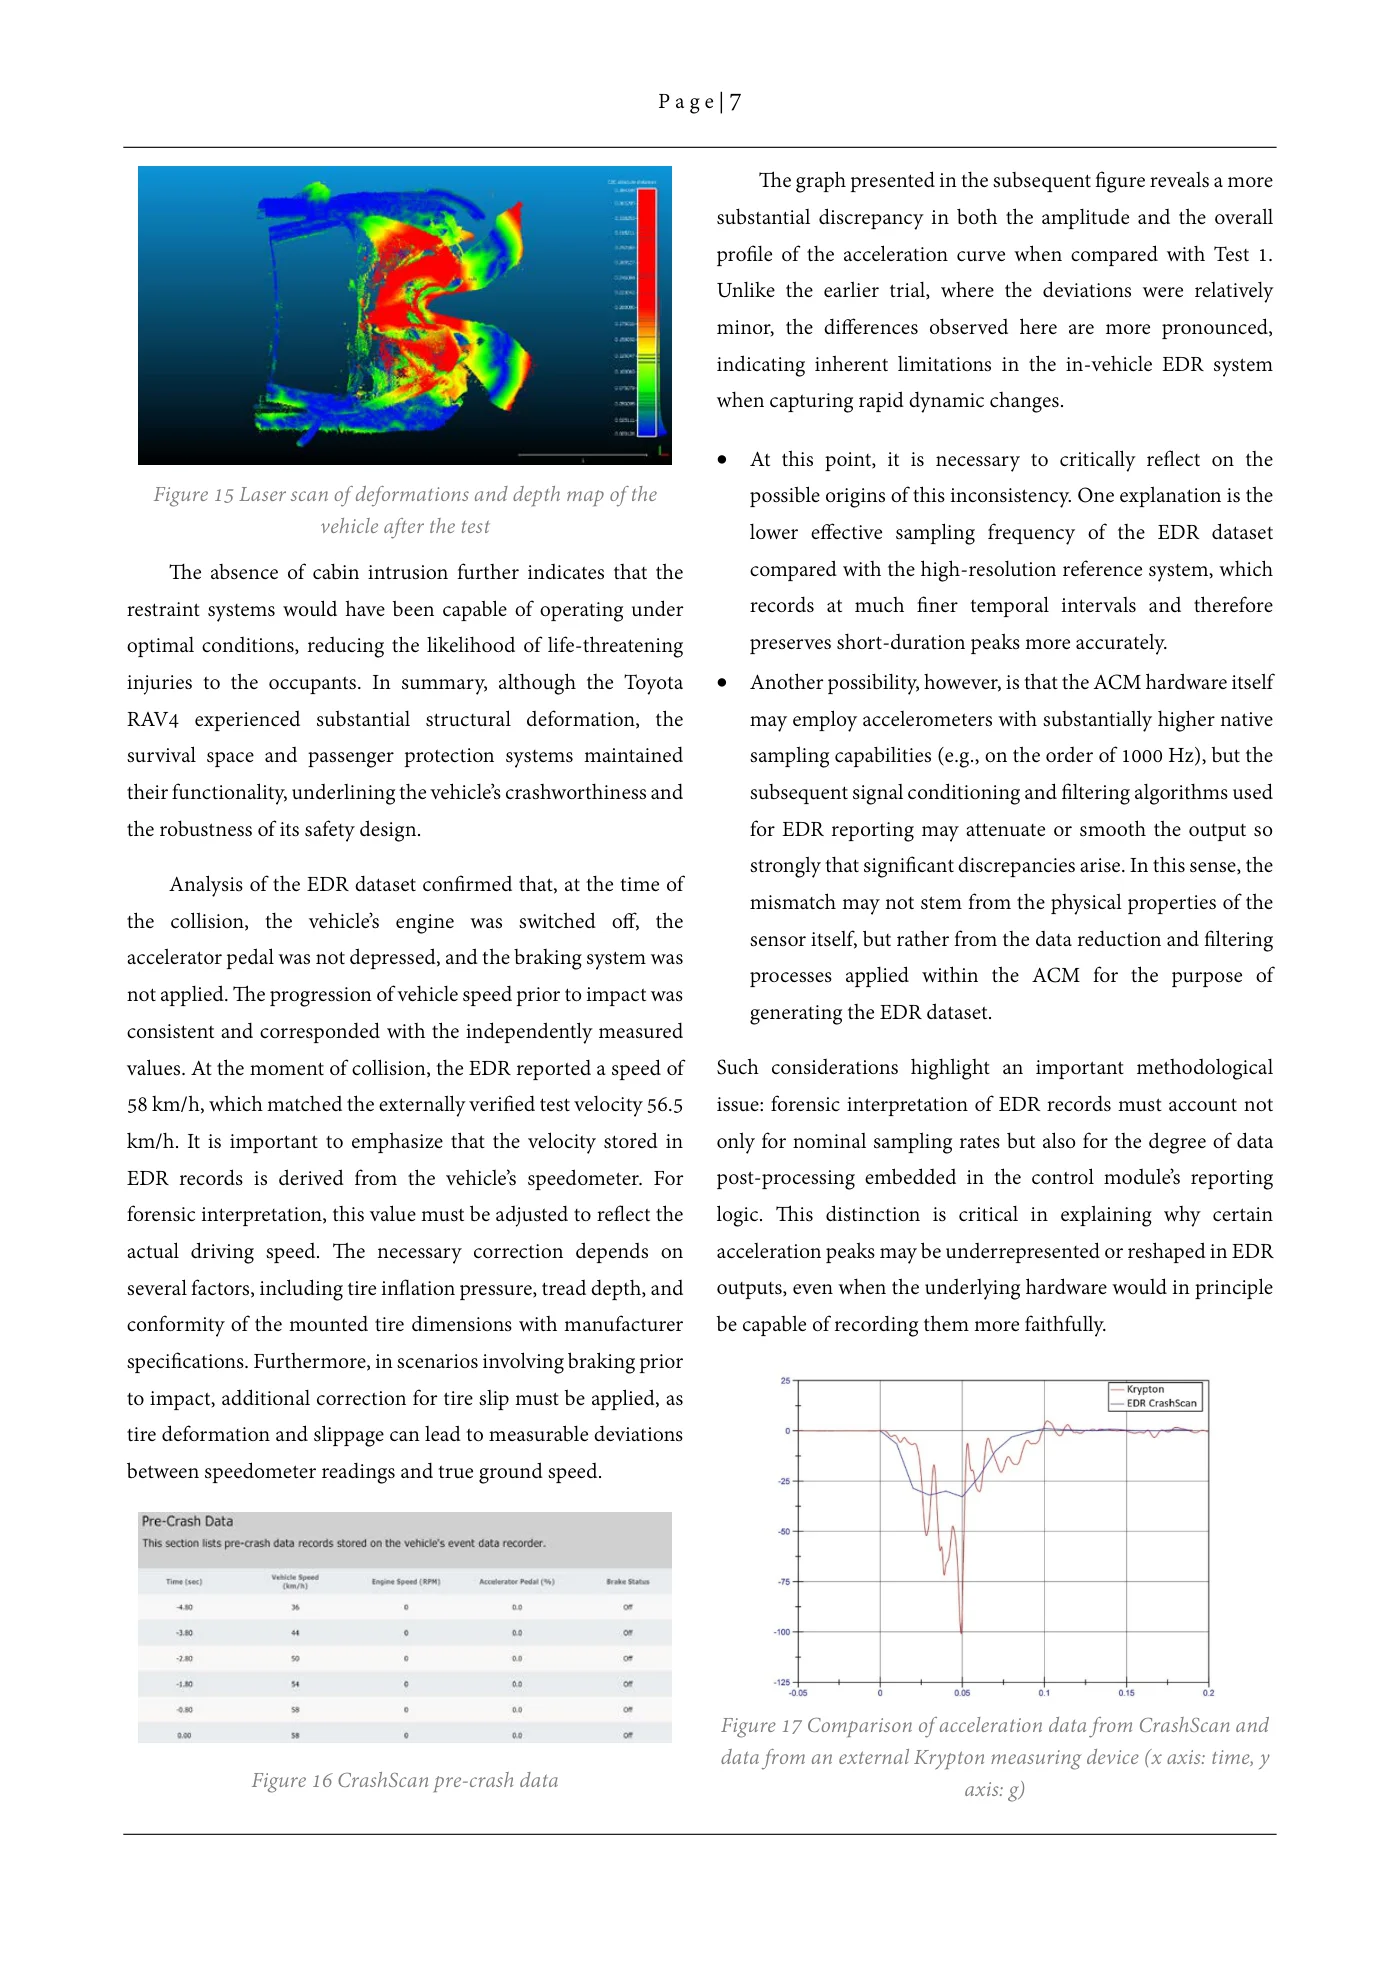
P a g e | 6 Crash Test – High-speed pole test The following images document the damage sustained by the Toyota vehicle, including results obtained from 3D scanning The second test scenario involved a full-frontal central and subsequent processing, represented as a point cloud impact of the Toyota RAV4 against a rigid obstacle represented generated with the FARO Focus 3D scanner. A top-down by a steel column. The tested vehicle was a Toyota RAV4 perspective of the point cloud created after Test 2 shows the equipped with the 2.2 D-CAT diesel engine (engine code 2AD- Toyota RAV4 in its final post-impact position, with evident FHV, ALA, 110 kW). The model corresponded to the RAV4 deformation to the frontal section of the vehicle. [05>12] generation (A3) with SUV body style. The collision was executed at an impact velocity of 60 km/h (±3 km/h), ensuring sufficient energy for significant structural deformation. This configuration was chosen to simulate a standardized crash condition frequently referenced in vehicle safety assessments. The test provided valuable data for evaluating both the structural integrity of the vehicle and the response of restraint systems under high-energy frontal loading. An illustrative depiction of the test setup is shown in the following photograph. Figure 12 Top view of setup Figure 14 Toyota vehicle damage after test Comparison of the point clouds recorded before and after the test reveals very deep structural deformation of the front bodywork, particularly in the area of the hood and bumper assembly, confirming the severity of the collision. Despite this extensive structural damage, no intrusion into the passenger compartment was observed, and the integrity of the occupant survival space remained fully preserved. This outcome is of critical importance from a safety perspective, as it demonstrates that the vehicle’s energy-absorbing structures effectively mitigated the crash forces while protecting the interior. Figure 13 Sequence of images from the pole test
Source page 7
Read page 7 extracted text
Extracted text may not preserve table columns. Refer to the page image or original PDF for data relationships.
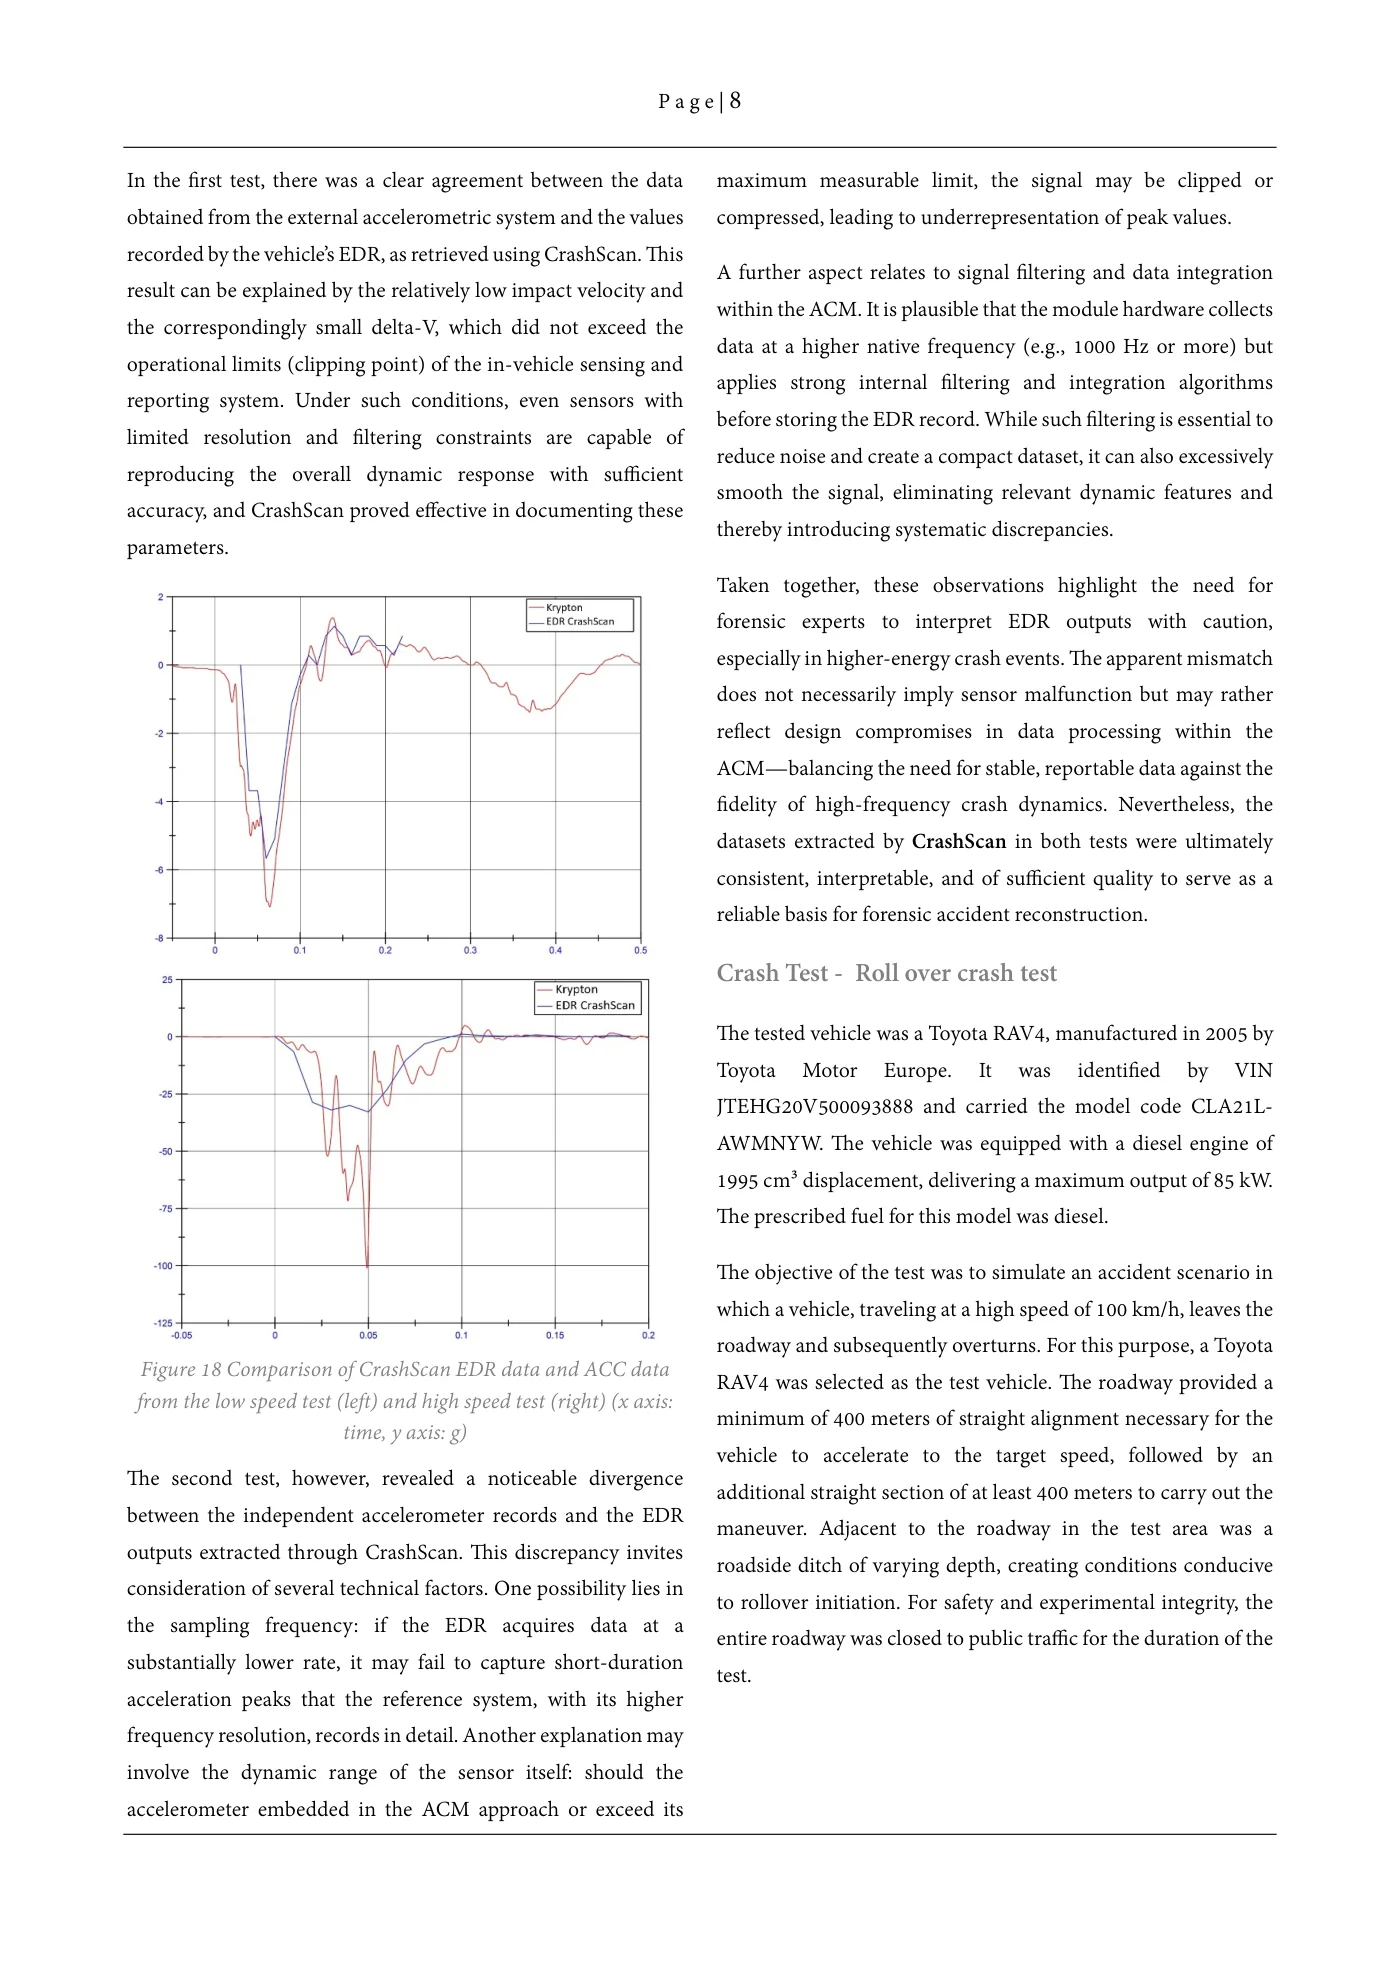
P a g e | 7 The graph presented in the subsequent figure reveals a more substantial discrepancy in both the amplitude and the overall profile of the acceleration curve when compared with Test 1. Unlike the earlier trial, where the deviations were relatively minor, the differences observed here are more pronounced, indicating inherent limitations in the in-vehicle EDR system when capturing rapid dynamic changes. • At this point, it is necessary to critically reflect on the Figure 15 Laser scan of deformations and depth map of the possible origins of this inconsistency. One explanation is the vehicle after the test lower effective sampling frequency of the EDR dataset The absence of cabin intrusion further indicates that the compared with the high-resolution reference system, which restraint systems would have been capable of operating under records at much finer temporal intervals and therefore optimal conditions, reducing the likelihood of life-threatening preserves short-duration peaks more accurately. injuries to the occupants. In summary, although the Toyota • Another possibility, however, is that the ACM hardware itself RAV4 experienced substantial structural deformation, the may employ accelerometers with substantially higher native survival space and passenger protection systems maintained sampling capabilities (e.g., on the order of 1000 Hz), but the their functionality, underlining the vehicle’s crashworthiness and subsequent signal conditioning and filtering algorithms used the robustness of its safety design. for EDR reporting may attenuate or smooth the output so strongly that significant discrepancies arise. In this sense, the Analysis of the EDR dataset confirmed that, at the time of mismatch may not stem from the physical properties of the the collision, the vehicle’s engine was switched off, the sensor itself, but rather from the data reduction and filtering accelerator pedal was not depressed, and the braking system was processes applied within the ACM for the purpose of not applied. The progression of vehicle speed prior to impact was generating the EDR dataset. consistent and corresponded with the independently measured values. At the moment of collision, the EDR reported a speed of Such considerations highlight an important methodological 58 km/h, which matched the externally verified test velocity 56.5 issue: forensic interpretation of EDR records must account not km/h. It is important to emphasize that the velocity stored in only for nominal sampling rates but also for the degree of data EDR records is derived from the vehicle’s speedometer. For post-processing embedded in the control module’s reporting forensic interpretation, this value must be adjusted to reflect the logic. This distinction is critical in explaining why certain actual driving speed. The necessary correction depends on acceleration peaks may be underrepresented or reshaped in EDR several factors, including tire inflation pressure, tread depth, and outputs, even when the underlying hardware would in principle conformity of the mounted tire dimensions with manufacturer be capable of recording them more faithfully. specifications. Furthermore, in scenarios involving braking prior to impact, additional correction for tire slip must be applied, as tire deformation and slippage can lead to measurable deviations between speedometer readings and true ground speed. Figure 17 Comparison of acceleration data from CrashScan and data from an external Krypton measuring device (x axis: time, y Figure 16 CrashScan pre-crash data axis: g)
Source page 8
Read page 8 extracted text
Extracted text may not preserve table columns. Refer to the page image or original PDF for data relationships.
P a g e | 8 In the first test, there was a clear agreement between the data maximum measurable limit, the signal may be clipped or obtained from the external accelerometric system and the values compressed, leading to underrepresentation of peak values. recorded by the vehicle’s EDR, as retrieved using CrashScan. This A further aspect relates to signal filtering and data integration result can be explained by the relatively low impact velocity and within the ACM. It is plausible that the module hardware collects the correspondingly small delta-V, which did not exceed the data at a higher native frequency (e.g., 1000 Hz or more) but operational limits (clipping point) of the in-vehicle sensing and applies strong internal filtering and integration algorithms reporting system. Under such conditions, even sensors with before storing the EDR record. While such filtering is essential to limited resolution and filtering constraints are capable of reduce noise and create a compact dataset, it can also excessively reproducing the overall dynamic response with sufficient smooth the signal, eliminating relevant dynamic features and accuracy, and CrashScan proved effective in documenting these thereby introducing systematic discrepancies. parameters. Taken together, these observations highlight the need for forensic experts to interpret EDR outputs with caution, especially in higher-energy crash events. The apparent mismatch does not necessarily imply sensor malfunction but may rather reflect design compromises in data processing within the ACM—balancing the need for stable, reportable data against the fidelity of high-frequency crash dynamics. Nevertheless, the datasets extracted by CrashScan in both tests were ultimately consistent, interpretable, and of sufficient quality to serve as a reliable basis for forensic accident reconstruction. Crash Test - Roll over crash test The tested vehicle was a Toyota RAV4, manufactured in 2005 by Toyota Motor Europe. It was identified by VIN JTEHG20V500093888 and carried the model code CLA21L- AWMNYW. The vehicle was equipped with a diesel engine of 1995 cm³ displacement, delivering a maximum output of 85 kW. The prescribed fuel for this model was diesel. The objective of the test was to simulate an accident scenario in which a vehicle, traveling at a high speed of 100 km/h, leaves the roadway and subsequently overturns. For this purpose, a Toyota Figure 18 Comparison of CrashScan EDR data and ACC data RAV4 was selected as the test vehicle. The roadway provided a from the low speed test (left) and high speed test (right) (x axis: minimum of 400 meters of straight alignment necessary for the time, y axis: g) vehicle to accelerate to the target speed, followed by an The second test, however, revealed a noticeable divergence additional straight section of at least 400 meters to carry out the between the independent accelerometer records and the EDR maneuver. Adjacent to the roadway in the test area was a outputs extracted through CrashScan. This discrepancy invites roadside ditch of varying depth, creating conditions conducive consideration of several technical factors. One possibility lies in to rollover initiation. For safety and experimental integrity, the the sampling frequency: if the EDR acquires data at a entire roadway was closed to public traffic for the duration of the substantially lower rate, it may fail to capture short-duration test. acceleration peaks that the reference system, with its higher frequency resolution, records in detail. Another explanation may involve the dynamic range of the sensor itself: should the accelerometer embedded in the ACM approach or exceed its
Source page 9
Read page 9 extracted text
Extracted text may not preserve table columns. Refer to the page image or original PDF for data relationships.
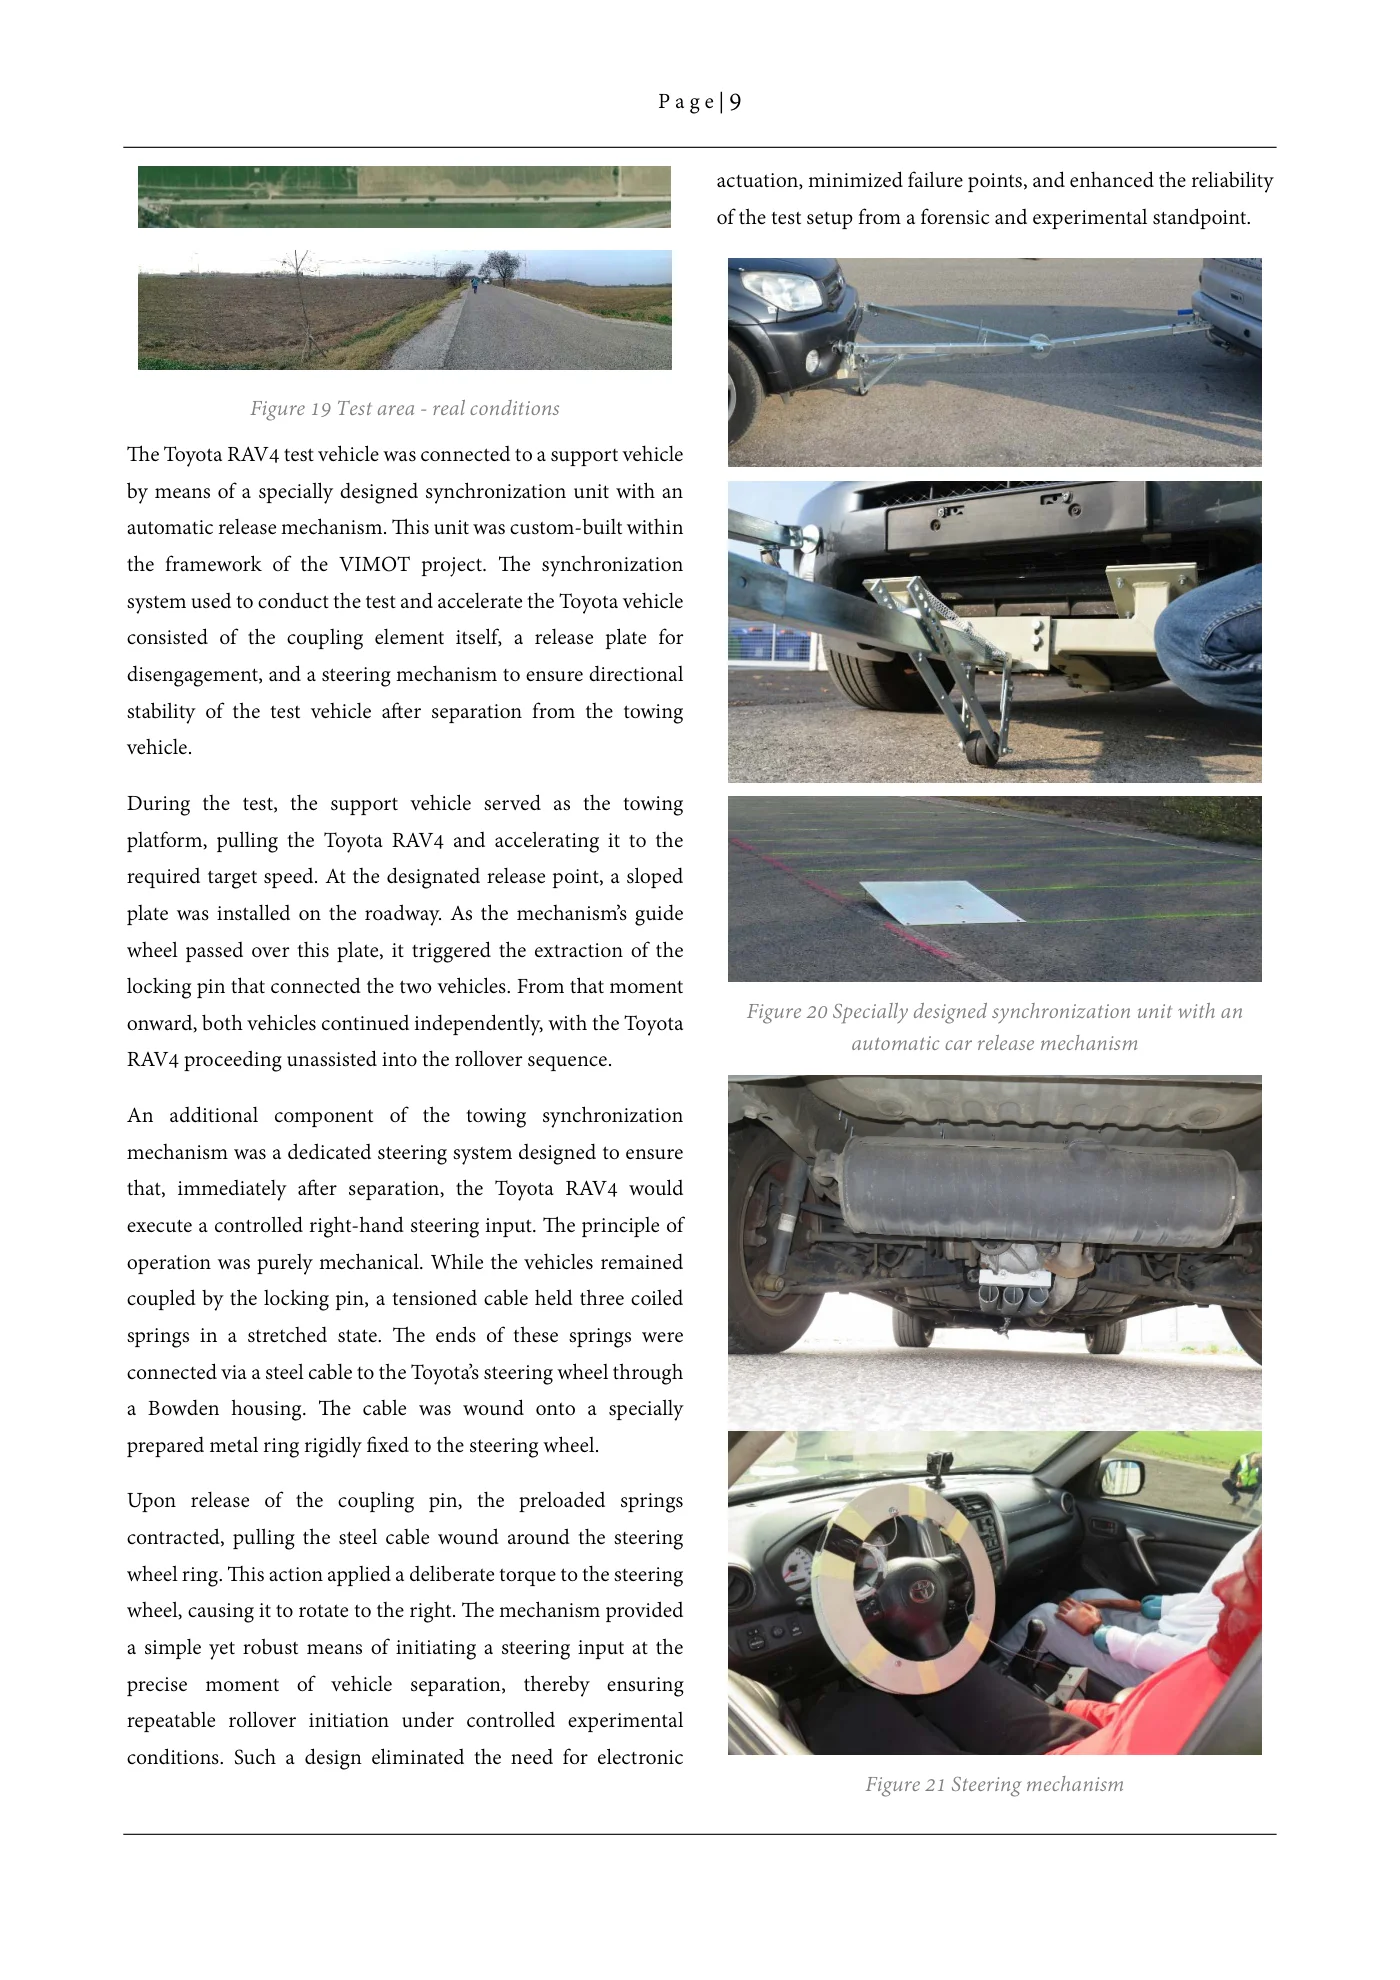
P a g e | 9 actuation, minimized failure points, and enhanced the reliability of the test setup from a forensic and experimental standpoint. Figure 19 Test area - real conditions The Toyota RAV4 test vehicle was connected to a support vehicle by means of a specially designed synchronization unit with an automatic release mechanism. This unit was custom-built within the framework of the VIMOT project. The synchronization system used to conduct the test and accelerate the Toyota vehicle consisted of the coupling element itself, a release plate for disengagement, and a steering mechanism to ensure directional stability of the test vehicle after separation from the towing vehicle. During the test, the support vehicle served as the towing platform, pulling the Toyota RAV4 and accelerating it to the required target speed. At the designated release point, a sloped plate was installed on the roadway. As the mechanism’s guide wheel passed over this plate, it triggered the extraction of the locking pin that connected the two vehicles. From that moment Figure 20 Specially designed synchronization unit with anonward, both vehicles continued independently, with the Toyota automatic car release mechanism RAV4 proceeding unassisted into the rollover sequence. An additional component of the towing synchronization mechanism was a dedicated steering system designed to ensure that, immediately after separation, the Toyota RAV4 would execute a controlled right-hand steering input. The principle of operation was purely mechanical. While the vehicles remained coupled by the locking pin, a tensioned cable held three coiled springs in a stretched state. The ends of these springs were connected via a steel cable to the Toyota’s steering wheel through a Bowden housing. The cable was wound onto a specially prepared metal ring rigidly fixed to the steering wheel. Upon release of the coupling pin, the preloaded springs contracted, pulling the steel cable wound around the steering wheel ring. This action applied a deliberate torque to the steering wheel, causing it to rotate to the right. The mechanism provided a simple yet robust means of initiating a steering input at the precise moment of vehicle separation, thereby ensuring repeatable rollover initiation under controlled experimental conditions. Such a design eliminated the need for electronic Figure 21 Steering mechanism
Source page 10
Read page 10 extracted text
Extracted text may not preserve table columns. Refer to the page image or original PDF for data relationships.
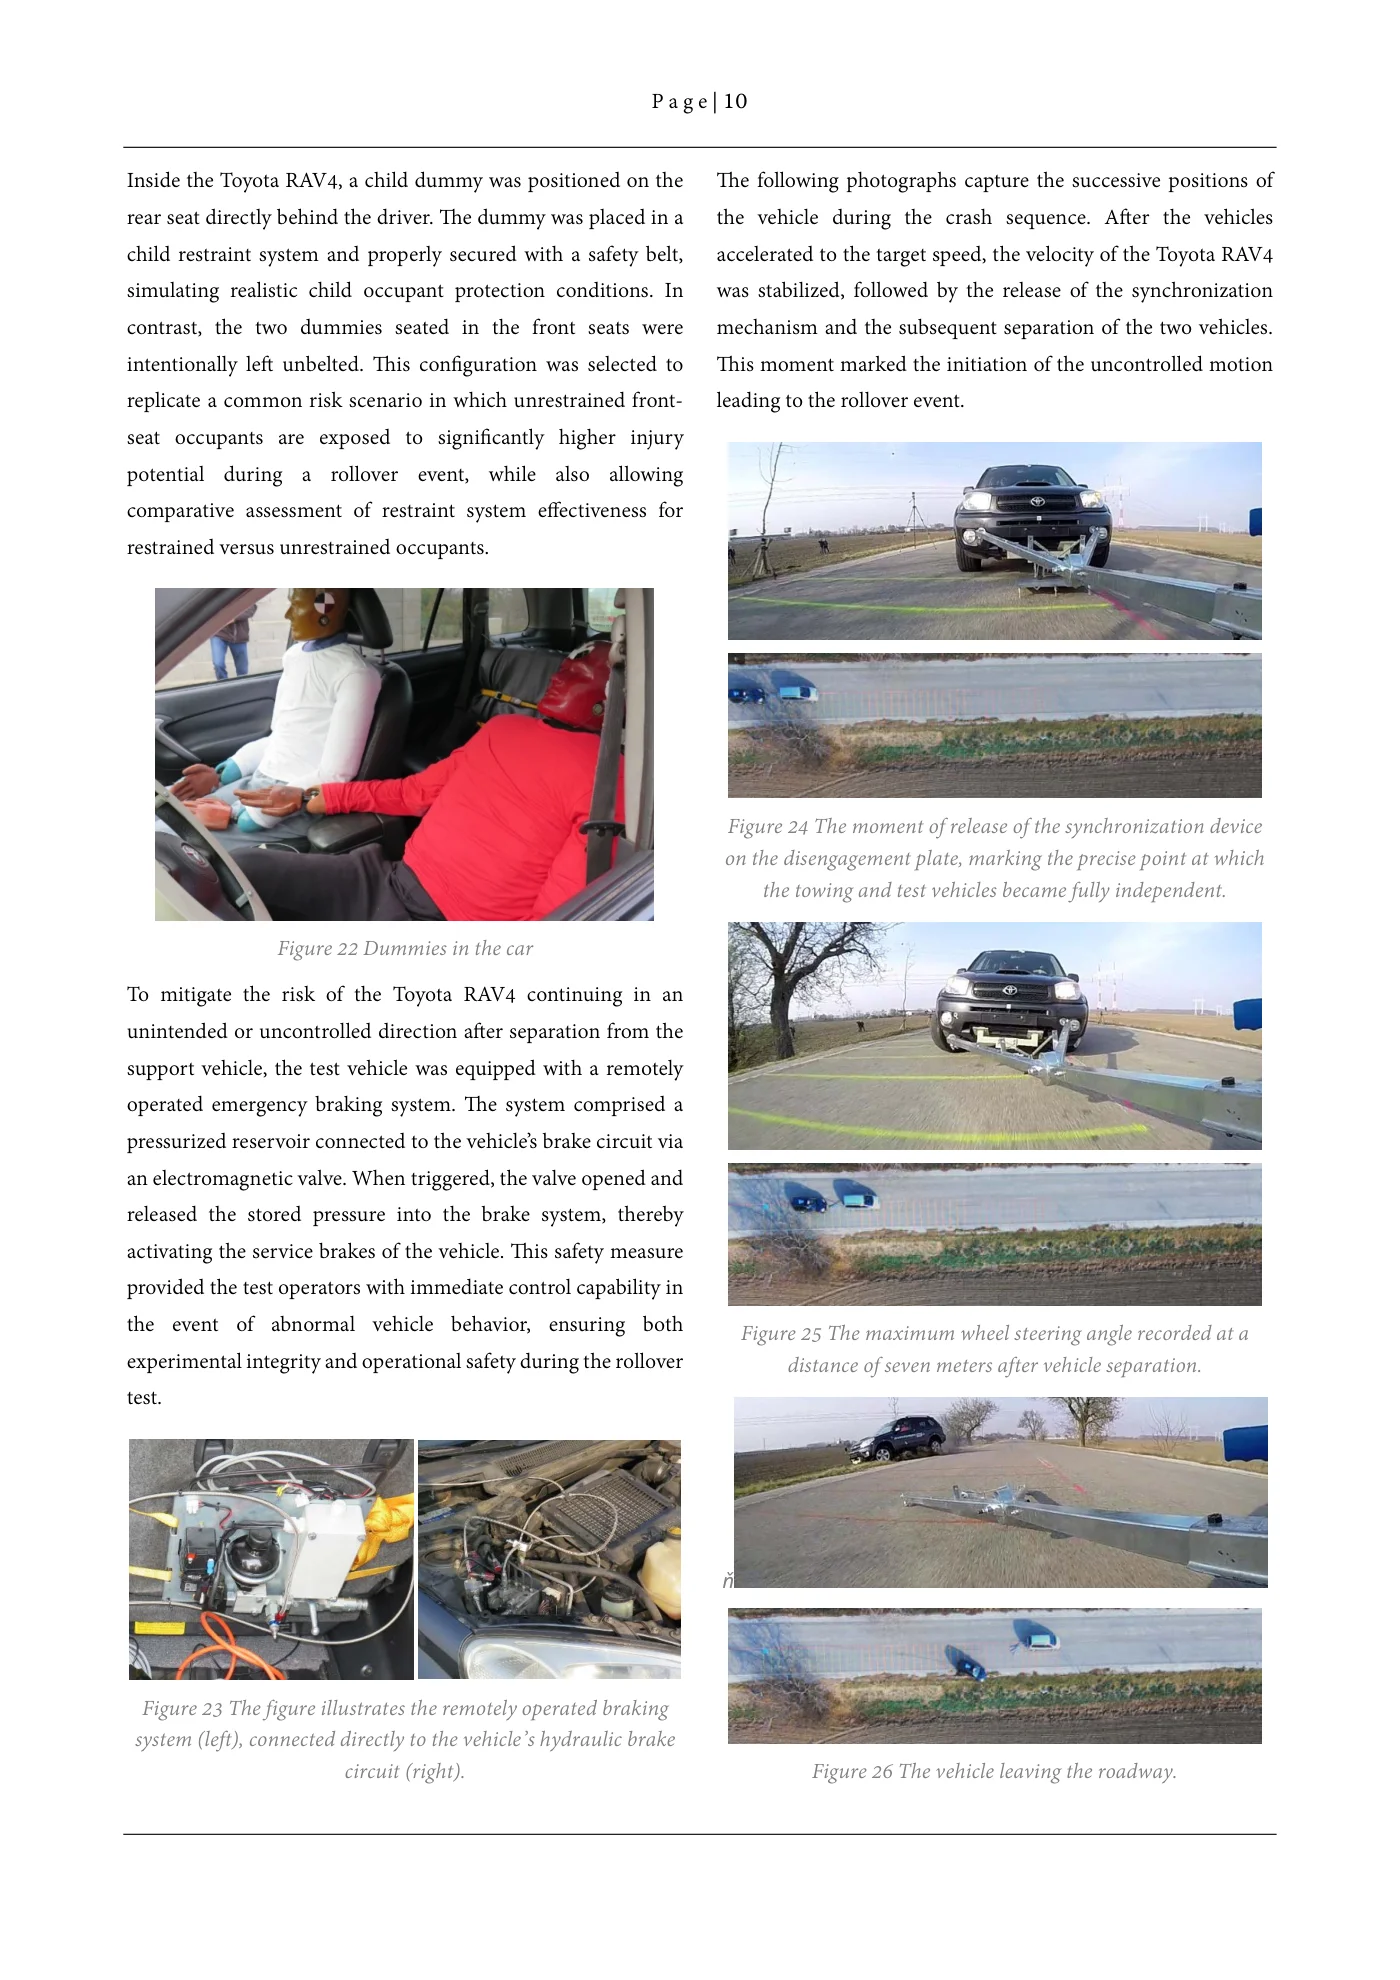
P a g e | 10 Inside the Toyota RAV4, a child dummy was positioned on the The following photographs capture the successive positions of rear seat directly behind the driver. The dummy was placed in a the vehicle during the crash sequence. After the vehicles child restraint system and properly secured with a safety belt, accelerated to the target speed, the velocity of the Toyota RAV4 simulating realistic child occupant protection conditions. In was stabilized, followed by the release of the synchronization contrast, the two dummies seated in the front seats were mechanism and the subsequent separation of the two vehicles. intentionally left unbelted. This configuration was selected to This moment marked the initiation of the uncontrolled motion replicate a common risk scenario in which unrestrained front- leading to the rollover event. seat occupants are exposed to significantly higher injury potential during a rollover event, while also allowing comparative assessment of restraint system effectiveness for restrained versus unrestrained occupants. Figure 24 The moment of release of the synchronization device on the disengagement plate, marking the precise point at which the towing and test vehicles became fully independent. Figure 22 Dummies in the car To mitigate the risk of the Toyota RAV4 continuing in an unintended or uncontrolled direction after separation from the support vehicle, the test vehicle was equipped with a remotely operated emergency braking system. The system comprised a pressurized reservoir connected to the vehicle’s brake circuit via an electromagnetic valve. When triggered, the valve opened and released the stored pressure into the brake system, thereby activating the service brakes of the vehicle. This safety measure provided the test operators with immediate control capability in the event of abnormal vehicle behavior, ensuring both Figure 25 The maximum wheel steering angle recorded at a experimental integrity and operational safety during the rollover distance of seven meters after vehicle separation. test. ň Figure 23 The figure illustrates the remotely operated braking system (left), connected directly to the vehicle’s hydraulic brake circuit (right). Figure 26 The vehicle leaving the roadway.
Source page 11
Read page 11 extracted text
Extracted text may not preserve table columns. Refer to the page image or original PDF for data relationships.
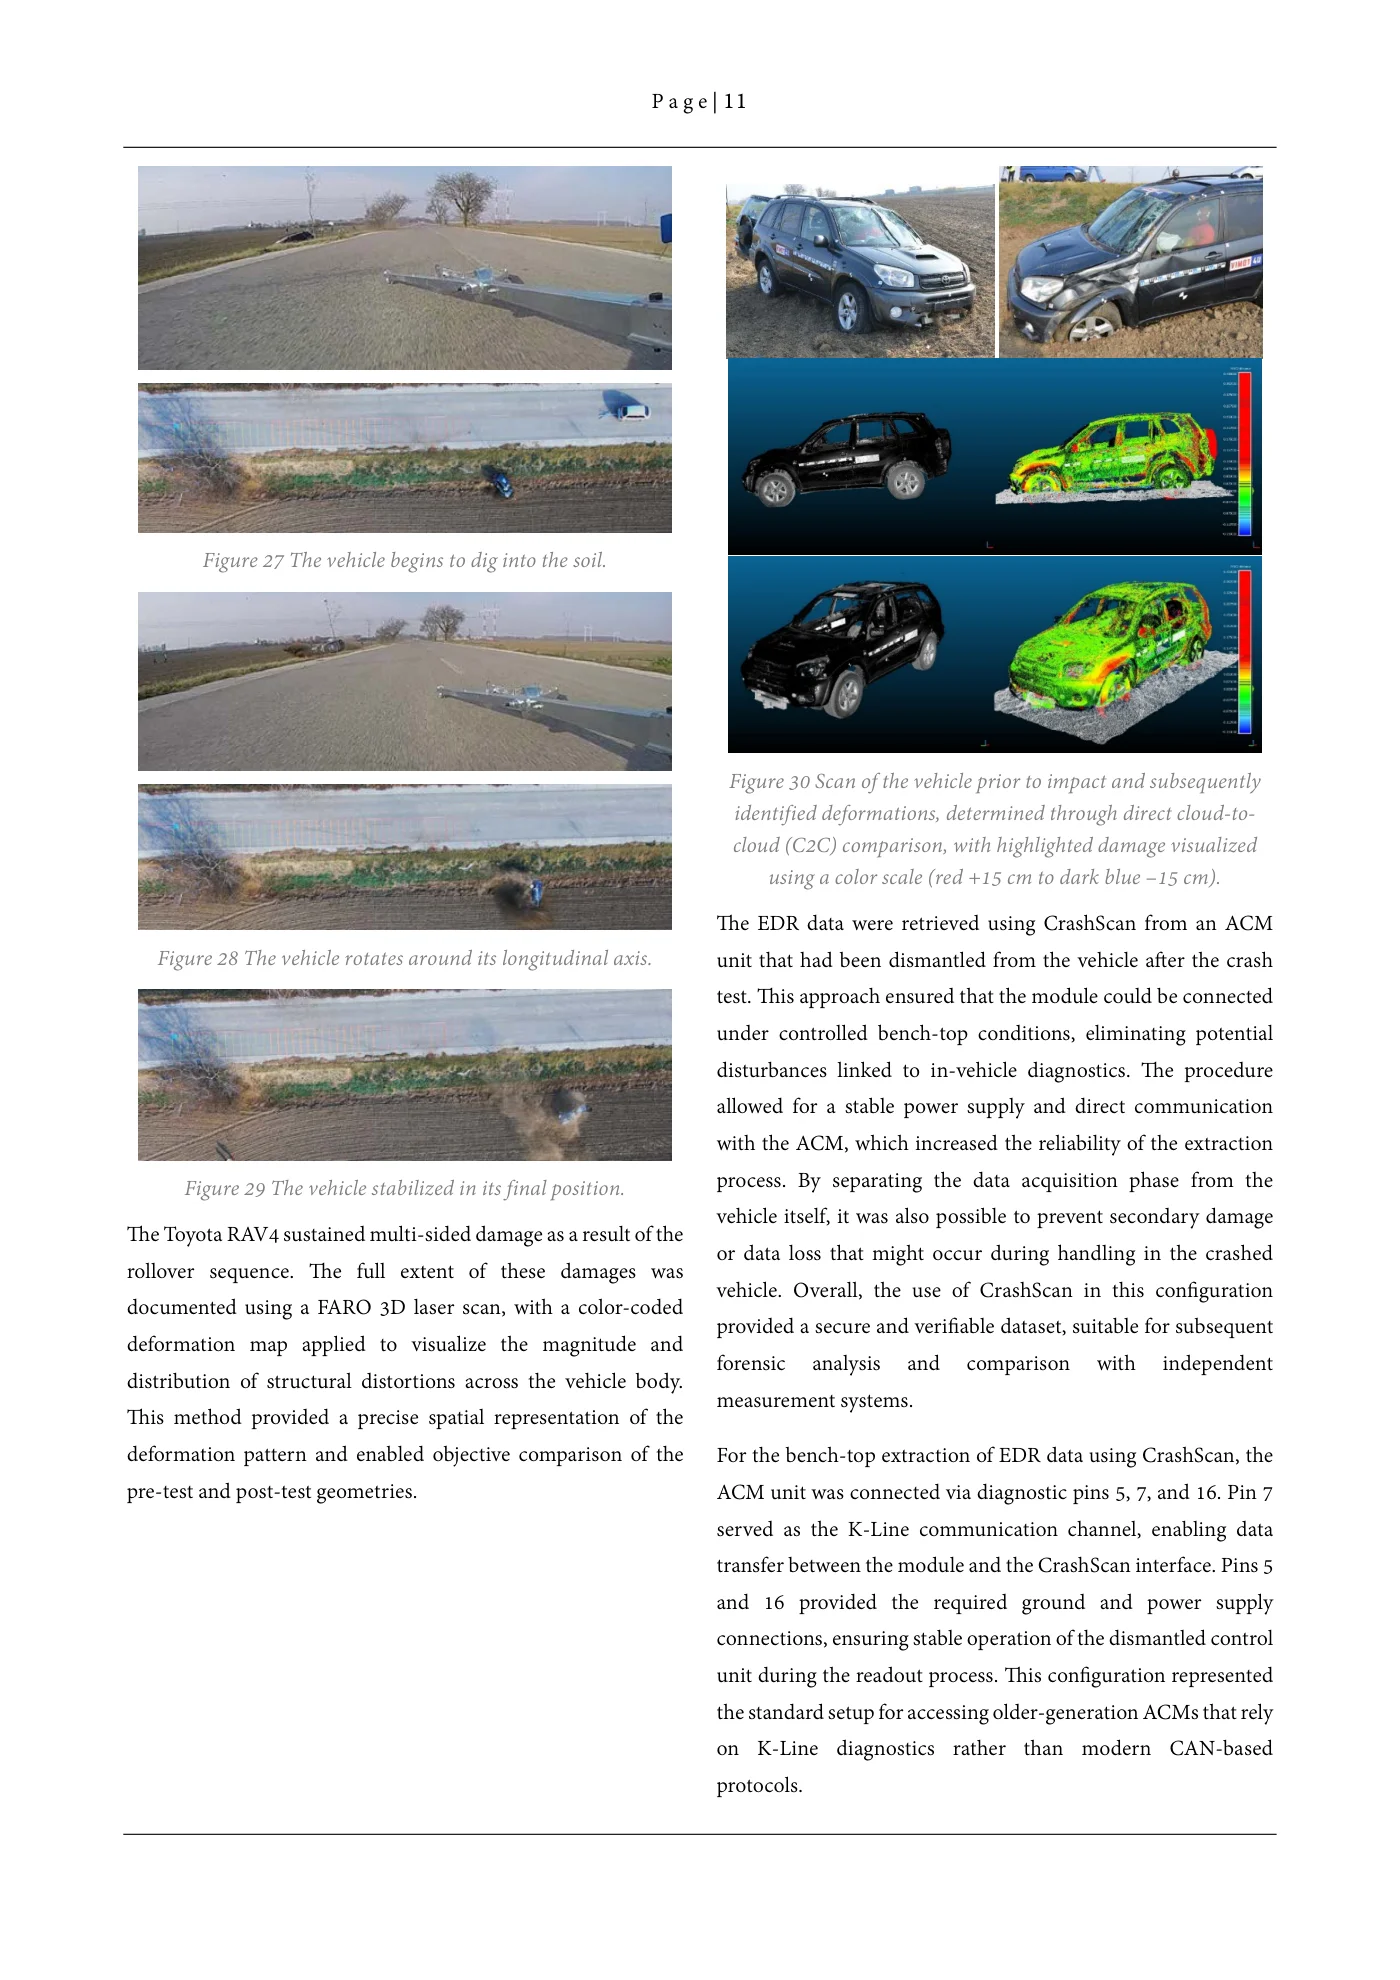
P a g e | 11 Figure 27 The vehicle begins to dig into the soil. Figure 30 Scan of the vehicle prior to impact and subsequently identified deformations, determined through direct cloud-to- cloud (C2C) comparison, with highlighted damage visualized using a color scale (red +15 cm to dark blue –15 cm). The EDR data were retrieved using CrashScan from an ACM Figure 28 The vehicle rotates around its longitudinal axis. unit that had been dismantled from the vehicle after the crash test. This approach ensured that the module could be connected under controlled bench-top conditions, eliminating potential disturbances linked to in-vehicle diagnostics. The procedure allowed for a stable power supply and direct communication with the ACM, which increased the reliability of the extraction process. By separating the data acquisition phase from the Figure 29 The vehicle stabilized in its final position. vehicle itself, it was also possible to prevent secondary damage The Toyota RAV4 sustained multi-sided damage as a result of the or data loss that might occur during handling in the crashed rollover sequence. The full extent of these damages was vehicle. Overall, the use of CrashScan in this configuration documented using a FARO 3D laser scan, with a color-coded provided a secure and verifiable dataset, suitable for subsequent deformation map applied to visualize the magnitude and forensic analysis and comparison with independent distribution of structural distortions across the vehicle body. measurement systems. This method provided a precise spatial representation of the deformation pattern and enabled objective comparison of the For the bench-top extraction of EDR data using CrashScan, the pre-test and post-test geometries. ACM unit was connected via diagnostic pins 5, 7, and 16. Pin 7 served as the K-Line communication channel, enabling data transfer between the module and the CrashScan interface. Pins 5 and 16 provided the required ground and power supply connections, ensuring stable operation of the dismantled control unit during the readout process. This configuration represented the standard setup for accessing older-generation ACMs that rely on K-Line diagnostics rather than modern CAN-based protocols.
Source page 12
Read page 12 extracted text
Extracted text may not preserve table columns. Refer to the page image or original PDF for data relationships.
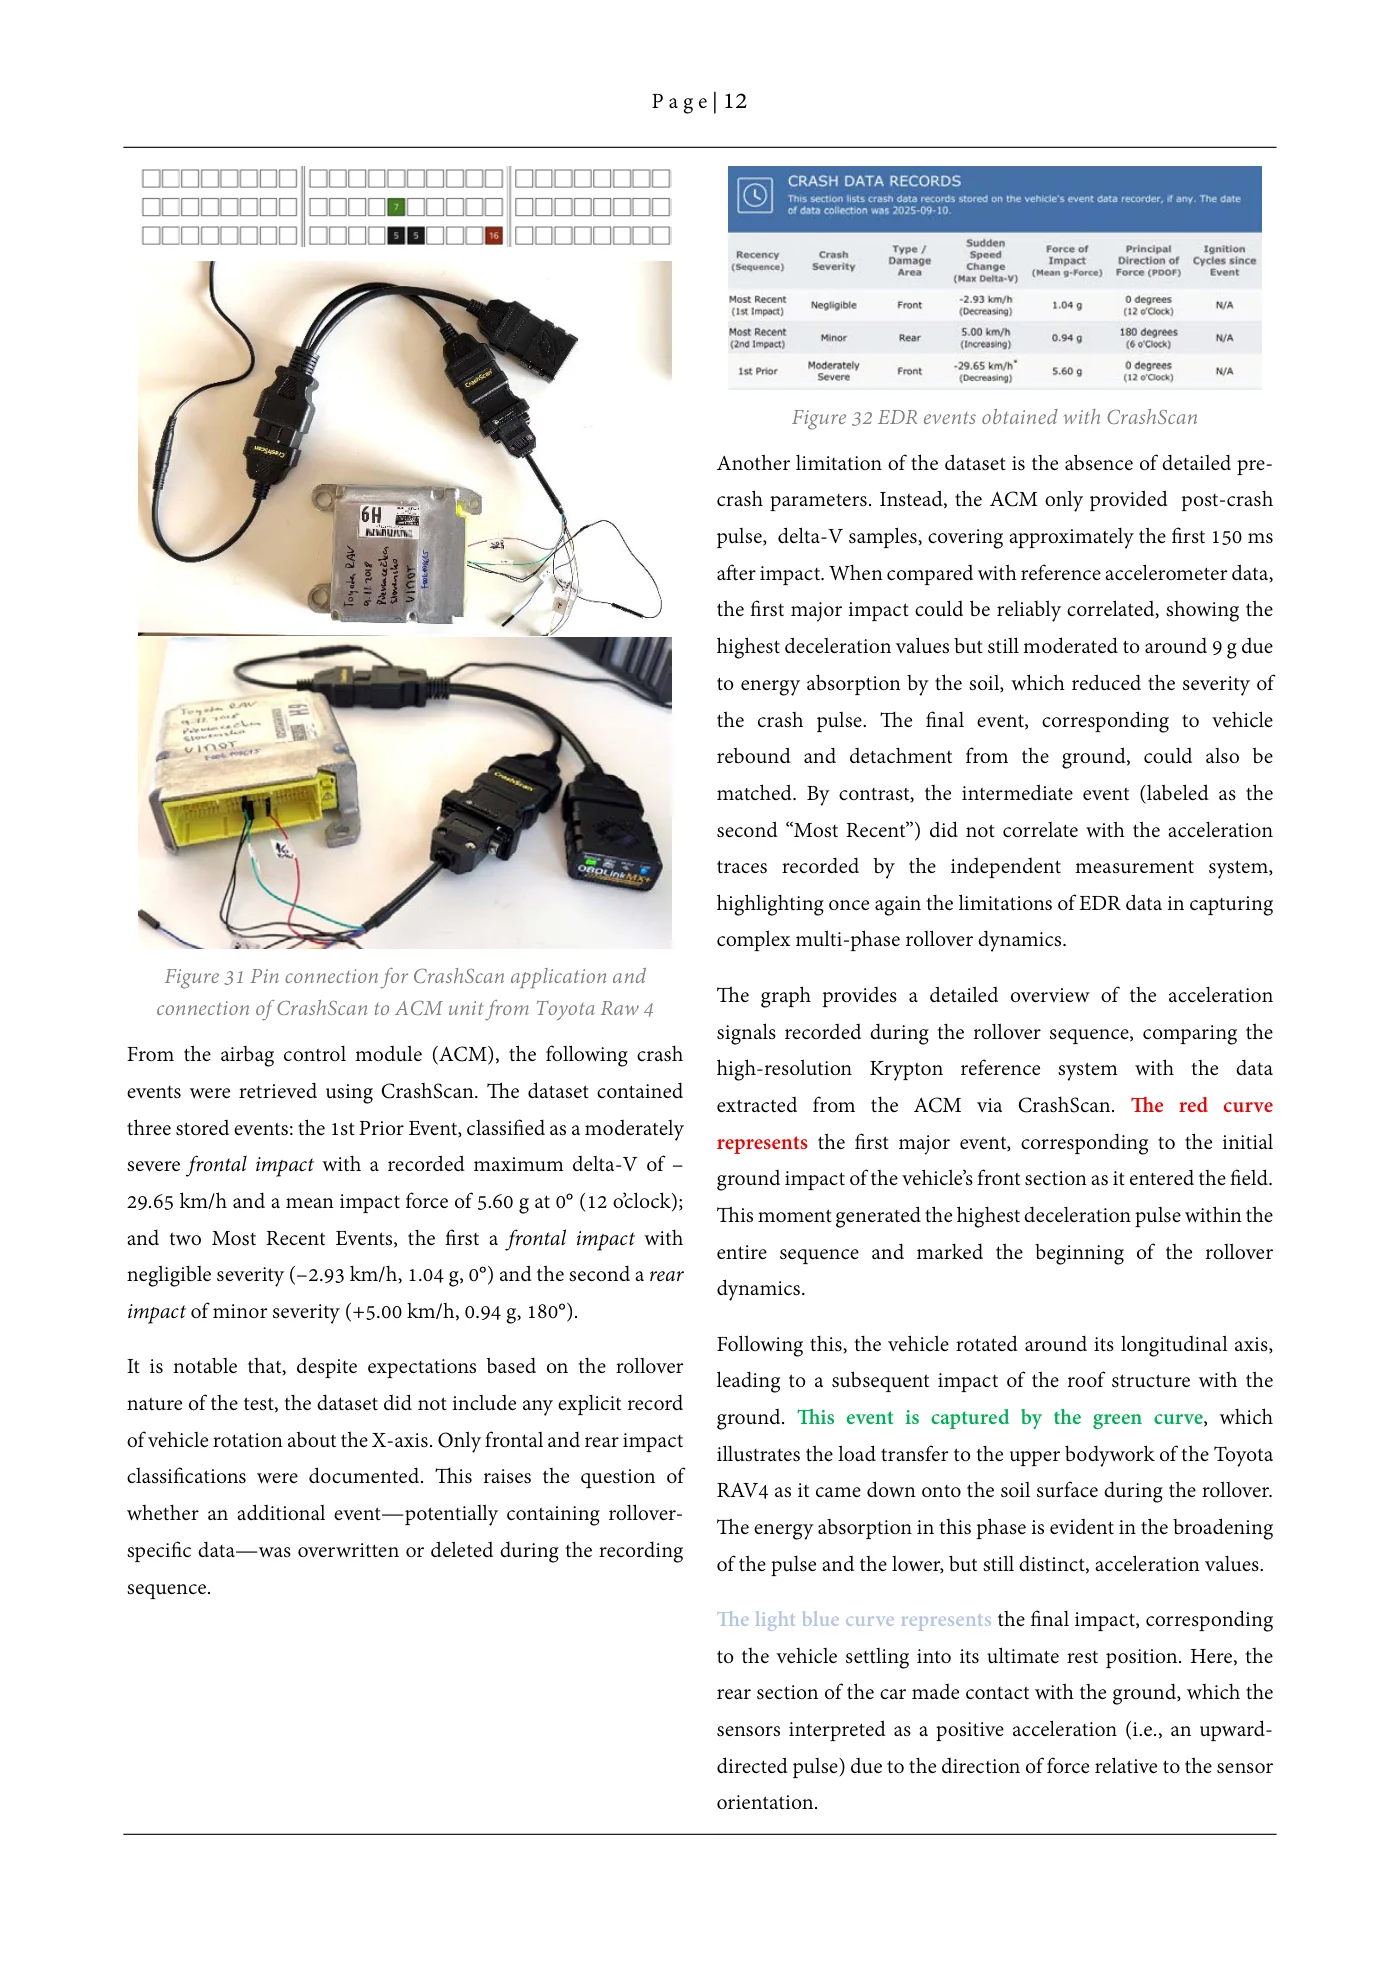
P a g e | 12 Figure 32 EDR events obtained with CrashScan Another limitation of the dataset is the absence of detailed pre- crash parameters. Instead, the ACM only provided post-crash pulse, delta-V samples, covering approximately the first 150 ms after impact. When compared with reference accelerometer data, the first major impact could be reliably correlated, showing the highest deceleration values but still moderated to around 9 g due to energy absorption by the soil, which reduced the severity of the crash pulse. The final event, corresponding to vehicle rebound and detachment from the ground, could also be matched. By contrast, the intermediate event (labeled as the second “Most Recent”) did not correlate with the acceleration traces recorded by the independent measurement system, highlighting once again the limitations of EDR data in capturing complex multi-phase rollover dynamics. Figure 31 Pin connection for CrashScan application and The graph provides a detailed overview of the acceleration connection of CrashScan to ACM unit from Toyota Raw 4 signals recorded during the rollover sequence, comparing the From the airbag control module (ACM), the following crash high-resolution Krypton reference system with the data events were retrieved using CrashScan. The dataset contained extracted from the ACM via CrashScan. The red curve three stored events: the 1st Prior Event, classified as a moderately represents the first major event, corresponding to the initial severe frontal impact with a recorded maximum delta-V of – ground impact of the vehicle’s front section as it entered the field. 29.65 km/h and a mean impact force of 5.60 g at 0° (12 o’clock); This moment generated the highest deceleration pulse within the and two Most Recent Events, the first a frontal impact with entire sequence and marked the beginning of the rollover negligible severity (–2.93 km/h, 1.04 g, 0°) and the second a rear dynamics. impact of minor severity (+5.00 km/h, 0.94 g, 180°). Following this, the vehicle rotated around its longitudinal axis, It is notable that, despite expectations based on the rollover leading to a subsequent impact of the roof structure with the nature of the test, the dataset did not include any explicit record ground. This event is captured by the green curve, which of vehicle rotation about the X-axis. Only frontal and rear impact illustrates the load transfer to the upper bodywork of the Toyota classifications were documented. This raises the question of RAV4 as it came down onto the soil surface during the rollover. whether an additional event—potentially containing rollover- The energy absorption in this phase is evident in the broadening specific data—was overwritten or deleted during the recording of the pulse and the lower, but still distinct, acceleration values. sequence. The light blue curve represents the final impact, corresponding to the vehicle settling into its ultimate rest position. Here, the rear section of the car made contact with the ground, which the sensors interpreted as a positive acceleration (i.e., an upward- directed pulse) due to the direction of force relative to the sensor orientation.
Source page 13
Read page 13 extracted text
Extracted text may not preserve table columns. Refer to the page image or original PDF for data relationships.
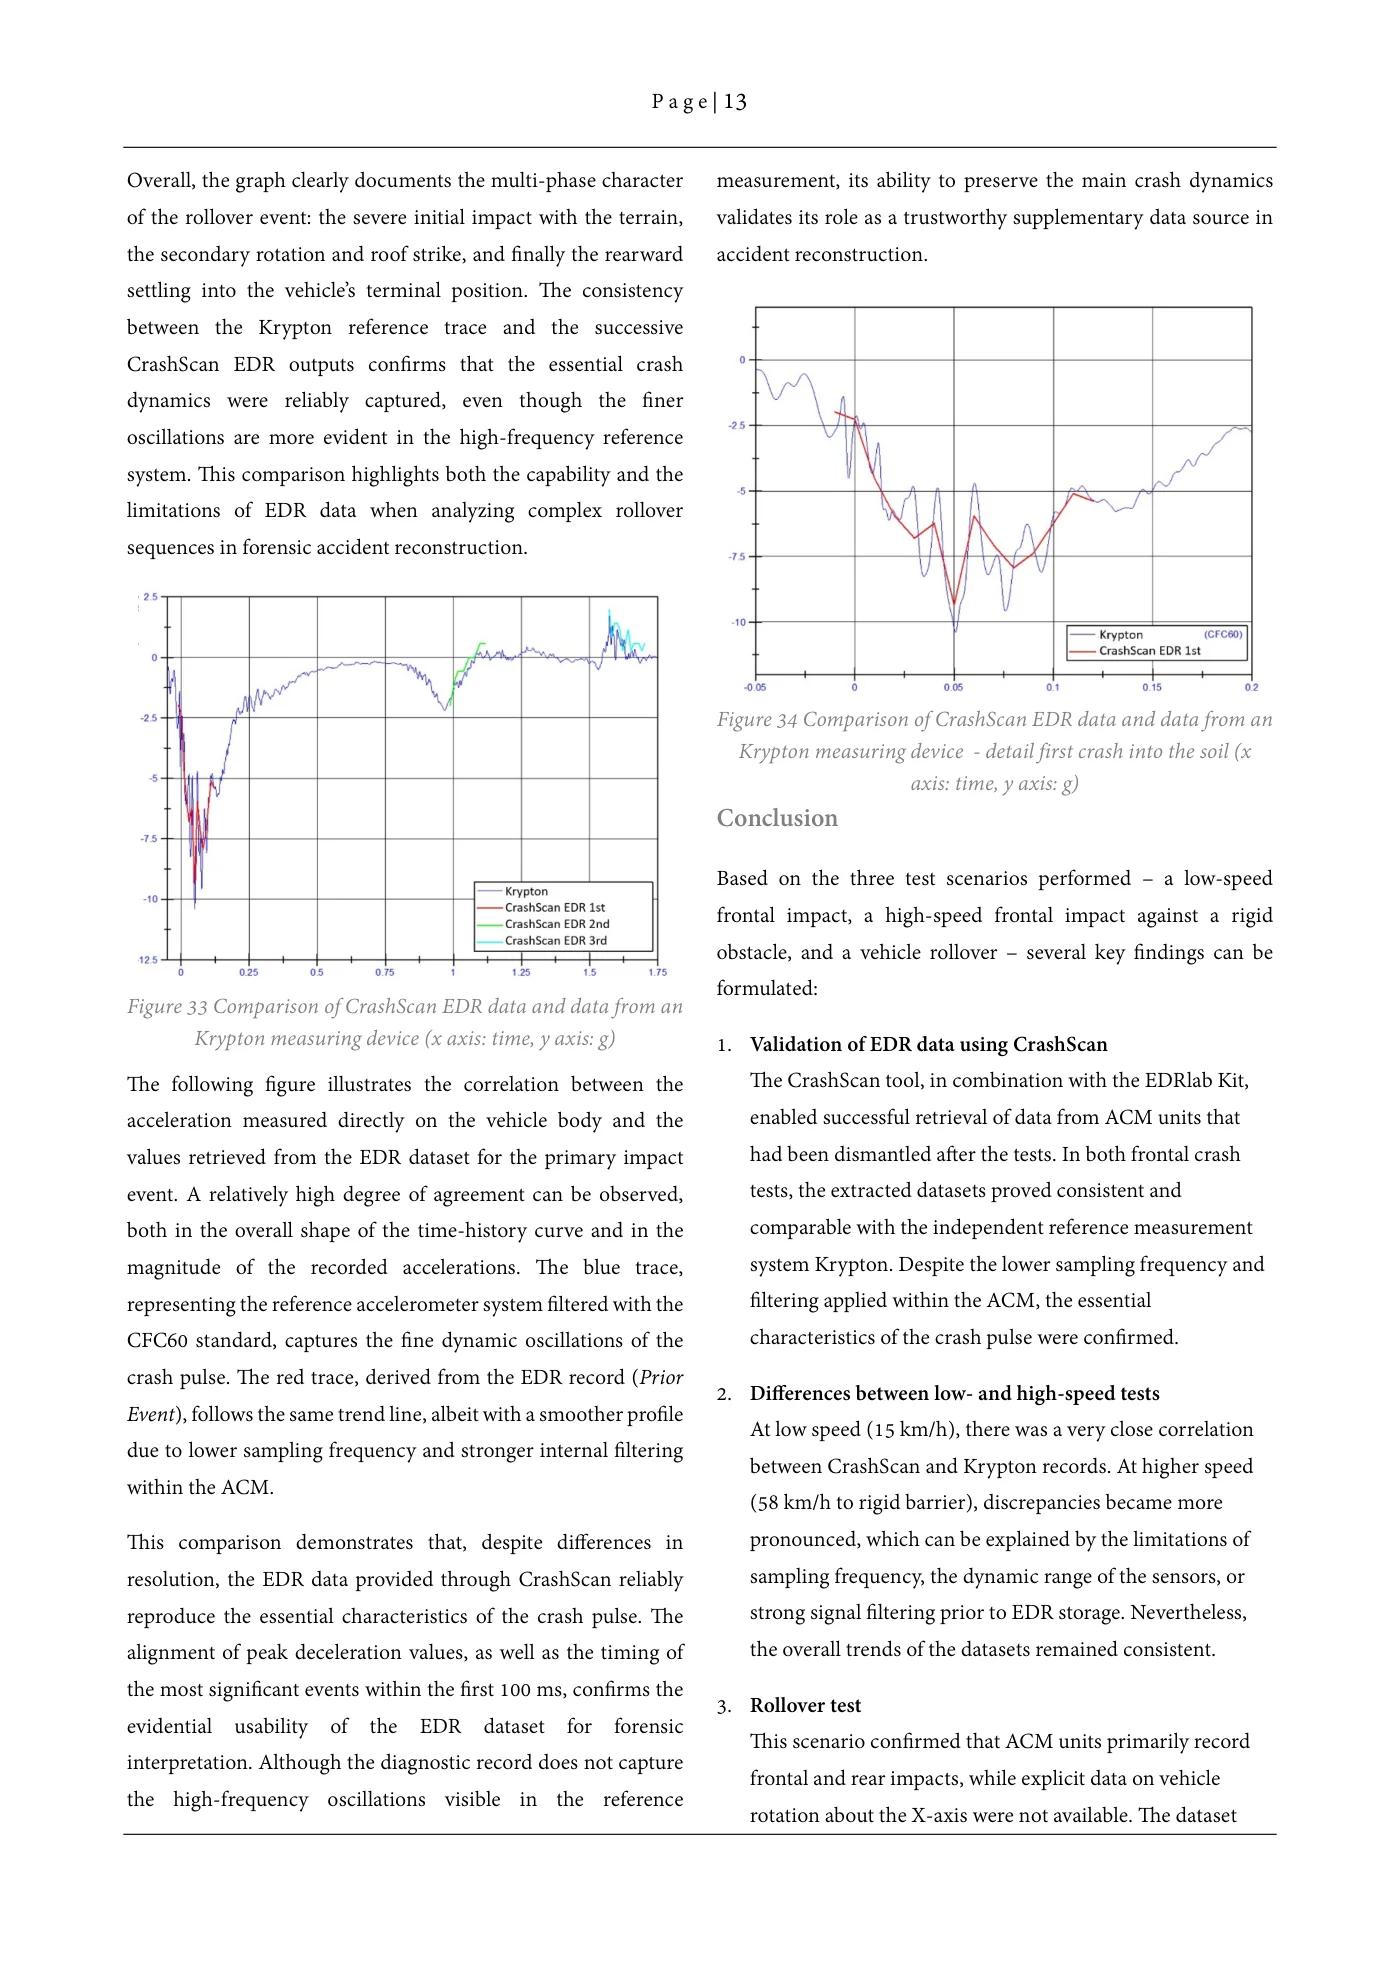
P a g e | 13 Overall, the graph clearly documents the multi-phase character measurement, its ability to preserve the main crash dynamics of the rollover event: the severe initial impact with the terrain, validates its role as a trustworthy supplementary data source in the secondary rotation and roof strike, and finally the rearward accident reconstruction. settling into the vehicle’s terminal position. The consistency between the Krypton reference trace and the successive CrashScan EDR outputs confirms that the essential crash dynamics were reliably captured, even though the finer oscillations are more evident in the high-frequency reference system. This comparison highlights both the capability and the limitations of EDR data when analyzing complex rollover sequences in forensic accident reconstruction. Figure 34 Comparison of CrashScan EDR data and data from an Krypton measuring device - detail first crash into the soil (x axis: time, y axis: g) Conclusion Based on the three test scenarios performed – a low-speed frontal impact, a high-speed frontal impact against a rigid obstacle, and a vehicle rollover – several key findings can be formulated: Figure 33 Comparison of CrashScan EDR data and data from an Krypton measuring device (x axis: time, y axis: g) 1. Validation of EDR data using CrashScan The following figure illustrates the correlation between the The CrashScan tool, in combination with the EDRlab Kit, acceleration measured directly on the vehicle body and the enabled successful retrieval of data from ACM units that values retrieved from the EDR dataset for the primary impact had been dismantled after the tests. In both frontal crash event. A relatively high degree of agreement can be observed, tests, the extracted datasets proved consistent and both in the overall shape of the time-history curve and in the comparable with the independent reference measurement magnitude of the recorded accelerations. The blue trace, system Krypton. Despite the lower sampling frequency and representing the reference accelerometer system filtered with the filtering applied within the ACM, the essential CFC60 standard, captures the fine dynamic oscillations of the characteristics of the crash pulse were confirmed. crash pulse. The red trace, derived from the EDR record (Prior 2. Differences between low- and high-speed tests Event), follows the same trend line, albeit with a smoother profile At low speed (15 km/h), there was a very close correlation due to lower sampling frequency and stronger internal filtering between CrashScan and Krypton records. At higher speed within the ACM. (58 km/h to rigid barrier), discrepancies became more This comparison demonstrates that, despite differences in pronounced, which can be explained by the limitations of resolution, the EDR data provided through CrashScan reliably sampling frequency, the dynamic range of the sensors, or reproduce the essential characteristics of the crash pulse. The strong signal filtering prior to EDR storage. Nevertheless, alignment of peak deceleration values, as well as the timing of the overall trends of the datasets remained consistent. the most significant events within the first 100 ms, confirms the 3. Rollover test evidential usability of the EDR dataset for forensic This scenario confirmed that ACM units primarily record interpretation. Although the diagnostic record does not capture frontal and rear impacts, while explicit data on vehicle the high-frequency oscillations visible in the reference rotation about the X-axis were not available. The dataset
Source page 14
Read page 14 extracted text
Extracted text may not preserve table columns. Refer to the page image or original PDF for data relationships.
P a g e | 14 contained only three events (two of them with low severity), Authors: limiting the detail of rollover dynamics analysis. Even so, it was possible to identify the main phases of the rollover – Ing. Peter Vertal, Ph.D. Institute of Forensic Engineering, the first ground impact, roof contact, and the vehicle’s final University of Zilina, Slovakia resting position. Comparison with Krypton demonstrated peter.vertal@usi.sk / info@vertal.sk that the fundamental crash dynamics were also reflected in the EDR output. Ing. Michal Frydryn, Ph.D. 4. 3D scanning of deformations Department of Forensic Experts in Transportation Vehicle damage was documented using a FARO 3D laser Czech Technical University in Prague scanner, and subsequent cloud-to-cloud (C2C) analysis frydryn@fd.cvut.cz provided precise and visually clear quantification of structural deformations. This approach significantly prof. Ing. Gustav Kasanicky, CSc., MBA increases the evidential and practical value of the Institute of forensic engineering experiments in forensic and insurance practice. University of Zilina , Slovakia gustav.kasanicky@usi.sk5. Forensic implications For forensic experts, it is essential to recognize the limitations of EDR datasets – in particular, the absence of pre-crash parameters and the restricted number of samples. Nonetheless, the data obtained via CrashScan provide a sufficiently reliable basis for reconstructing vehicle speed, direction, and the essential sequence of crash events. The study demonstrated that CrashScan is a robust and reliable tool for retrieving EDR data from ACM units, suitable for forensic accident analysis. While the inherent limitations of sampling frequency and internal signal processing within ACMs must be considered, when combined with reference measurement systems and 3D deformation scanning, the method provides a verifiable and trustworthy dataset that can be fully utilized in forensic and insurance practice.