
Source page 1
Read page 1 extracted text
Extracted text may not preserve table columns. Refer to the page image or original PDF for data relationships.
P a g e | 1 Cross-Verification of Mercedes-Benz EDR Data Using CrashScan and Xentry Ing. Peter Vertal, Ph.D., prof. Ing. Gustav Kasanicky, CSc., MBA Abstract This forensic study highlights the critical importance of Event Data Recorder (EDR) analysis from Airbag Control Modules (ACM) in Mercedes-Benz vehicles. Due to unique control module architectures, Mercedes-Benz vehicles are incompatible with standard Bosch Crash Data Retrieval (CDR); thus, Collision Sciences CrashScan technology, complemented by original Xentry diagnostics, was utilized for accurate data extraction and validation. Over a year-long investigation involving five suspicious Mercedes-Benz accident cases, CrashScan enabled precise retrieval of vehicle speeds, braking patterns, airbag deployments, steering inputs, and event sequences, which were cross-verified with Xentry data. These incidents involved ostensibly genuine collisions of undamaged vehicles for which full replacement value of a new car was claimed. The investigation also included advanced forensic extraction of raw crash data directly from the ACM processor and EEPROM via hardware-level access, revealing key discrepancies and further validating findings obtained through CrashScan and Xentry analysis. Inroduction CrashScan allows a more precise interpretation of Mercedes- The forensic analysis of EDR data stored in Airbag Control Benz-specific codes, a decisive factor for the investigative team. Modules (ACM) is crucial for elucidating traffic accidents, particularly when suspicion of organized insurance fraud arises. The ACM data analysis revealed highly similar behavioral Mercedes-Benz (MB) vehicles feature a unique control module patterns among all five vehicles prior to their accidents. Each architecture, which is not supported by the commonly used vehicle displayed nearly identical braking methods, unusual Bosch Crash Data Retrieval (CDR). Therefore, the alternative absence of preventive driver reactions, and other suspicious CrashScan tool, alongside the original Xentry diagnostic system, elements suggesting staged collisions. Due to the accuracy and becomes critically important. comprehensive nature of CrashScan-derived data, I was able to provide unequivocal evidence confirming suspicions of Over the past year, I was invited by criminal police investigators deliberately orchestrated collisions for illegitimate insurance to participate as an expert in examining a series of suspicious claims. From a legal perspective, confirmed insurance fraud traffic accidents involving five Mercedes-Benz vehicles. Initial constitutes a serious criminal offense under Section 223 of the suspicions of insurance fraud arose immediately following the Criminal Code of the Slovak Republic, qualifying as fraud first incident due to anomalous vehicle positions at accident punishable by up to ten years imprisonment, depending on the scenes, the absence of expected glass fragments, and extent of damage incurred. ACM-derived data serve as objective inconsistent testimonies from involved parties. Over time, an evidence with significant probative value in criminal additional concerning pattern emerged: following each incident, proceedings, provided the data is extracted via authorized tools all vehicles were consistently towed to the same authorized like CrashScan and accurately interpreted by forensic experts. dealership, further solidifying suspicions from the insurance This case study unequivocally demonstrates the necessity of company providing collision coverage. Consequently, a deploying reliable technologies for forensic data extraction from criminal investigator sought my expertise to procure objective modern vehicles, with CrashScan significantly surpassing ACM data evidence, aiming to either substantiate or refute the alternative tools for Mercedes-Benz vehicles. Accurate, rapid, suspicions of an organized insurance fraud scheme. and objective ACM data analysis substantially enhances the efficiency of criminal investigations into insurance fraud, For the forensic examination of these vehicles, I utilized thereby reinforcing legal certainty in criminal justice CrashScan technology, enabling direct and authentic access to proceedings. the ACM-stored records in Mercedes-Benz vehicles. These records include detailed information on vehicle speed before Documentation of damaged cars with iPhone 15 pro collision, seatbelt status, airbag activation, braking impulses, The iPhone Pro lineup (12 Pro, 13 Pro, 14 Pro, and later) steering inputs, and the chronological sequence of events features an integrated LiDAR scanner that uses Time-of-Flight leading up to and during the accident. Unlike other tools, (ToF) technology to capture depth information up to approximately five meters. This capability delivers precise
Source page 2
Read page 2 extracted text
Extracted text may not preserve table columns. Refer to the page image or original PDF for data relationships.
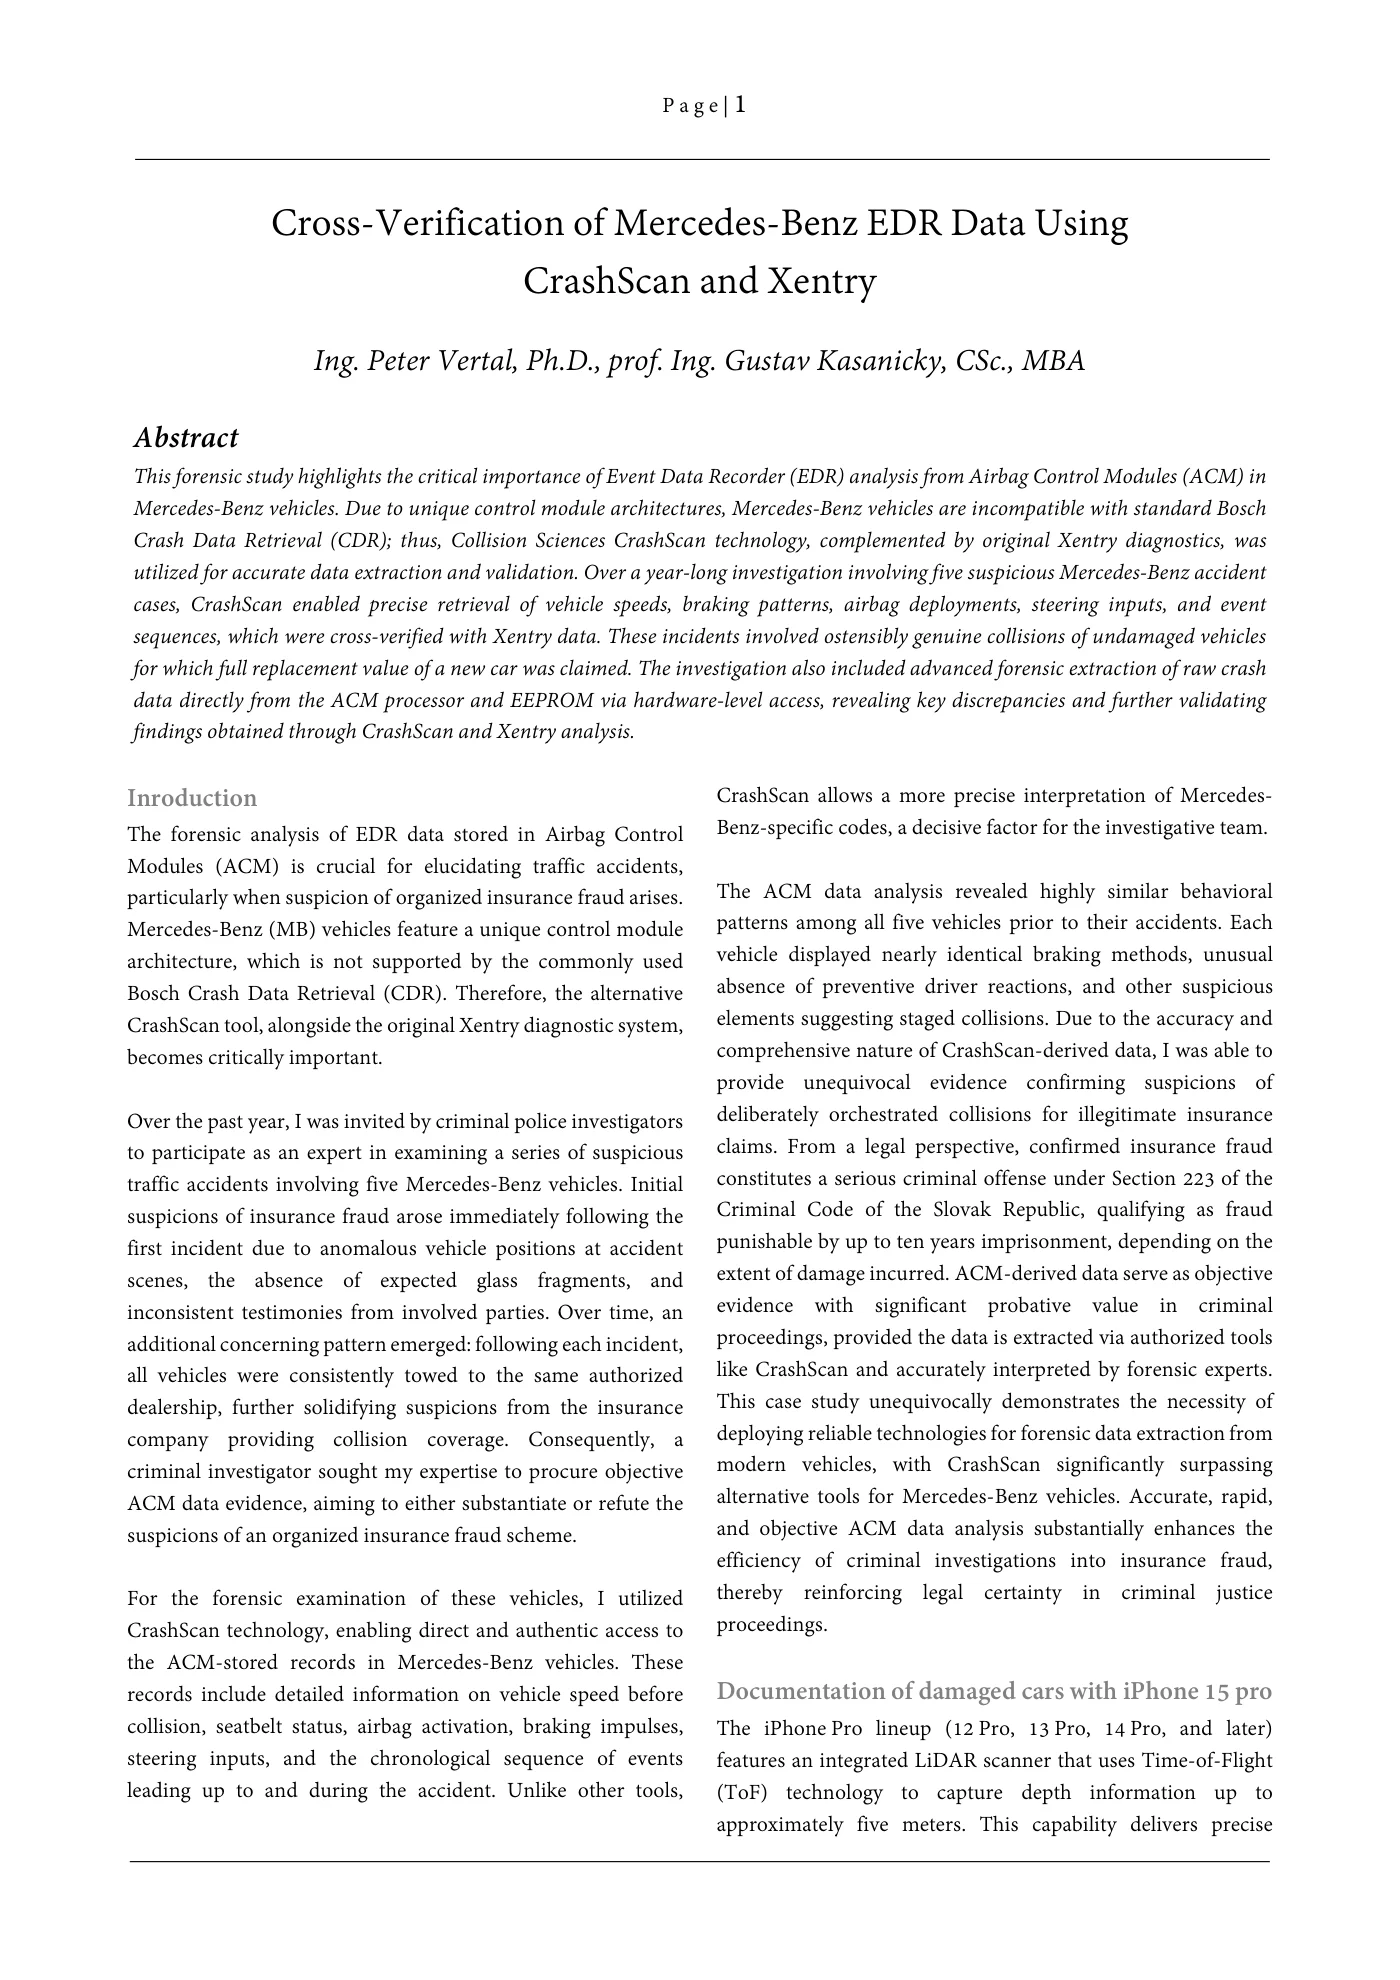
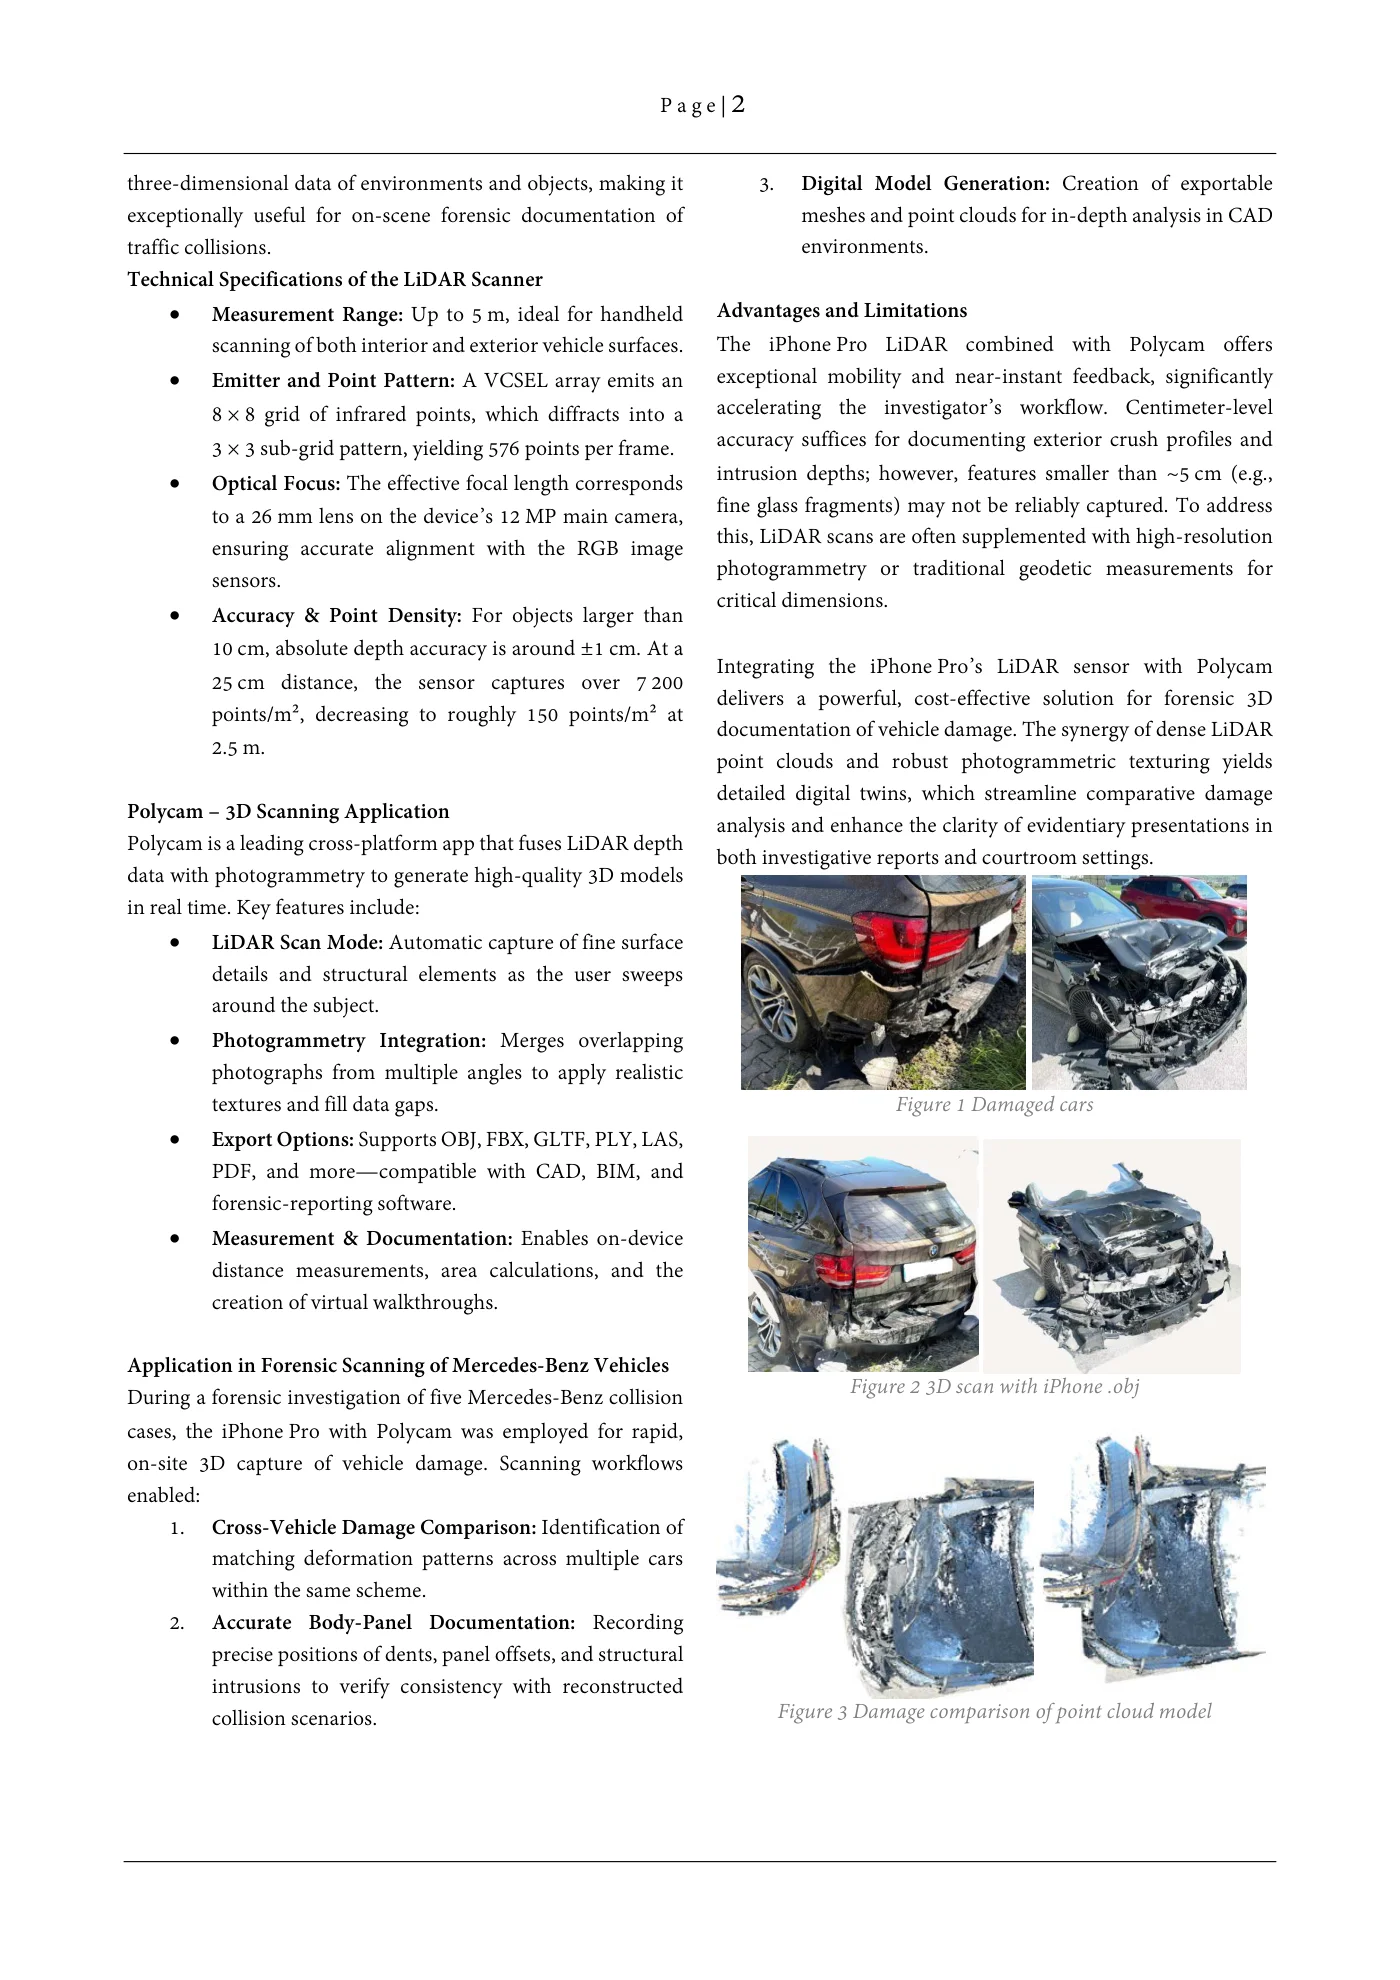
P a g e | 2 three-dimensional data of environments and objects, making it 3. Digital Model Generation: Creation of exportable exceptionally useful for on-scene forensic documentation of meshes and point clouds for in-depth analysis in CAD traffic collisions. environments. Technical Specifications of the LiDAR Scanner • Measurement Range: Up to 5 m, ideal for handheld Advantages and Limitations scanning of both interior and exterior vehicle surfaces. The iPhone Pro LiDAR combined with Polycam offers • Emitter and Point Pattern: A VCSEL array emits an exceptional mobility and near-instant feedback, significantly 8 × 8 grid of infrared points, which diffracts into a accelerating the investigator’s workflow. Centimeter-level 3 × 3 sub-grid pattern, yielding 576 points per frame. accuracy suffices for documenting exterior crush profiles and • Optical Focus: The effective focal length corresponds intrusion depths; however, features smaller than ~5 cm (e.g., fine glass fragments) may not be reliably captured. To address to a 26 mm lens on the device’s 12 MP main camera, this, LiDAR scans are often supplemented with high-resolution ensuring accurate alignment with the RGB image photogrammetry or traditional geodetic measurements for sensors. critical dimensions. • Accuracy & Point Density: For objects larger than 10 cm, absolute depth accuracy is around ±1 cm. At a Integrating the iPhone Pro’s LiDAR sensor with Polycam 25 cm distance, the sensor captures over 7 200 delivers a powerful, cost-effective solution for forensic 3D points/m², decreasing to roughly 150 points/m² at documentation of vehicle damage. The synergy of dense LiDAR 2.5 m. point clouds and robust photogrammetric texturing yields detailed digital twins, which streamline comparative damage Polycam – 3D Scanning Application analysis and enhance the clarity of evidentiary presentations in Polycam is a leading cross-platform app that fuses LiDAR depth both investigative reports and courtroom settings. data with photogrammetry to generate high-quality 3D models in real time. Key features include: • LiDAR Scan Mode: Automatic capture of fine surface details and structural elements as the user sweeps around the subject. • Photogrammetry Integration: Merges overlapping photographs from multiple angles to apply realistic textures and fill data gaps. Figure 1 Damaged cars • Export Options: Supports OBJ, FBX, GLTF, PLY, LAS, PDF, and more—compatible with CAD, BIM, and forensic-reporting software. • Measurement & Documentation: Enables on-device distance measurements, area calculations, and the creation of virtual walkthroughs. Application in Forensic Scanning of Mercedes-Benz Vehicles Figure 2 3D scan with iPhone .objDuring a forensic investigation of five Mercedes-Benz collision cases, the iPhone Pro with Polycam was employed for rapid, on-site 3D capture of vehicle damage. Scanning workflows enabled: 1. Cross-Vehicle Damage Comparison: Identification of matching deformation patterns across multiple cars within the same scheme. 2. Accurate Body-Panel Documentation: Recording precise positions of dents, panel offsets, and structural intrusions to verify consistency with reconstructed collision scenarios. Figure 3 Damage comparison of point cloud model
Source page 3
Read page 3 extracted text
Extracted text may not preserve table columns. Refer to the page image or original PDF for data relationships.
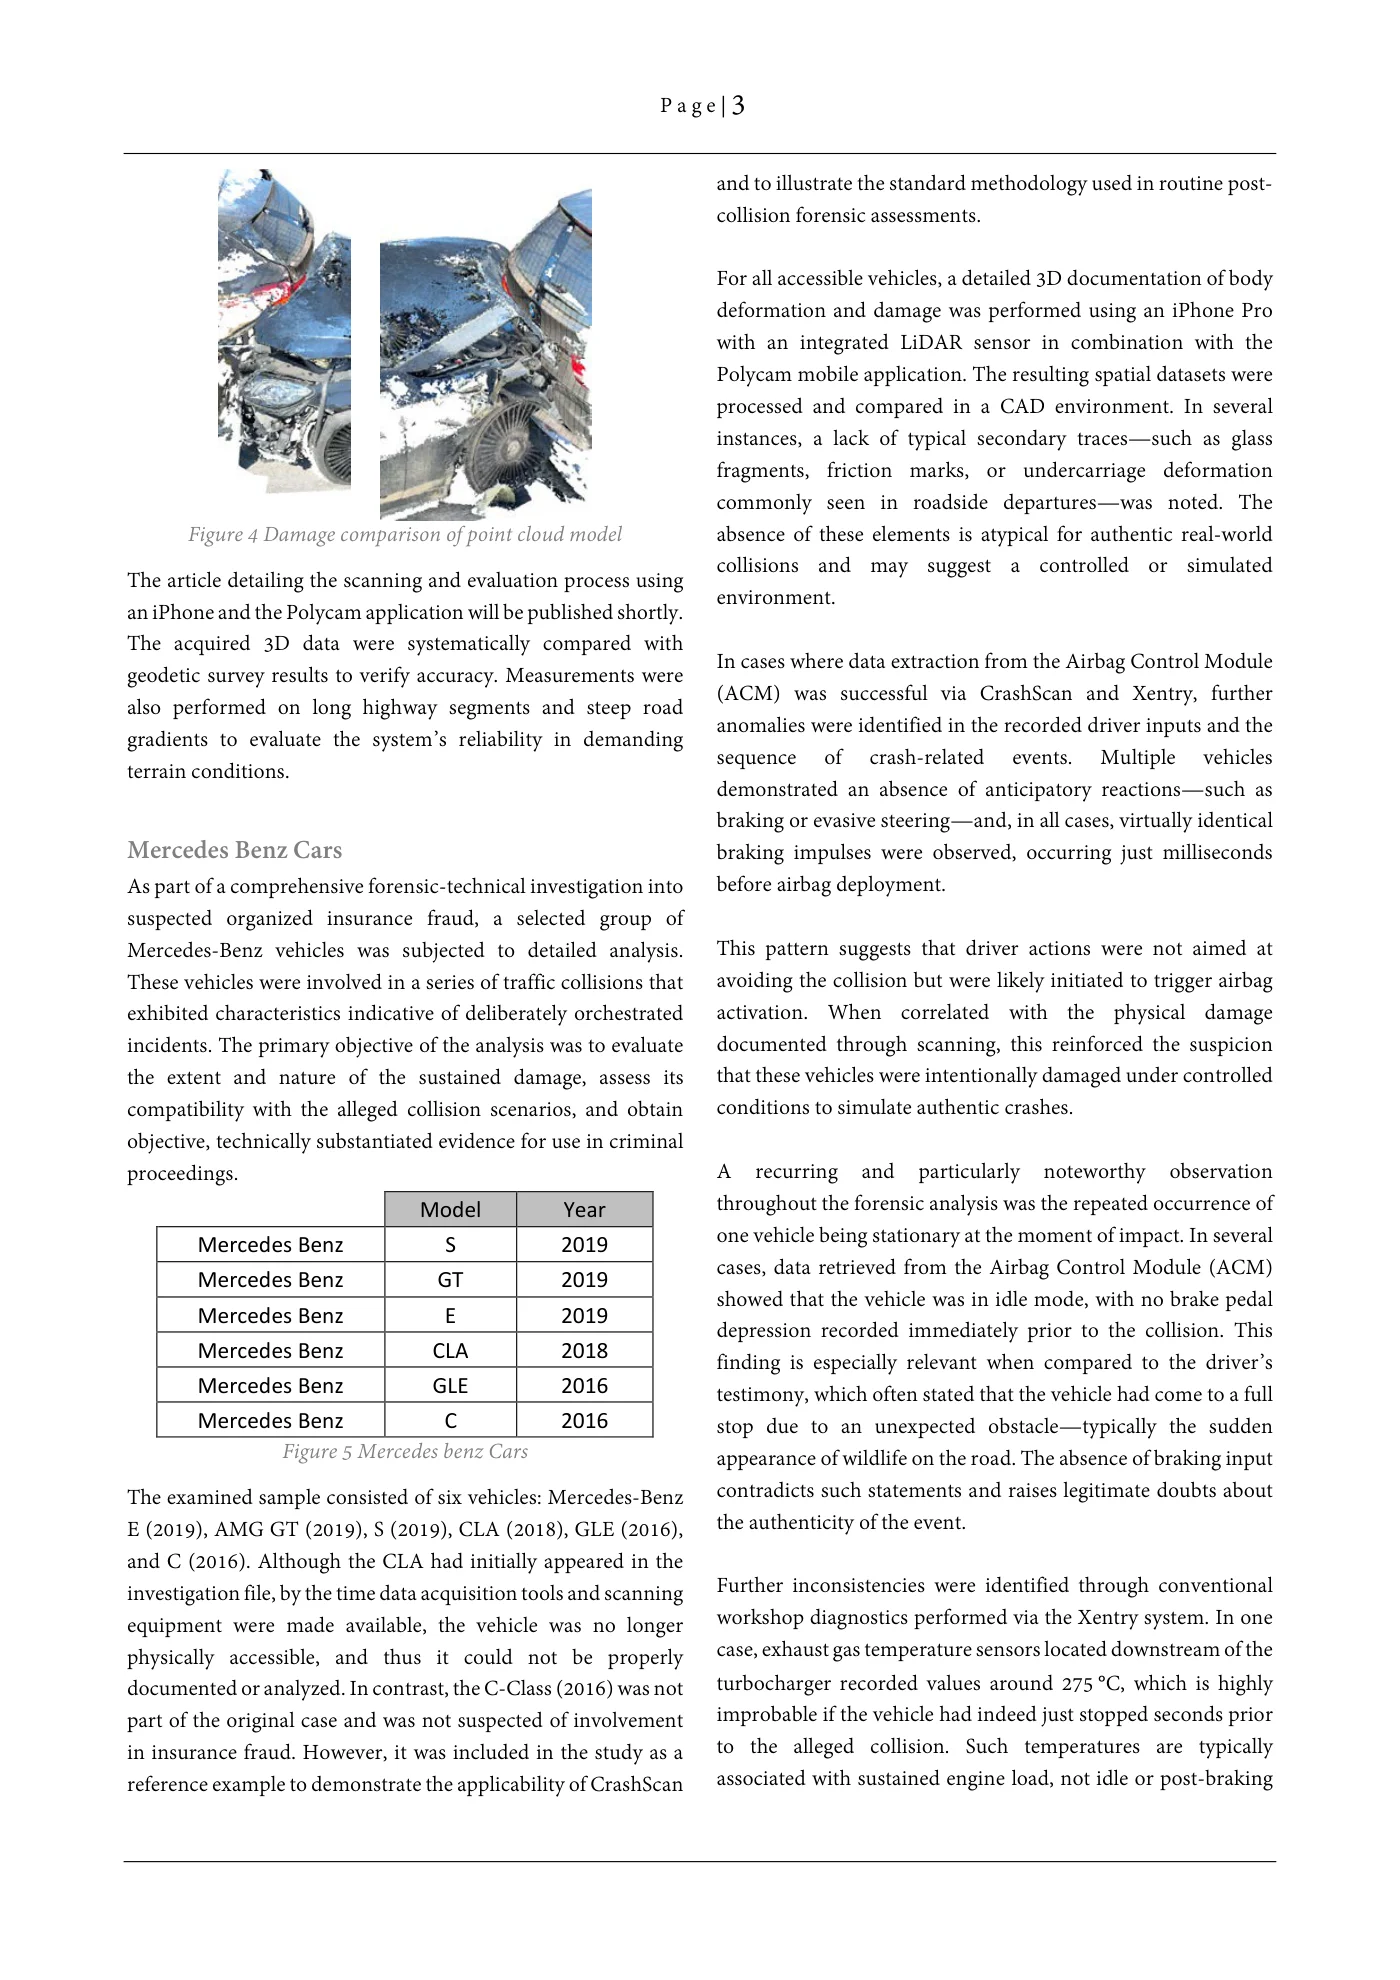
P a g e | 3 and to illustrate the standard methodology used in routine post- collision forensic assessments. For all accessible vehicles, a detailed 3D documentation of body deformation and damage was performed using an iPhone Pro with an integrated LiDAR sensor in combination with the Polycam mobile application. The resulting spatial datasets were processed and compared in a CAD environment. In several instances, a lack of typical secondary traces—such as glass fragments, friction marks, or undercarriage deformation commonly seen in roadside departures—was noted. The Figure 4 Damage comparison of point cloud model absence of these elements is atypical for authentic real-world collisions and may suggest a controlled or simulatedThe article detailing the scanning and evaluation process using environment.an iPhone and the Polycam application will be published shortly. The acquired 3D data were systematically compared with In cases where data extraction from the Airbag Control Modulegeodetic survey results to verify accuracy. Measurements were (ACM) was successful via CrashScan and Xentry, furtheralso performed on long highway segments and steep road anomalies were identified in the recorded driver inputs and thegradients to evaluate the system’s reliability in demanding sequence of crash-related events. Multiple vehiclesterrain conditions. demonstrated an absence of anticipatory reactions—such as braking or evasive steering—and, in all cases, virtually identical Mercedes Benz Cars braking impulses were observed, occurring just milliseconds As part of a comprehensive forensic-technical investigation into before airbag deployment. suspected organized insurance fraud, a selected group of Mercedes-Benz vehicles was subjected to detailed analysis. This pattern suggests that driver actions were not aimed at These vehicles were involved in a series of traffic collisions that avoiding the collision but were likely initiated to trigger airbag exhibited characteristics indicative of deliberately orchestrated activation. When correlated with the physical damage incidents. The primary objective of the analysis was to evaluate documented through scanning, this reinforced the suspicion the extent and nature of the sustained damage, assess its that these vehicles were intentionally damaged under controlled compatibility with the alleged collision scenarios, and obtain conditions to simulate authentic crashes. objective, technically substantiated evidence for use in criminal proceedings. A recurring and particularly noteworthy observation Model Year throughout the forensic analysis was the repeated occurrence of Mercedes Benz S 2019 one vehicle being stationary at the moment of impact. In several cases, data retrieved from the Airbag Control Module (ACM) Mercedes Benz GT 2019 showed that the vehicle was in idle mode, with no brake pedal Mercedes Benz E 2019 depression recorded immediately prior to the collision. This Mercedes Benz CLA 2018 finding is especially relevant when compared to the driver’s Mercedes Benz GLE 2016 testimony, which often stated that the vehicle had come to a full Mercedes Benz C 2016 stop due to an unexpected obstacle—typically the sudden Figure 5 Mercedes benz Cars appearance of wildlife on the road. The absence of braking input contradicts such statements and raises legitimate doubts aboutThe examined sample consisted of six vehicles: Mercedes-Benz the authenticity of the event.E (2019), AMG GT (2019), S (2019), CLA (2018), GLE (2016), and C (2016). Although the CLA had initially appeared in the Further inconsistencies were identified through conventionalinvestigation file, by the time data acquisition tools and scanning workshop diagnostics performed via the Xentry system. In oneequipment were made available, the vehicle was no longer case, exhaust gas temperature sensors located downstream of thephysically accessible, and thus it could not be properly documented or analyzed. In contrast, the C-Class (2016) was not turbocharger recorded values around 275 °C, which is highly part of the original case and was not suspected of involvement improbable if the vehicle had indeed just stopped seconds prior in insurance fraud. However, it was included in the study as a to the alleged collision. Such temperatures are typically reference example to demonstrate the applicability of CrashScan associated with sustained engine load, not idle or post-braking
Source page 4
Read page 4 extracted text
Extracted text may not preserve table columns. Refer to the page image or original PDF for data relationships.
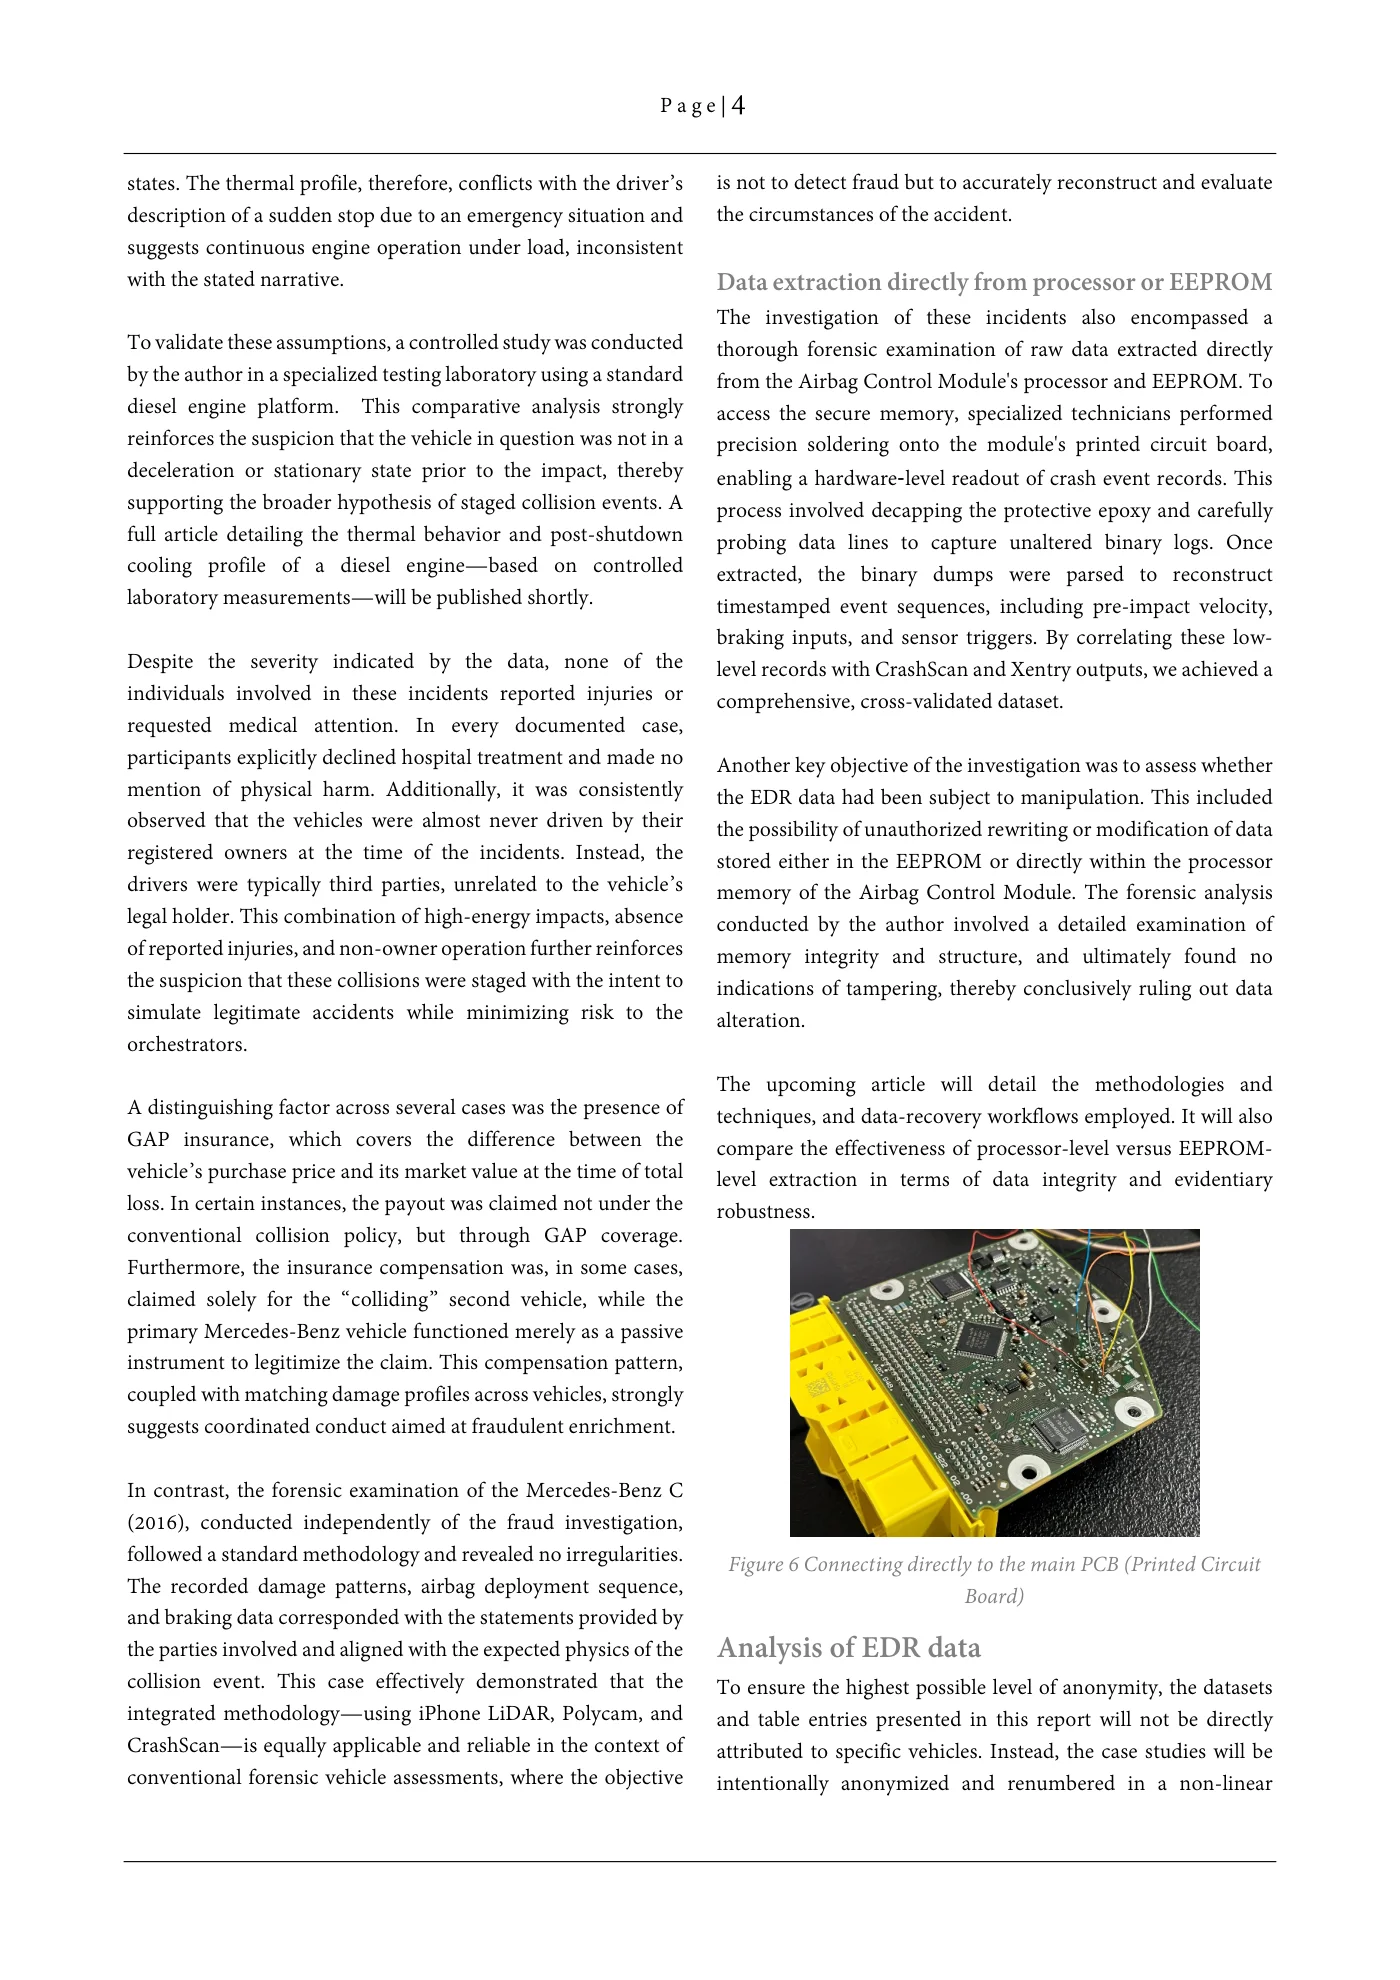
P a g e | 4 states. The thermal profile, therefore, conflicts with the driver’s is not to detect fraud but to accurately reconstruct and evaluate description of a sudden stop due to an emergency situation and the circumstances of the accident. suggests continuous engine operation under load, inconsistent with the stated narrative. Data extraction directly from processor or EEPROM The investigation of these incidents also encompassed a To validate these assumptions, a controlled study was conducted thorough forensic examination of raw data extracted directly by the author in a specialized testing laboratory using a standard from the Airbag Control Module's processor and EEPROM. To diesel engine platform. This comparative analysis strongly access the secure memory, specialized technicians performed reinforces the suspicion that the vehicle in question was not in a precision soldering onto the module's printed circuit board, deceleration or stationary state prior to the impact, thereby enabling a readout of crash event records. This supporting the broader hypothesis of staged collision events. A process involved decapping the protective epoxy and carefully hardware‑levelfull article detailing the thermal behavior and post-shutdown probing data lines to capture unaltered binary logs. Once cooling profile of a diesel engine—based on controlled extracted, the binary dumps were parsed to reconstruct laboratory measurements—will be published shortly. timestamped event sequences, including pre-impact velocity, braking inputs, and sensor triggers. By correlating these low- Despite the severity indicated by the data, none of the level records with CrashScan and Xentry outputs, we achieved a individuals involved in these incidents reported injuries or comprehensive, cross-validated dataset. requested medical attention. In every documented case, participants explicitly declined hospital treatment and made no Another key objective of the investigation was to assess whether mention of physical harm. Additionally, it was consistently the EDR data had been subject to manipulation. This included observed that the vehicles were almost never driven by their the possibility of unauthorized rewriting or modification of data registered owners at the time of the incidents. Instead, the stored either in the EEPROM or directly within the processor drivers were typically third parties, unrelated to the vehicle’s memory of the Airbag Control Module. The forensic analysis legal holder. This combination of high-energy impacts, absence conducted by the author involved a detailed examination of of reported injuries, and non-owner operation further reinforces memory integrity and structure, and ultimately found no the suspicion that these collisions were staged with the intent to indications of tampering, thereby conclusively ruling out data simulate legitimate accidents while minimizing risk to the alteration. orchestrators. The upcoming article will detail the methodologies and A distinguishing factor across several cases was the presence of techniques, and data-recovery workflows employed. It will also GAP insurance, which covers the difference between the compare the effectiveness of processor-level versus EEPROM- vehicle’s purchase price and its market value at the time of total level extraction in terms of data integrity and evidentiary loss. In certain instances, the payout was claimed not under the robustness. conventional collision policy, but through GAP coverage. Furthermore, the insurance compensation was, in some cases, claimed solely for the “colliding” second vehicle, while the primary Mercedes-Benz vehicle functioned merely as a passive instrument to legitimize the claim. This compensation pattern, coupled with matching damage profiles across vehicles, strongly suggests coordinated conduct aimed at fraudulent enrichment. In contrast, the forensic examination of the Mercedes-Benz C (2016), conducted independently of the fraud investigation, followed a standard methodology and revealed no irregularities. Figure 6 Connecting directly to the main PCB (Printed Circuit The recorded damage patterns, airbag deployment sequence, Board) and braking data corresponded with the statements provided by the parties involved and aligned with the expected physics of the Analysis of EDR data collision event. This case effectively demonstrated that the To ensure the highest possible level of anonymity, the datasets integrated methodology—using iPhone LiDAR, Polycam, and and table entries presented in this report will not be directly CrashScan—is equally applicable and reliable in the context of attributed to specific vehicles. Instead, the case studies will be conventional forensic vehicle assessments, where the objective intentionally anonymized and renumbered in a non-linear
Source page 5
Read page 5 extracted text
Extracted text may not preserve table columns. Refer to the page image or original PDF for data relationships.
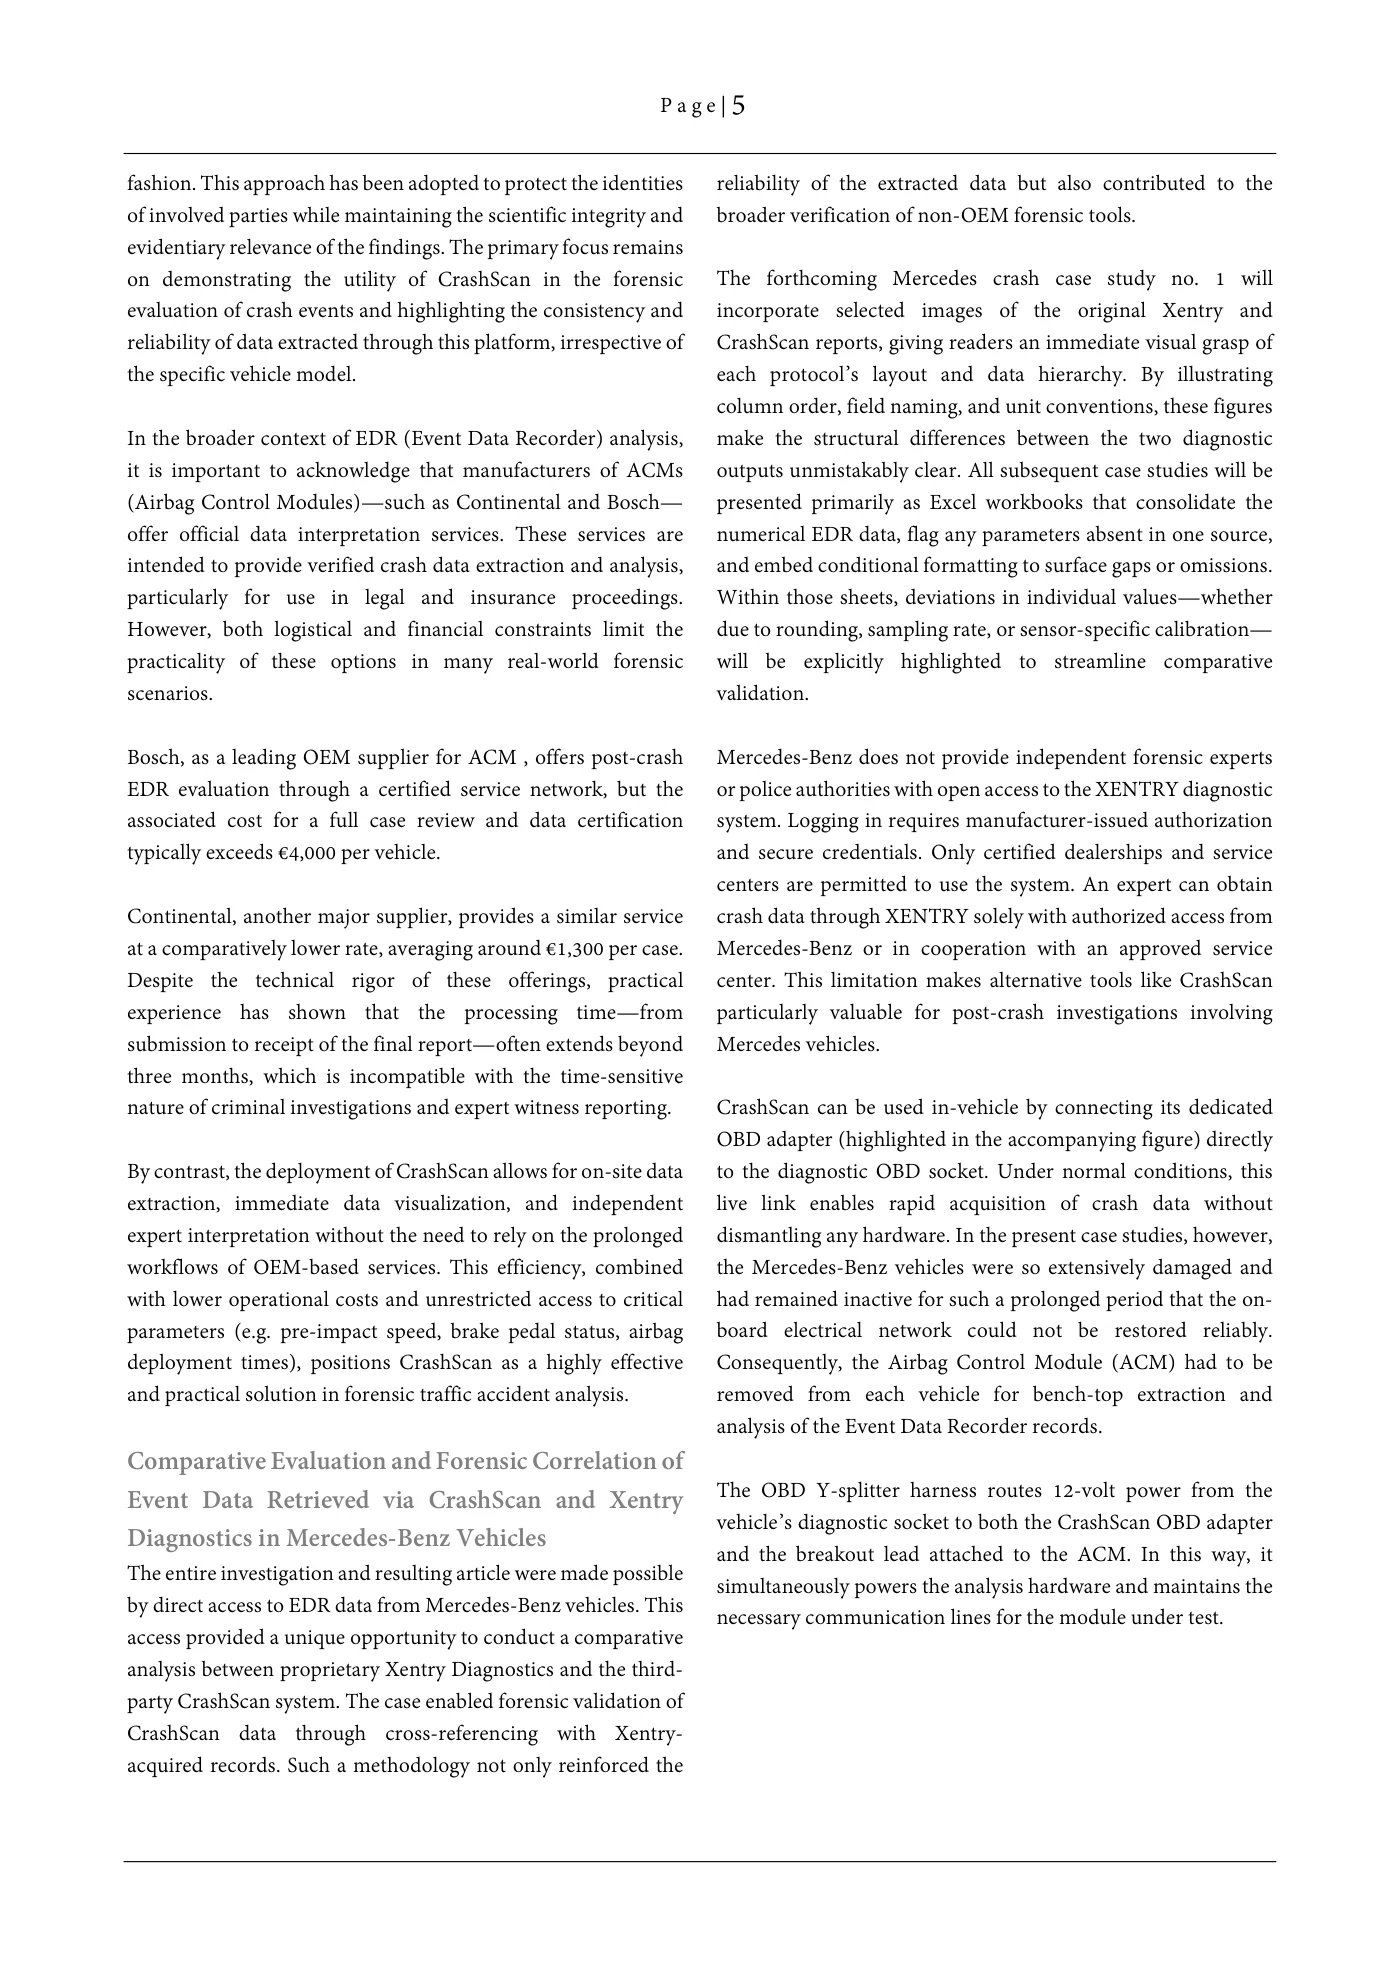
P a g e | 5 fashion. This approach has been adopted to protect the identities reliability of the extracted data but also contributed to the of involved parties while maintaining the scientific integrity and broader verification of non-OEM forensic tools. evidentiary relevance of the findings. The primary focus remains on demonstrating the utility of CrashScan in the forensic The forthcoming Mercedes crash case study no. 1 will evaluation of crash events and highlighting the consistency and incorporate selected images of the original Xentry and reliability of data extracted through this platform, irrespective of CrashScan reports, giving readers an immediate visual grasp of the specific vehicle model. each protocol’s layout and data hierarchy. By illustrating column order, field naming, and unit conventions, these figures In the broader context of EDR (Event Data Recorder) analysis, make the structural differences between the two diagnostic it is important to acknowledge that manufacturers of ACMs outputs unmistakably clear. All subsequent case studies will be (Airbag Control Modules)—such as Continental and Bosch— presented primarily as Excel workbooks that consolidate the offer official data interpretation services. These services are numerical EDR data, flag any parameters absent in one source, intended to provide verified crash data extraction and analysis, and embed conditional formatting to surface gaps or omissions. particularly for use in legal and insurance proceedings. Within those sheets, deviations in individual values—whether However, both logistical and financial constraints limit the due to rounding, sampling rate, or sensor-specific calibration— practicality of these options in many real-world forensic will be explicitly highlighted to streamline comparative scenarios. validation. Bosch, as a leading OEM supplier for ACM , offers post-crash Mercedes-Benz does not provide independent forensic experts EDR evaluation through a certified service network, but the or police authorities with open access to the XENTRY diagnostic associated cost for a full case review and data certification system. Logging in requires manufacturer-issued authorization typically exceeds €4,000 per vehicle. and secure credentials. Only certified dealerships and service centers are permitted to use the system. An expert can obtain Continental, another major supplier, provides a similar service crash data through XENTRY solely with authorized access from at a comparatively lower rate, averaging around €1,300 per case. Mercedes-Benz or in cooperation with an approved service Despite the technical rigor of these offerings, practical center. This limitation makes alternative tools like CrashScan experience has shown that the processing time—from particularly valuable for post-crash investigations involving submission to receipt of the final report—often extends beyond Mercedes vehicles. three months, which is incompatible with the time-sensitive nature of criminal investigations and expert witness reporting. CrashScan can be used in-vehicle by connecting its dedicated OBD adapter (highlighted in the accompanying figure) directly By contrast, the deployment of CrashScan allows for on-site data to the diagnostic OBD socket. Under normal conditions, this extraction, immediate data visualization, and independent live link enables rapid acquisition of crash data without expert interpretation without the need to rely on the prolonged dismantling any hardware. In the present case studies, however, workflows of OEM-based services. This efficiency, combined the Mercedes-Benz vehicles were so extensively damaged and with lower operational costs and unrestricted access to critical had remained inactive for such a prolonged period that the on- parameters (e.g. pre-impact speed, brake pedal status, airbag board electrical network could not be restored reliably. deployment times), positions CrashScan as a highly effective Consequently, the Airbag Control Module (ACM) had to be and practical solution in forensic traffic accident analysis. removed from each vehicle for bench-top extraction and analysis of the Event Data Recorder records. Comparative Evaluation and Forensic Correlation of Event Data Retrieved via CrashScan and Xentry The OBD Y-splitter harness routes 12-volt power from the vehicle’s diagnostic socket to both the CrashScan OBD adapter Diagnostics in Mercedes-Benz Vehicles and the breakout lead attached to the ACM. In this way, it The entire investigation and resulting article were made possible simultaneously powers the analysis hardware and maintains the by direct access to EDR data from Mercedes-Benz vehicles. This necessary communication lines for the module under test. access provided a unique opportunity to conduct a comparative analysis between proprietary Xentry Diagnostics and the third- party CrashScan system. The case enabled forensic validation of CrashScan data through cross-referencing with Xentry- acquired records. Such a methodology not only reinforced the
Source page 6
Read page 6 extracted text
Extracted text may not preserve table columns. Refer to the page image or original PDF for data relationships.
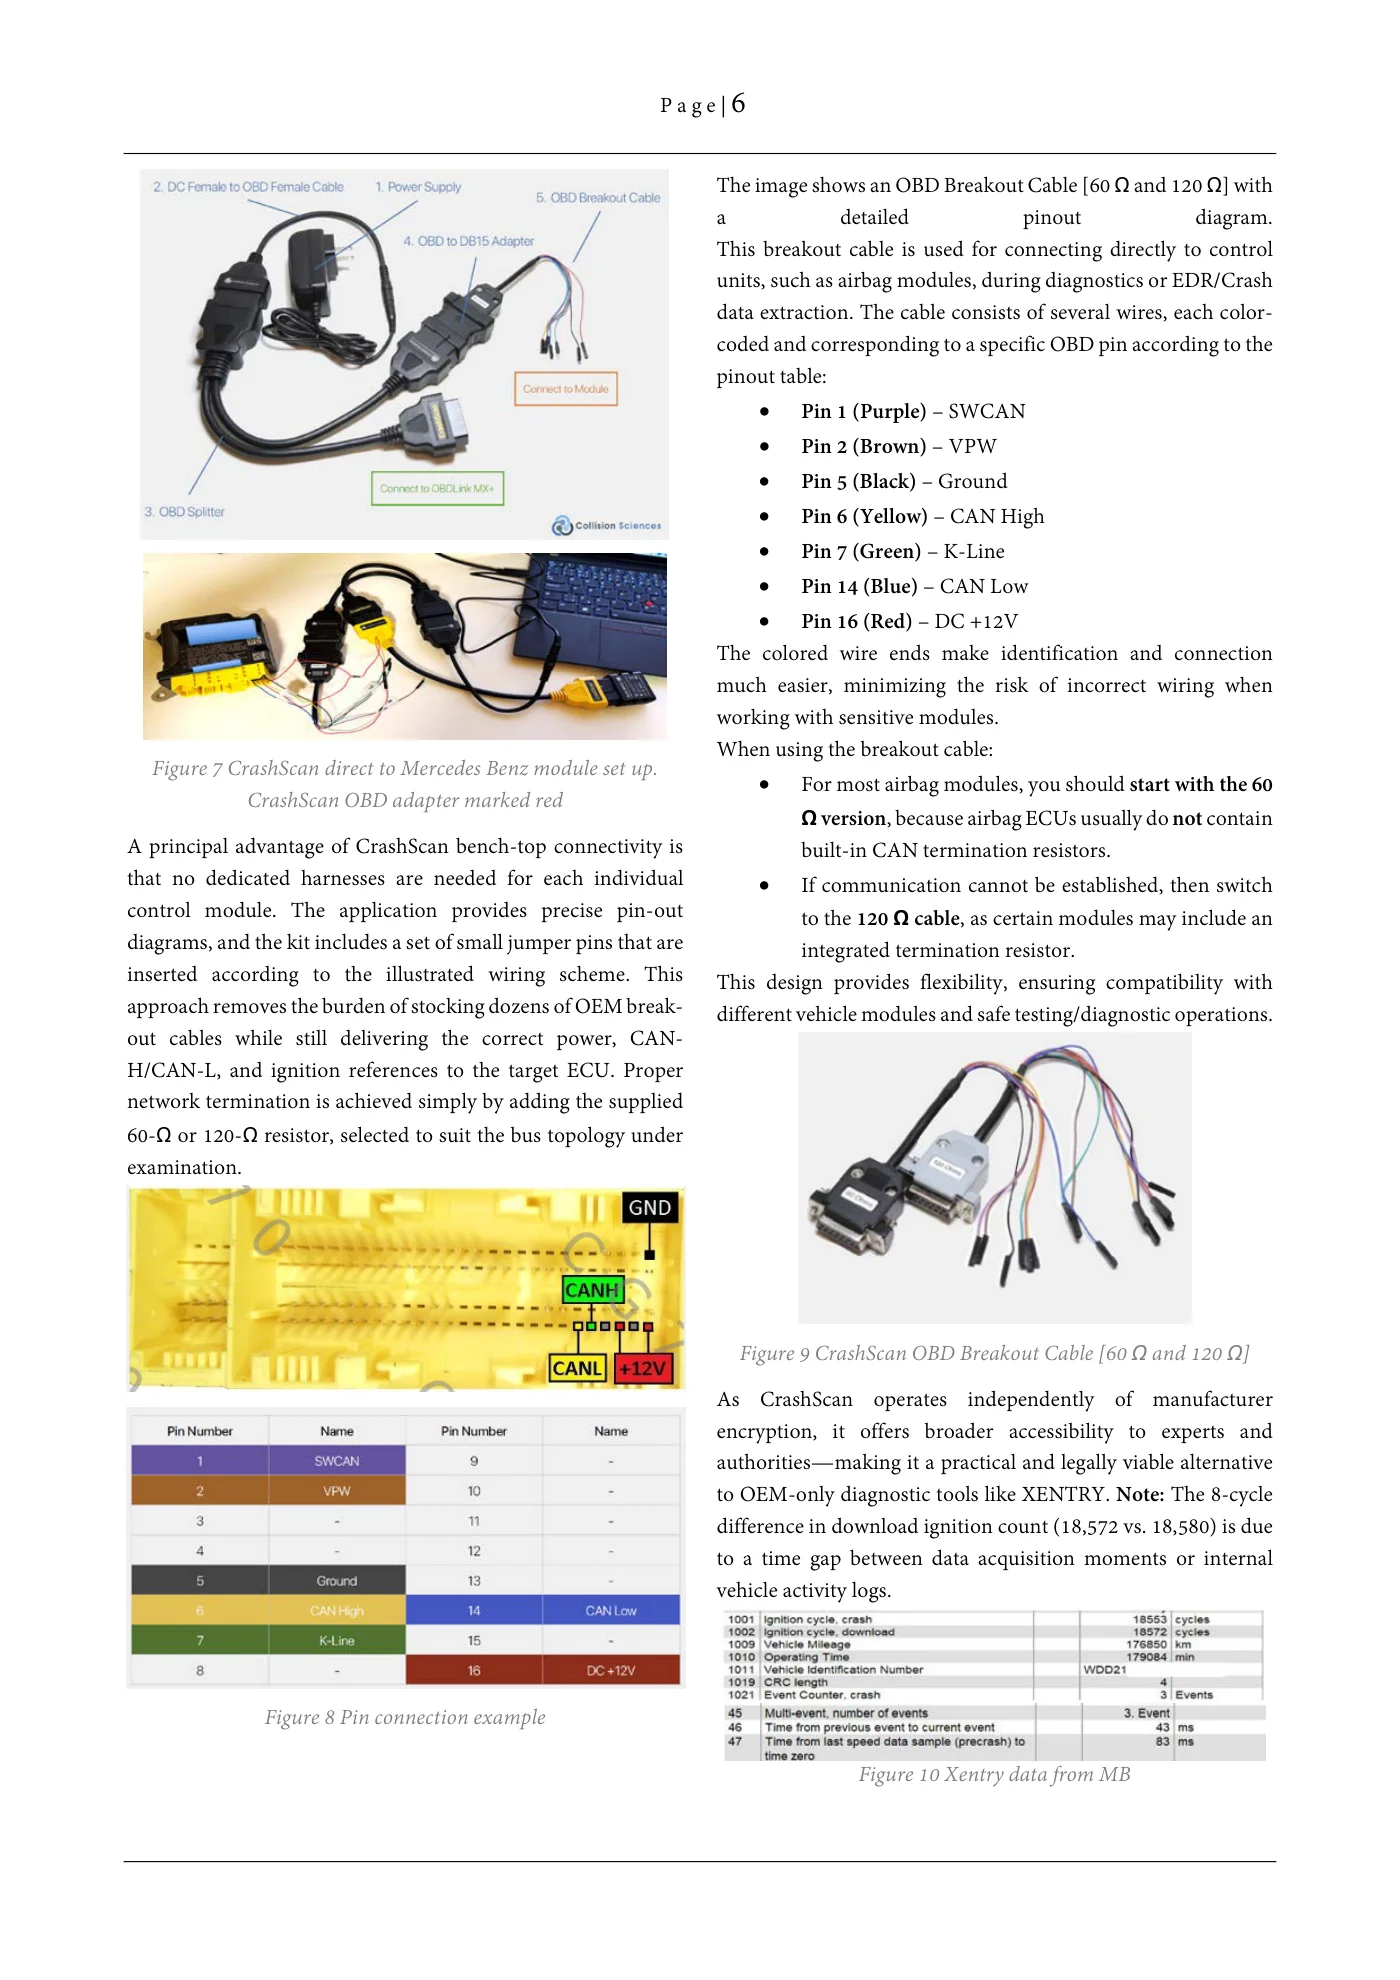
P a g e | 6 The image shows an OBD Breakout Cable [60 Ω and 120 Ω] with a detailed pinout diagram. This breakout cable is used for connecting directly to control units, such as airbag modules, during diagnostics or EDR/Crash data extraction. The cable consists of several wires, each color- coded and corresponding to a specific OBD pin according to the pinout table: • Pin 1 (Purple) – SWCAN • Pin 2 (Brown) – VPW • Pin 5 (Black) – Ground • Pin 6 (Yellow) – CAN High • Pin 7 (Green) – K-Line • Pin 14 (Blue) – CAN Low • Pin 16 (Red) – DC +12V The colored wire ends make identification and connection much easier, minimizing the risk of incorrect wiring when working with sensitive modules. When using the breakout cable: Figure 7 CrashScan direct to Mercedes Benz module set up. • For most airbag modules, you should start with the 60 CrashScan OBD adapter marked red Ω version, because airbag ECUs usually do not contain A principal advantage of CrashScan bench-top connectivity is built-in CAN termination resistors. that no dedicated harnesses are needed for each individual • If communication cannot be established, then switch control module. The application provides precise pin-out to the 120 Ω cable, as certain modules may include an diagrams, and the kit includes a set of small jumper pins that are integrated termination resistor. inserted according to the illustrated wiring scheme. This This design provides flexibility, ensuring compatibility with approach removes the burden of stocking dozens of OEM break- different vehicle modules and safe testing/diagnostic operations. out cables while still delivering the correct power, CAN- H/CAN-L, and ignition references to the target ECU. Proper network termination is achieved simply by adding the supplied 60-Ω or 120-Ω resistor, selected to suit the bus topology under examination. Figure 9 CrashScan OBD Breakout Cable [60 Ω and 120 Ω] As CrashScan operates independently of manufacturer encryption, it offers broader accessibility to experts and authorities—making it a practical and legally viable alternative to OEM-only diagnostic tools like XENTRY. Note: The 8-cycle difference in download ignition count (18,572 vs. 18,580) is due to a time gap between data acquisition moments or internal vehicle activity logs. Figure 8 Pin connection example Figure 10 Xentry data from MB
Source page 7
Read page 7 extracted text
Extracted text may not preserve table columns. Refer to the page image or original PDF for data relationships.
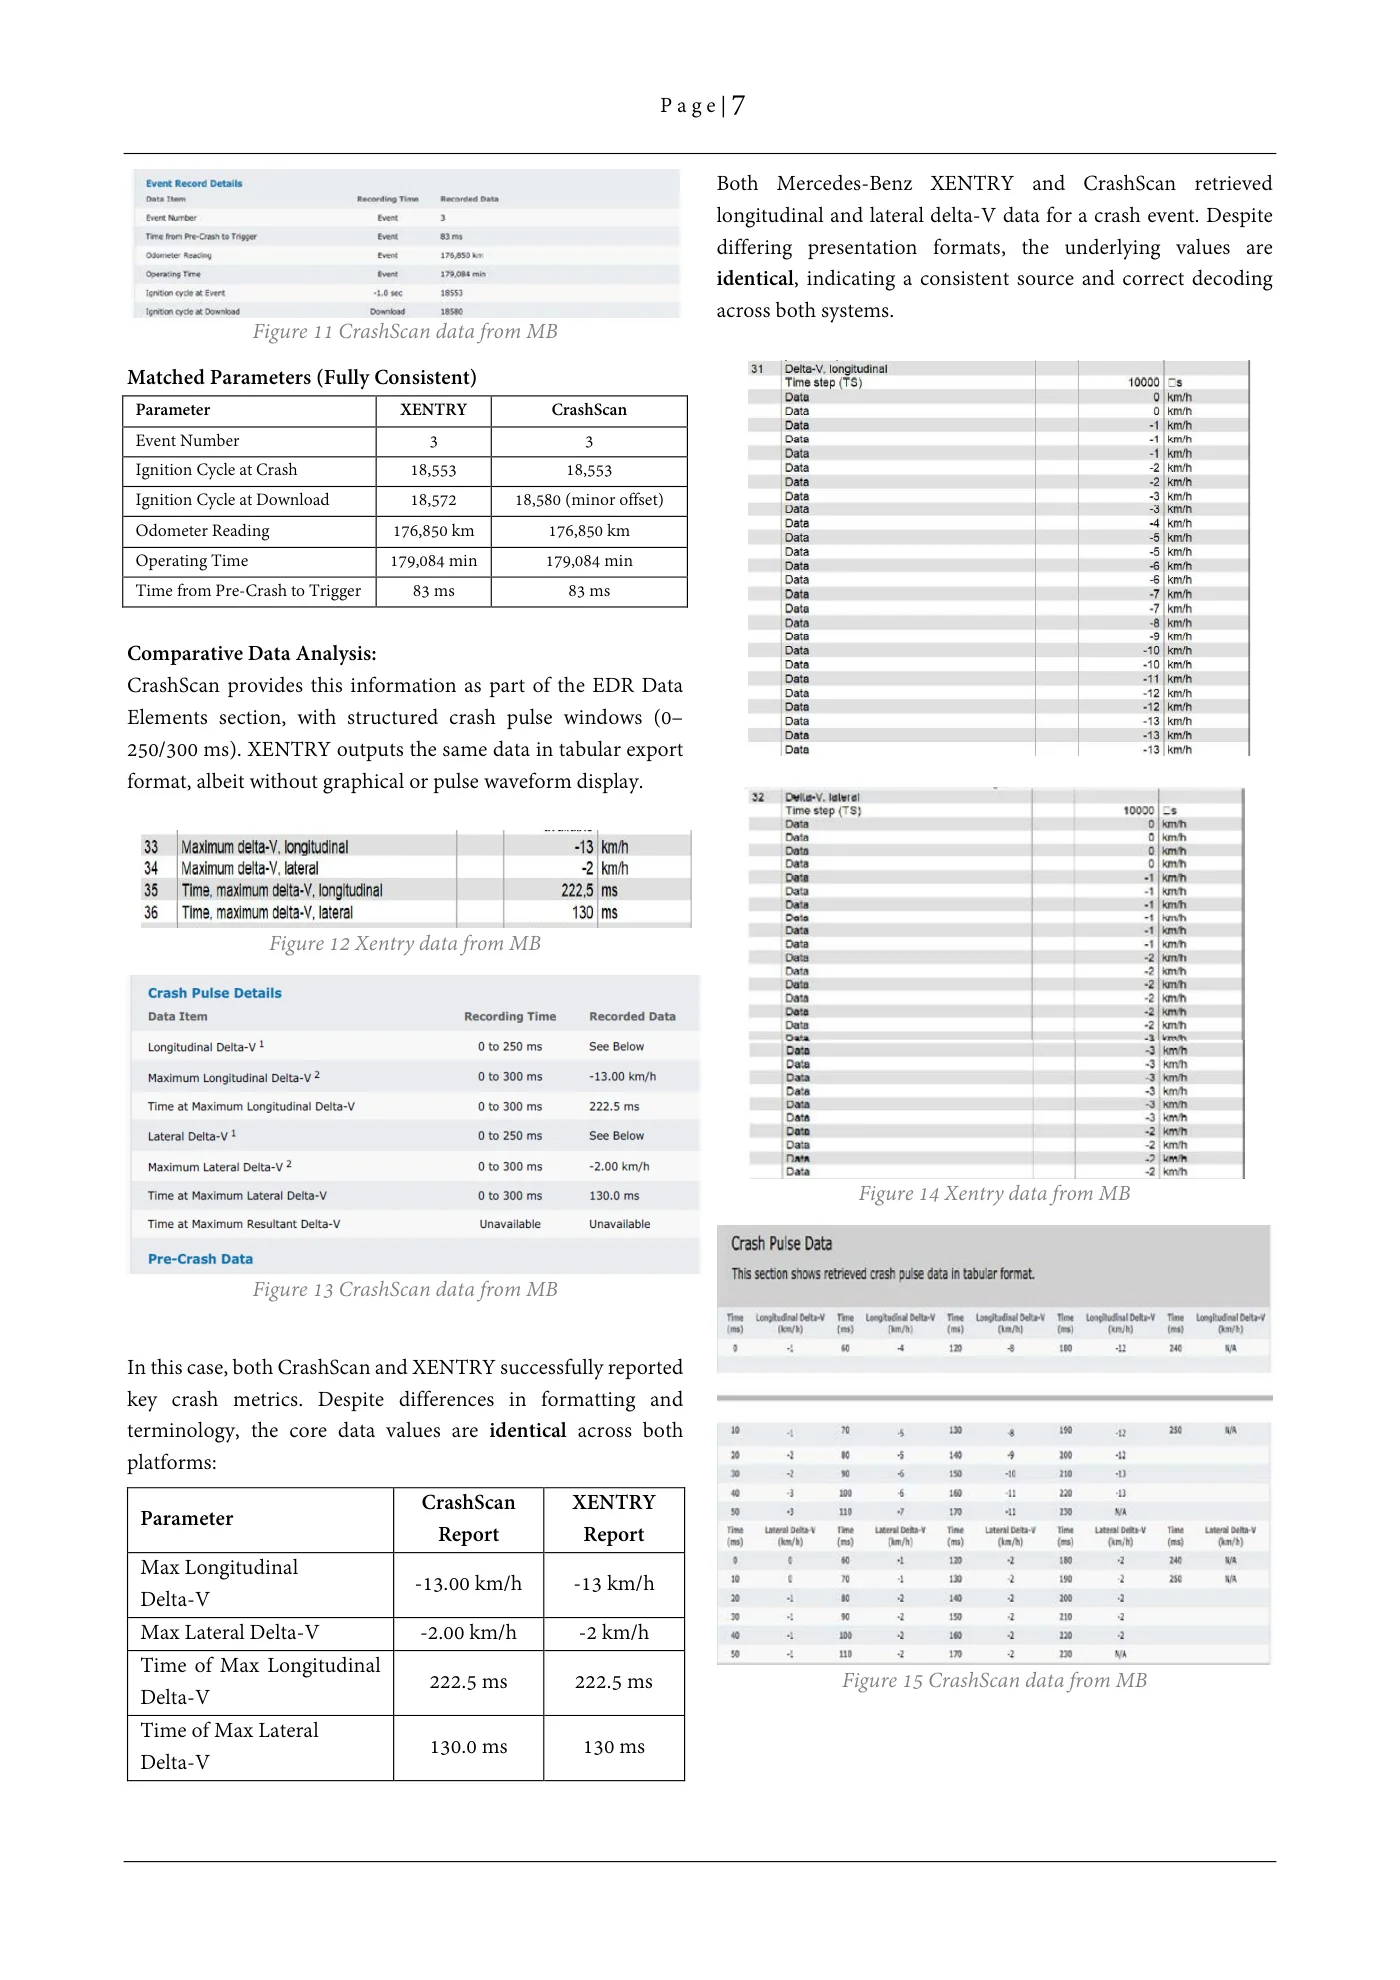
P a g e | 7 Both Mercedes-Benz XENTRY and CrashScan retrieved longitudinal and lateral delta-V data for a crash event. Despite differing presentation formats, the underlying values are identical, indicating a consistent source and correct decoding across both systems. Figure 11 CrashScan data from MB Matched Parameters (Fully Consistent) Parameter XENTRY CrashScan Event Number 3 3 Ignition Cycle at Crash 18,553 18,553 Ignition Cycle at Download 18,572 18,580 (minor offset) Odometer Reading 176,850 km 176,850 km Operating Time 179,084 min 179,084 min Time from Pre-Crash to Trigger 83 ms 83 ms Comparative Data Analysis: CrashScan provides this information as part of the EDR Data Elements section, with structured crash pulse windows (0– 250/300 ms). XENTRY outputs the same data in tabular export format, albeit without graphical or pulse waveform display. Figure 12 Xentry data from MB Figure 14 Xentry data from MB Figure 13 CrashScan data from MB In this case, both CrashScan and XENTRY successfully reported key crash metrics. Despite differences in formatting and terminology, the core data values are identical across both platforms: CrashScan XENTRY Parameter Report Report Max Longitudinal -13.00 km/h -13 km/h Delta-V Max Lateral Delta-V -2.00 km/h -2 km/h Time of Max Longitudinal 222.5 ms 222.5 ms Figure 15 CrashScan data from MB Delta-V Time of Max Lateral 130.0 ms 130 ms Delta-V
Source page 8
Read page 8 extracted text
Extracted text may not preserve table columns. Refer to the page image or original PDF for data relationships.
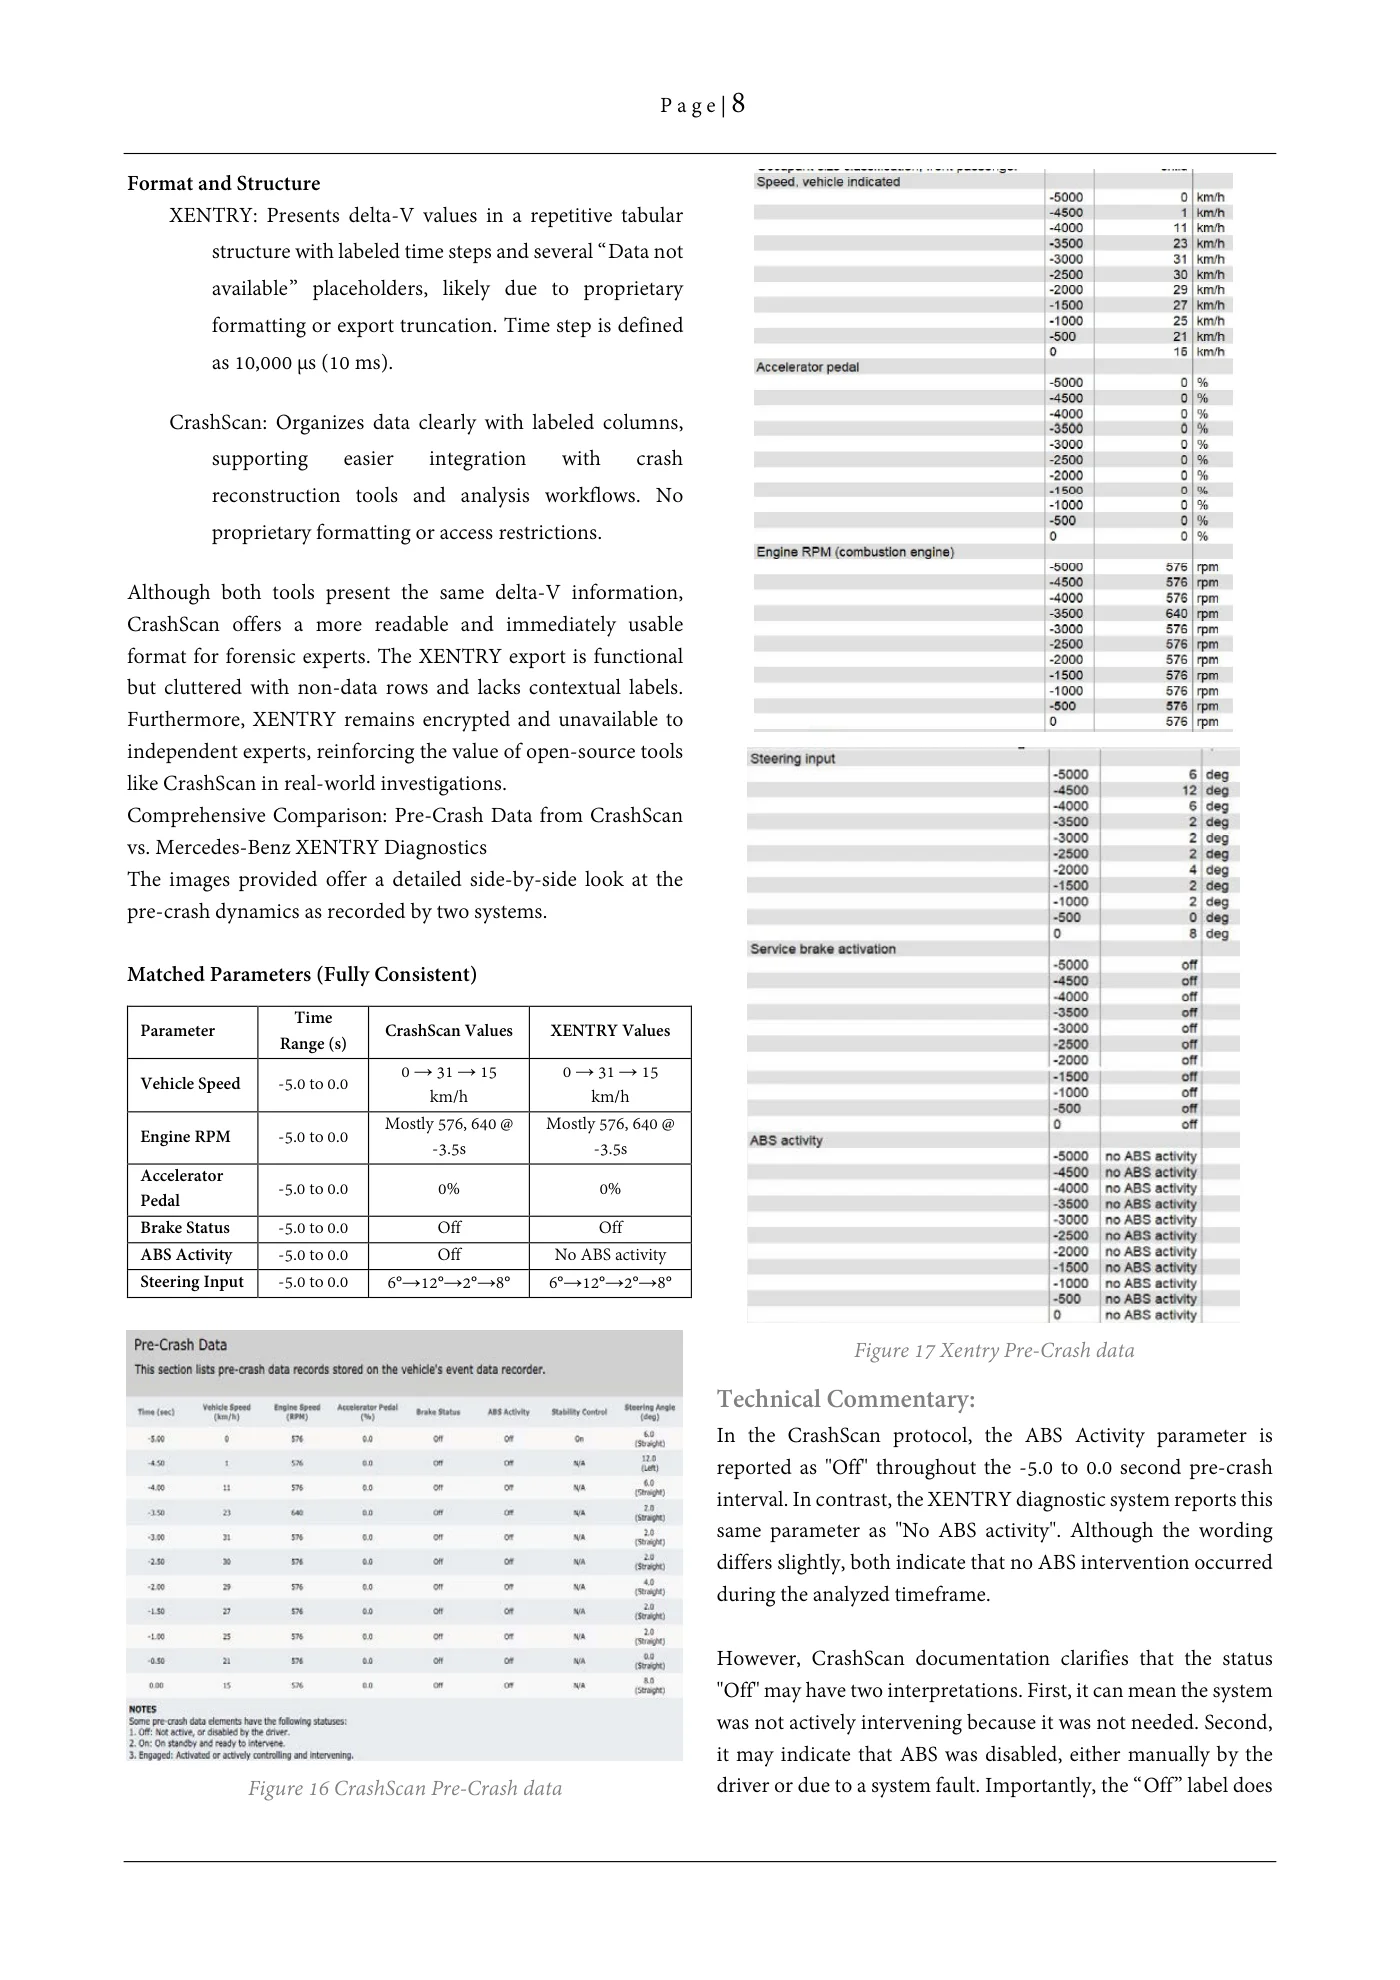
P a g e | 8 Format and Structure XENTRY: Presents delta-V values in a repetitive tabular structure with labeled time steps and several “Data not available” placeholders, likely due to proprietary formatting or export truncation. Time step is defined as 10,000 µs (10 ms). CrashScan: Organizes data clearly with labeled columns, supporting easier integration with crash reconstruction tools and analysis workflows. No proprietary formatting or access restrictions. Although both tools present the same delta-V information, CrashScan offers a more readable and immediately usable format for forensic experts. The XENTRY export is functional but cluttered with non-data rows and lacks contextual labels. Furthermore, XENTRY remains encrypted and unavailable to independent experts, reinforcing the value of open-source tools like CrashScan in real-world investigations. Comprehensive Comparison: Pre-Crash Data from CrashScan vs. Mercedes-Benz XENTRY Diagnostics The images provided offer a detailed side-by-side look at the pre-crash dynamics as recorded by two systems. Matched Parameters (Fully Consistent) Time Parameter CrashScan Values XENTRY Values Range (s) 0 → 31 → 15 0 → 31 → 15 Vehicle Speed -5.0 to 0.0 km/h km/h Mostly 576, 640 @ Mostly 576, 640 @ Engine RPM -5.0 to 0.0 -3.5s -3.5s Accelerator -5.0 to 0.0 0% 0% Pedal Brake Status -5.0 to 0.0 Off Off ABS Activity -5.0 to 0.0 Off No ABS activity Steering Input -5.0 to 0.0 6°→12°→2°→8° 6°→12°→2°→8° Figure 17 Xentry Pre-Crash data Technical Commentary: In the CrashScan protocol, the ABS Activity parameter is reported as "Off" throughout the -5.0 to 0.0 second pre-crash interval. In contrast, the XENTRY diagnostic system reports this same parameter as "No ABS activity". Although the wording differs slightly, both indicate that no ABS intervention occurred during the analyzed timeframe. However, CrashScan documentation clarifies that the status "Off" may have two interpretations. First, it can mean the system was not actively intervening because it was not needed. Second, it may indicate that ABS was disabled, either manually by the Figure 16 CrashScan Pre-Crash data driver or due to a system fault. Importantly, the “Off” label does
Source page 9
Read page 9 extracted text
Extracted text may not preserve table columns. Refer to the page image or original PDF for data relationships.
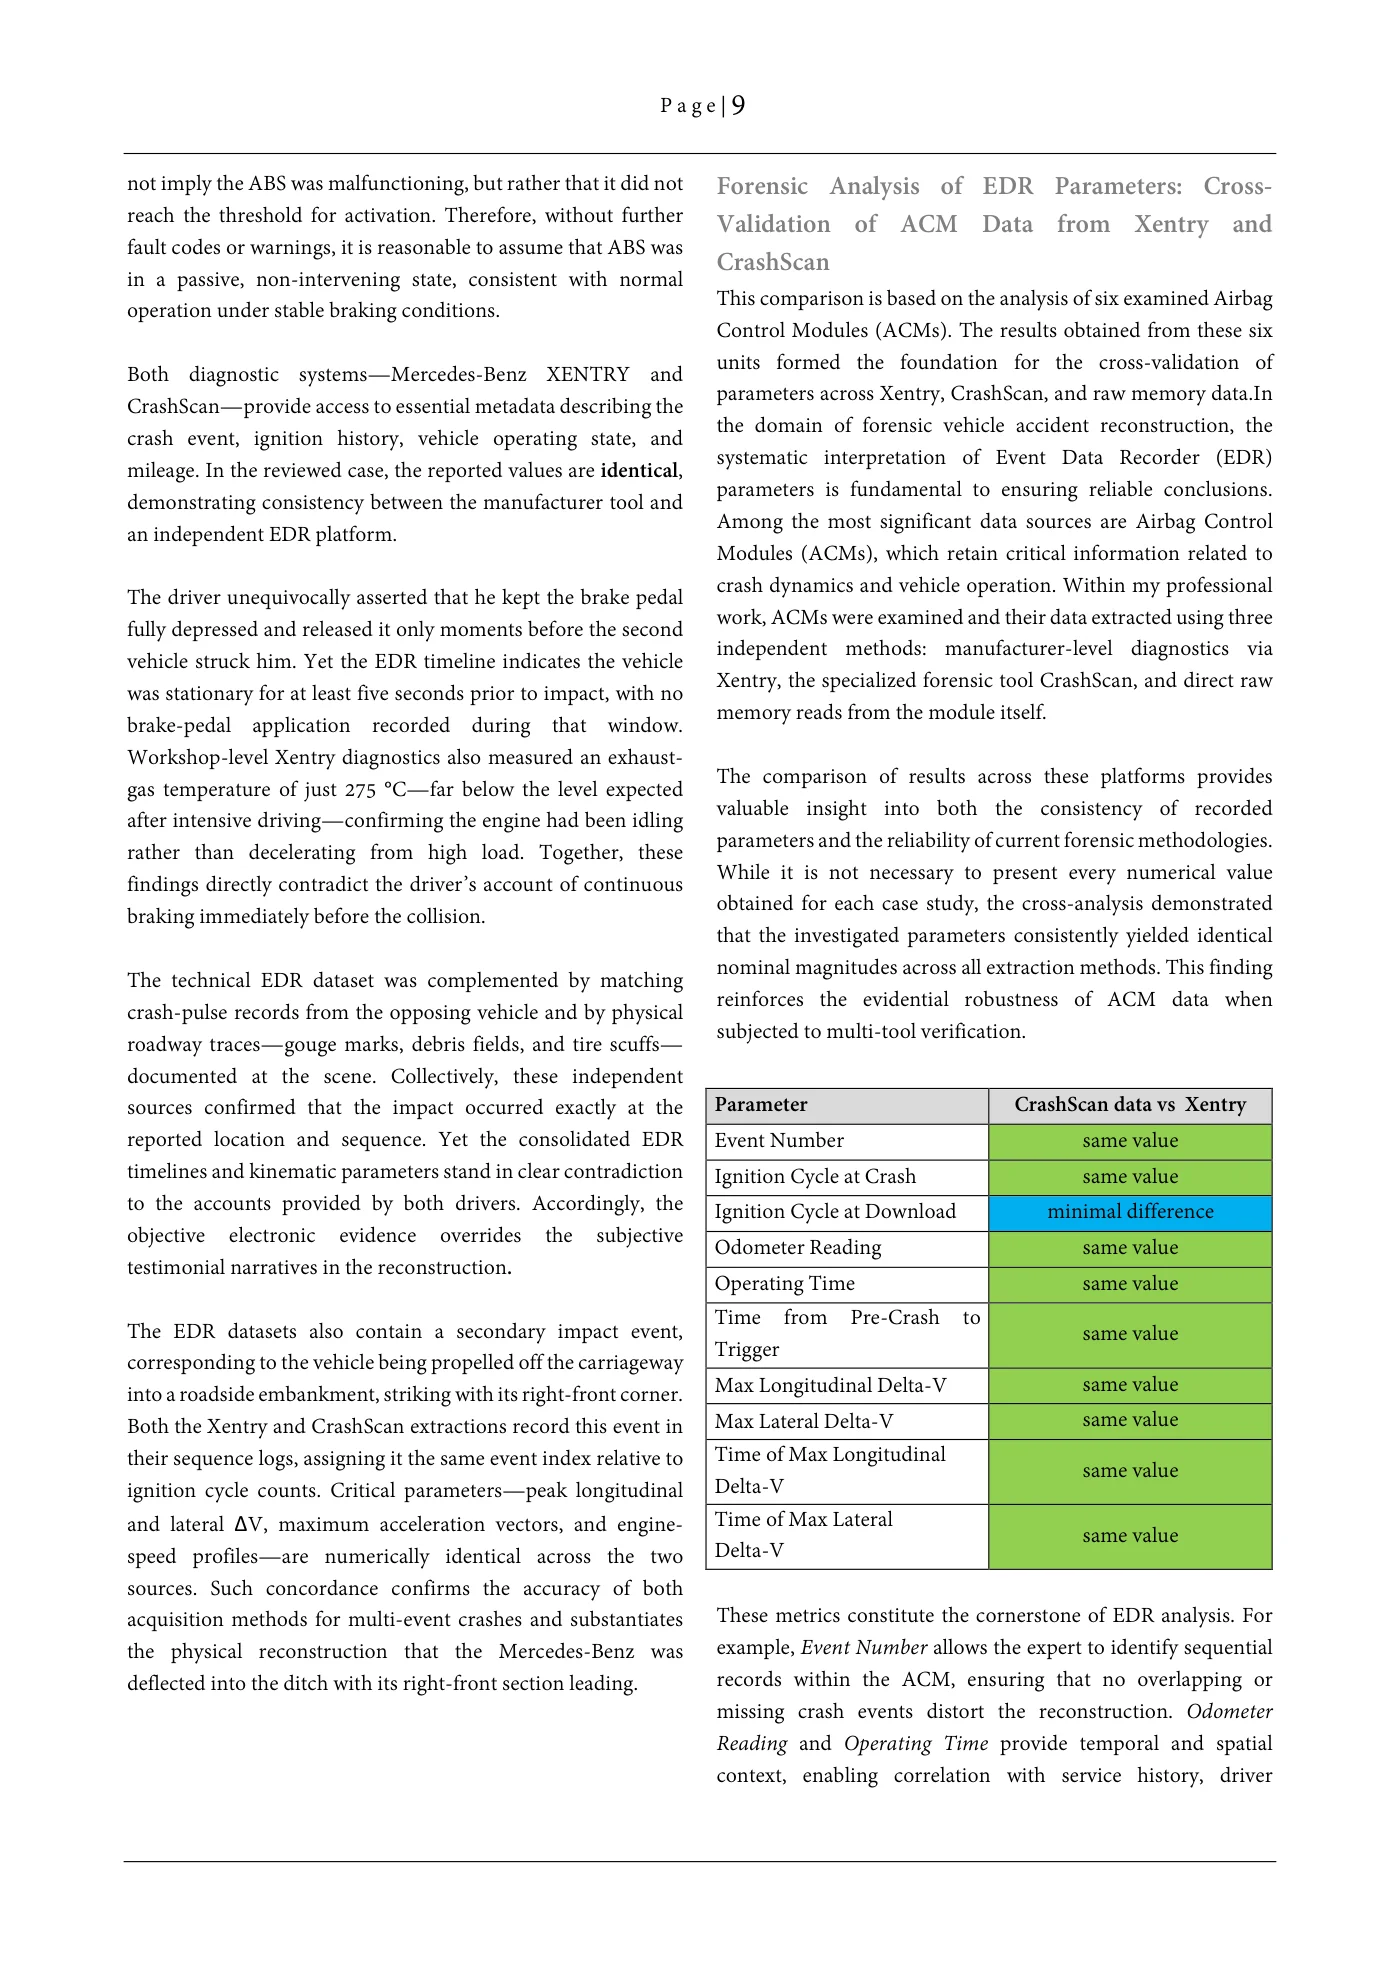
P a g e | 9 not imply the ABS was malfunctioning, but rather that it did not Forensic Analysis of EDR Parameters: Cross- reach the threshold for activation. Therefore, without further Validation of ACM Data from Xentry and fault codes or warnings, it is reasonable to assume that ABS was CrashScanin a passive, non-intervening state, consistent with normal This comparison is based on the analysis of six examined Airbagoperation under stable braking conditions. Control Modules (ACMs). The results obtained from these six units formed the foundation for the cross-validation ofBoth diagnostic systems—Mercedes-Benz XENTRY and parameters across Xentry, CrashScan, and raw memory data.InCrashScan—provide access to essential metadata describing the the domain of forensic vehicle accident reconstruction, thecrash event, ignition history, vehicle operating state, and systematic interpretation of Event Data Recorder (EDR)mileage. In the reviewed case, the reported values are identical, parameters is fundamental to ensuring reliable conclusions.demonstrating consistency between the manufacturer tool and Among the most significant data sources are Airbag Controlan independent EDR platform. Modules (ACMs), which retain critical information related to crash dynamics and vehicle operation. Within my professionalThe driver unequivocally asserted that he kept the brake pedal work, ACMs were examined and their data extracted using threefully depressed and released it only moments before the second independent methods: manufacturer-level diagnostics viavehicle struck him. Yet the EDR timeline indicates the vehicle Xentry, the specialized forensic tool CrashScan, and direct rawwas stationary for at least five seconds prior to impact, with no memory reads from the module itself.brake-pedal application recorded during that window. Workshop-level Xentry diagnostics also measured an exhaust- The comparison of results across these platforms providesgas temperature of just 275 °C—far below the level expected valuable insight into both the consistency of recordedafter intensive driving—confirming the engine had been idling parameters and the reliability of current forensic methodologies.rather than decelerating from high load. Together, these While it is not necessary to present every numerical valuefindings directly contradict the driver’s account of continuous obtained for each case study, the cross-analysis demonstratedbraking immediately before the collision. that the investigated parameters consistently yielded identical nominal magnitudes across all extraction methods. This findingThe technical EDR dataset was complemented by matching reinforces the evidential robustness of ACM data whencrash-pulse records from the opposing vehicle and by physical subjected to multi-tool verification.roadway traces—gouge marks, debris fields, and tire scuffs— documented at the scene. Collectively, these independent sources confirmed that the impact occurred exactly at the Parameter CrashScan data vs Xentry reported location and sequence. Yet the consolidated EDR Event Number same value timelines and kinematic parameters stand in clear contradiction Ignition Cycle at Crash same value to the accounts provided by both drivers. Accordingly, the Ignition Cycle at Download minimal difference objective electronic evidence overrides the subjective Odometer Reading same value testimonial narratives in the reconstruction. Operating Time same value Time from Pre-Crash toThe EDR datasets also contain a secondary impact event, same value Triggercorresponding to the vehicle being propelled off the carriageway Max Longitudinal Delta-V same valueinto a roadside embankment, striking with its right-front corner. Both the Xentry and CrashScan extractions record this event in Max Lateral Delta-V same value their sequence logs, assigning it the same event index relative to Time of Max Longitudinal same value ignition cycle counts. Critical parameters—peak longitudinal Delta-V and lateral ΔV, maximum acceleration vectors, and engine- Time of Max Lateral same value speed profiles—are numerically identical across the two Delta-V sources. Such concordance confirms the accuracy of both acquisition methods for multi-event crashes and substantiates These metrics constitute the cornerstone of EDR analysis. For the physical reconstruction that the Mercedes-Benz was example, Event Number allows the expert to identify sequential deflected into the ditch with its right-front section leading. records within the ACM, ensuring that no overlapping or missing crash events distort the reconstruction. Odometer Reading and Operating Time provide temporal and spatial context, enabling correlation with service history, driver
Source page 10
Read page 10 extracted text
Extracted text may not preserve table columns. Refer to the page image or original PDF for data relationships.
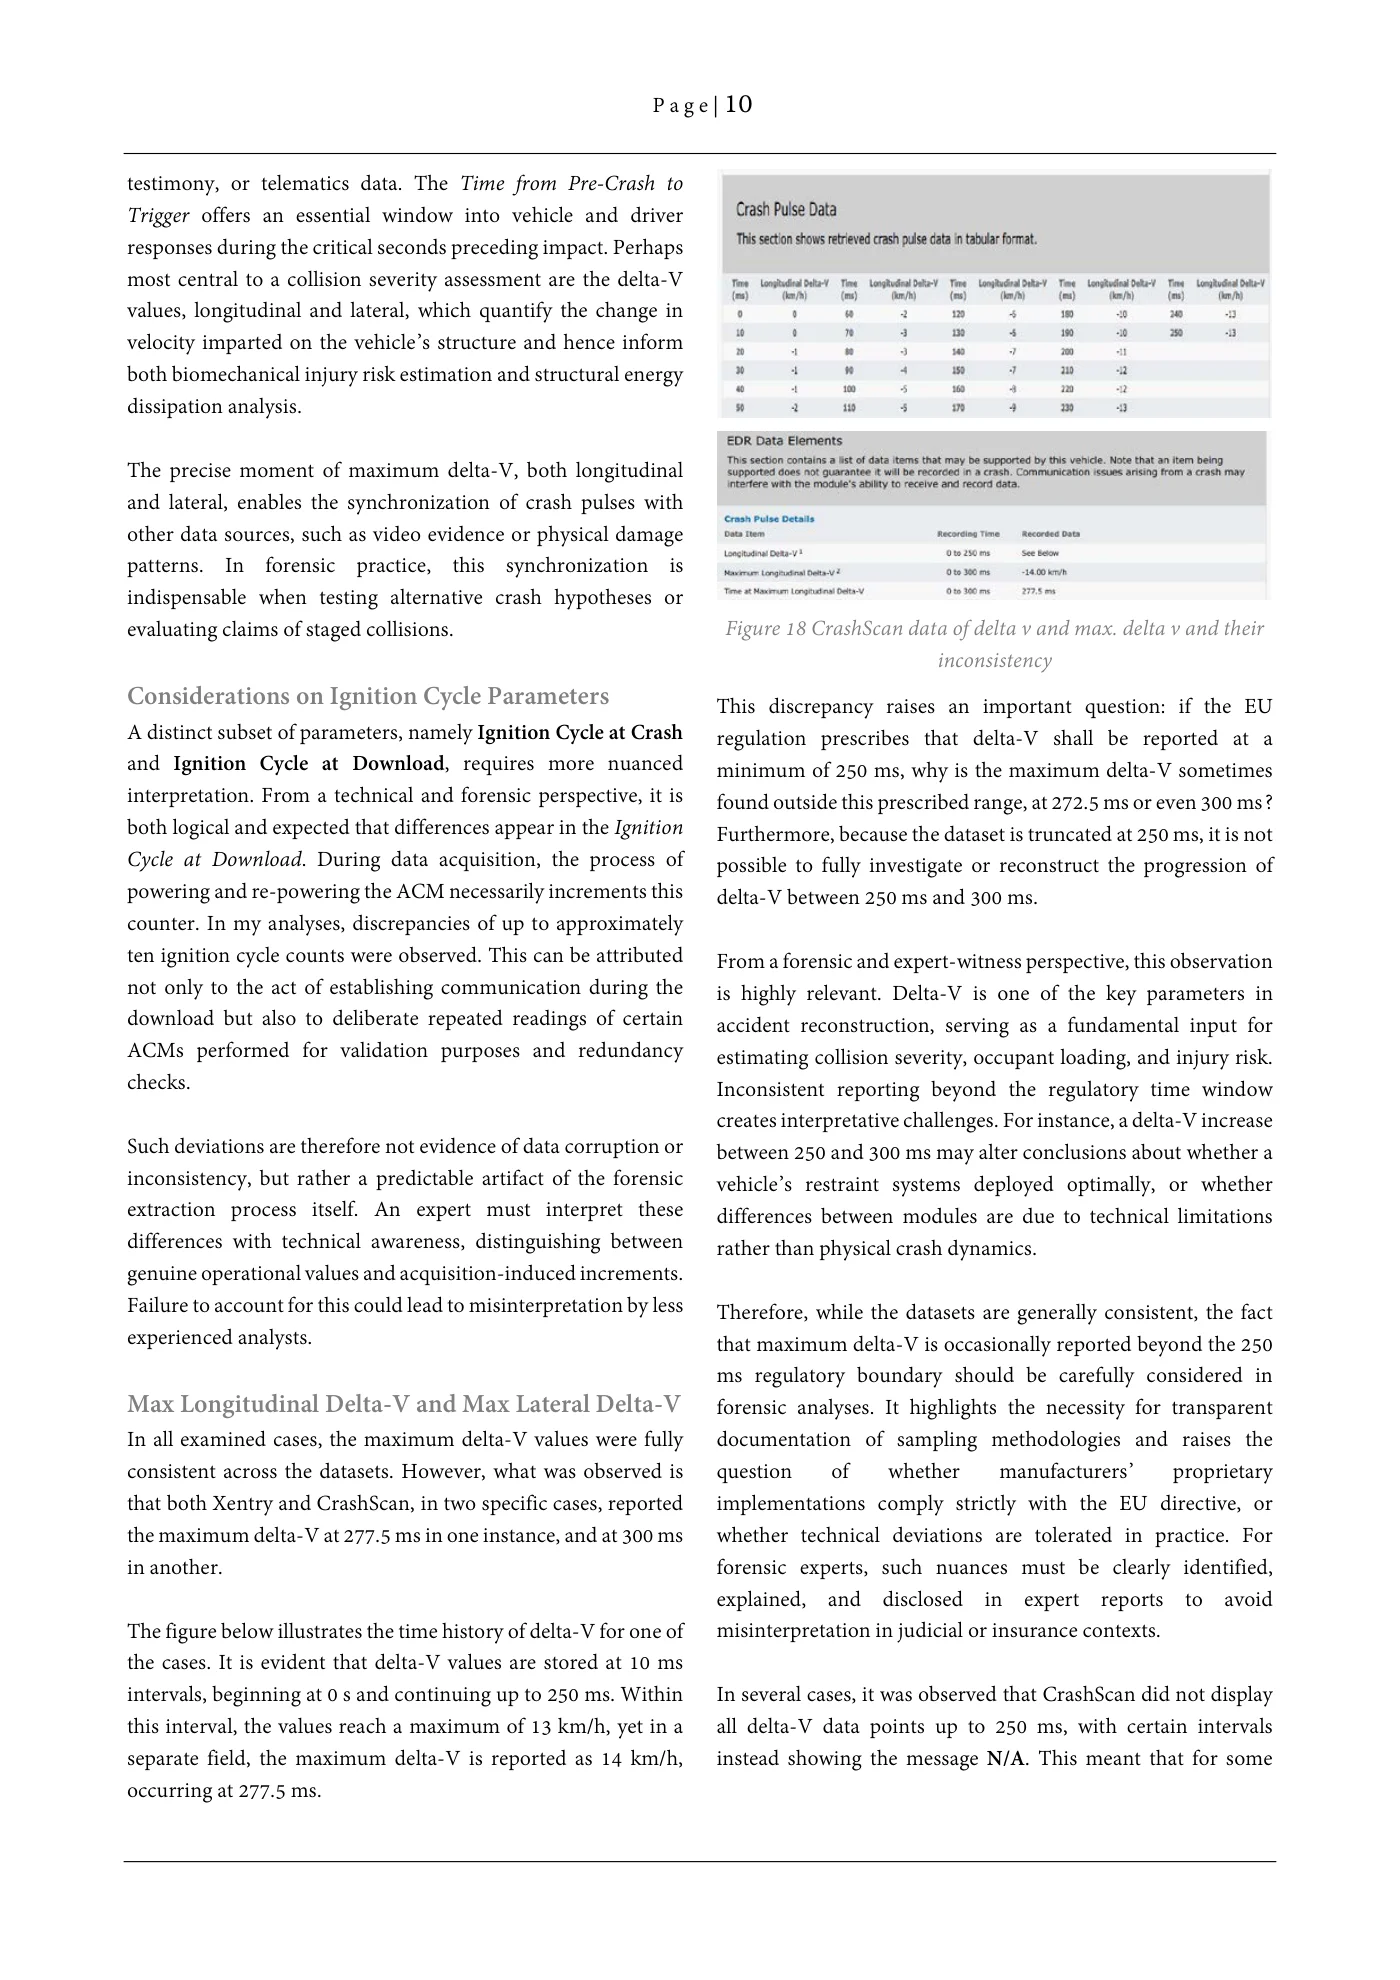
P a g e | 10 testimony, or telematics data. The Time from Pre-Crash to Trigger offers an essential window into vehicle and driver responses during the critical seconds preceding impact. Perhaps most central to a collision severity assessment are the delta-V values, longitudinal and lateral, which quantify the change in velocity imparted on the vehicle’s structure and hence inform both biomechanical injury risk estimation and structural energy dissipation analysis. The precise moment of maximum delta-V, both longitudinal and lateral, enables the synchronization of crash pulses with other data sources, such as video evidence or physical damage patterns. In forensic practice, this synchronization is indispensable when testing alternative crash hypotheses or evaluating claims of staged collisions. Figure 18 CrashScan data of delta v and max. delta v and their inconsistency Considerations on Ignition Cycle Parameters This discrepancy raises an important question: if the EU A distinct subset of parameters, namely Ignition Cycle at Crash regulation prescribes that delta-V shall be reported at a and Ignition Cycle at Download, requires more nuanced minimum of 250 ms, why is the maximum delta-V sometimes interpretation. From a technical and forensic perspective, it is found outside this prescribed range, at 272.5 ms or even 300 ms? both logical and expected that differences appear in the Ignition Furthermore, because the dataset is truncated at 250 ms, it is not Cycle at Download. During data acquisition, the process of possible to fully investigate or reconstruct the progression of powering and re-powering the ACM necessarily increments this delta-V between 250 ms and 300 ms. counter. In my analyses, discrepancies of up to approximately ten ignition cycle counts were observed. This can be attributed From a forensic and expert-witness perspective, this observation not only to the act of establishing communication during the is highly relevant. Delta-V is one of the key parameters in download but also to deliberate repeated readings of certain accident reconstruction, serving as a fundamental input for ACMs performed for validation purposes and redundancy estimating collision severity, occupant loading, and injury risk. checks. Inconsistent reporting beyond the regulatory time window creates interpretative challenges. For instance, a delta-V increase Such deviations are therefore not evidence of data corruption or between 250 and 300 ms may alter conclusions about whether a inconsistency, but rather a predictable artifact of the forensic vehicle’s restraint systems deployed optimally, or whether extraction process itself. An expert must interpret these differences between modules are due to technical limitations differences with technical awareness, distinguishing between rather than physical crash dynamics. genuine operational values and acquisition-induced increments. Failure to account for this could lead to misinterpretation by less Therefore, while the datasets are generally consistent, the fact experienced analysts. that maximum delta-V is occasionally reported beyond the 250 ms regulatory boundary should be carefully considered in Max Longitudinal Delta-V and Max Lateral Delta-V forensic analyses. It highlights the necessity for transparent In all examined cases, the maximum delta-V values were fully documentation of sampling methodologies and raises the consistent across the datasets. However, what was observed is question of whether manufacturers’ proprietary that both Xentry and CrashScan, in two specific cases, reported implementations comply strictly with the EU directive, or the maximum delta-V at 277.5 ms in one instance, and at 300 ms whether technical deviations are tolerated in practice. For in another. forensic experts, such nuances must be clearly identified, explained, and disclosed in expert reports to avoid The figure below illustrates the time history of delta-V for one of misinterpretation in judicial or insurance contexts. the cases. It is evident that delta-V values are stored at 10 ms intervals, beginning at 0 s and continuing up to 250 ms. Within In several cases, it was observed that CrashScan did not display this interval, the values reach a maximum of 13 km/h, yet in a all delta-V data points up to 250 ms, with certain intervals separate field, the maximum delta-V is reported as 14 km/h, instead showing the message N/A. This meant that for some occurring at 277.5 ms.
Source page 11
Read page 11 extracted text
Extracted text may not preserve table columns. Refer to the page image or original PDF for data relationships.
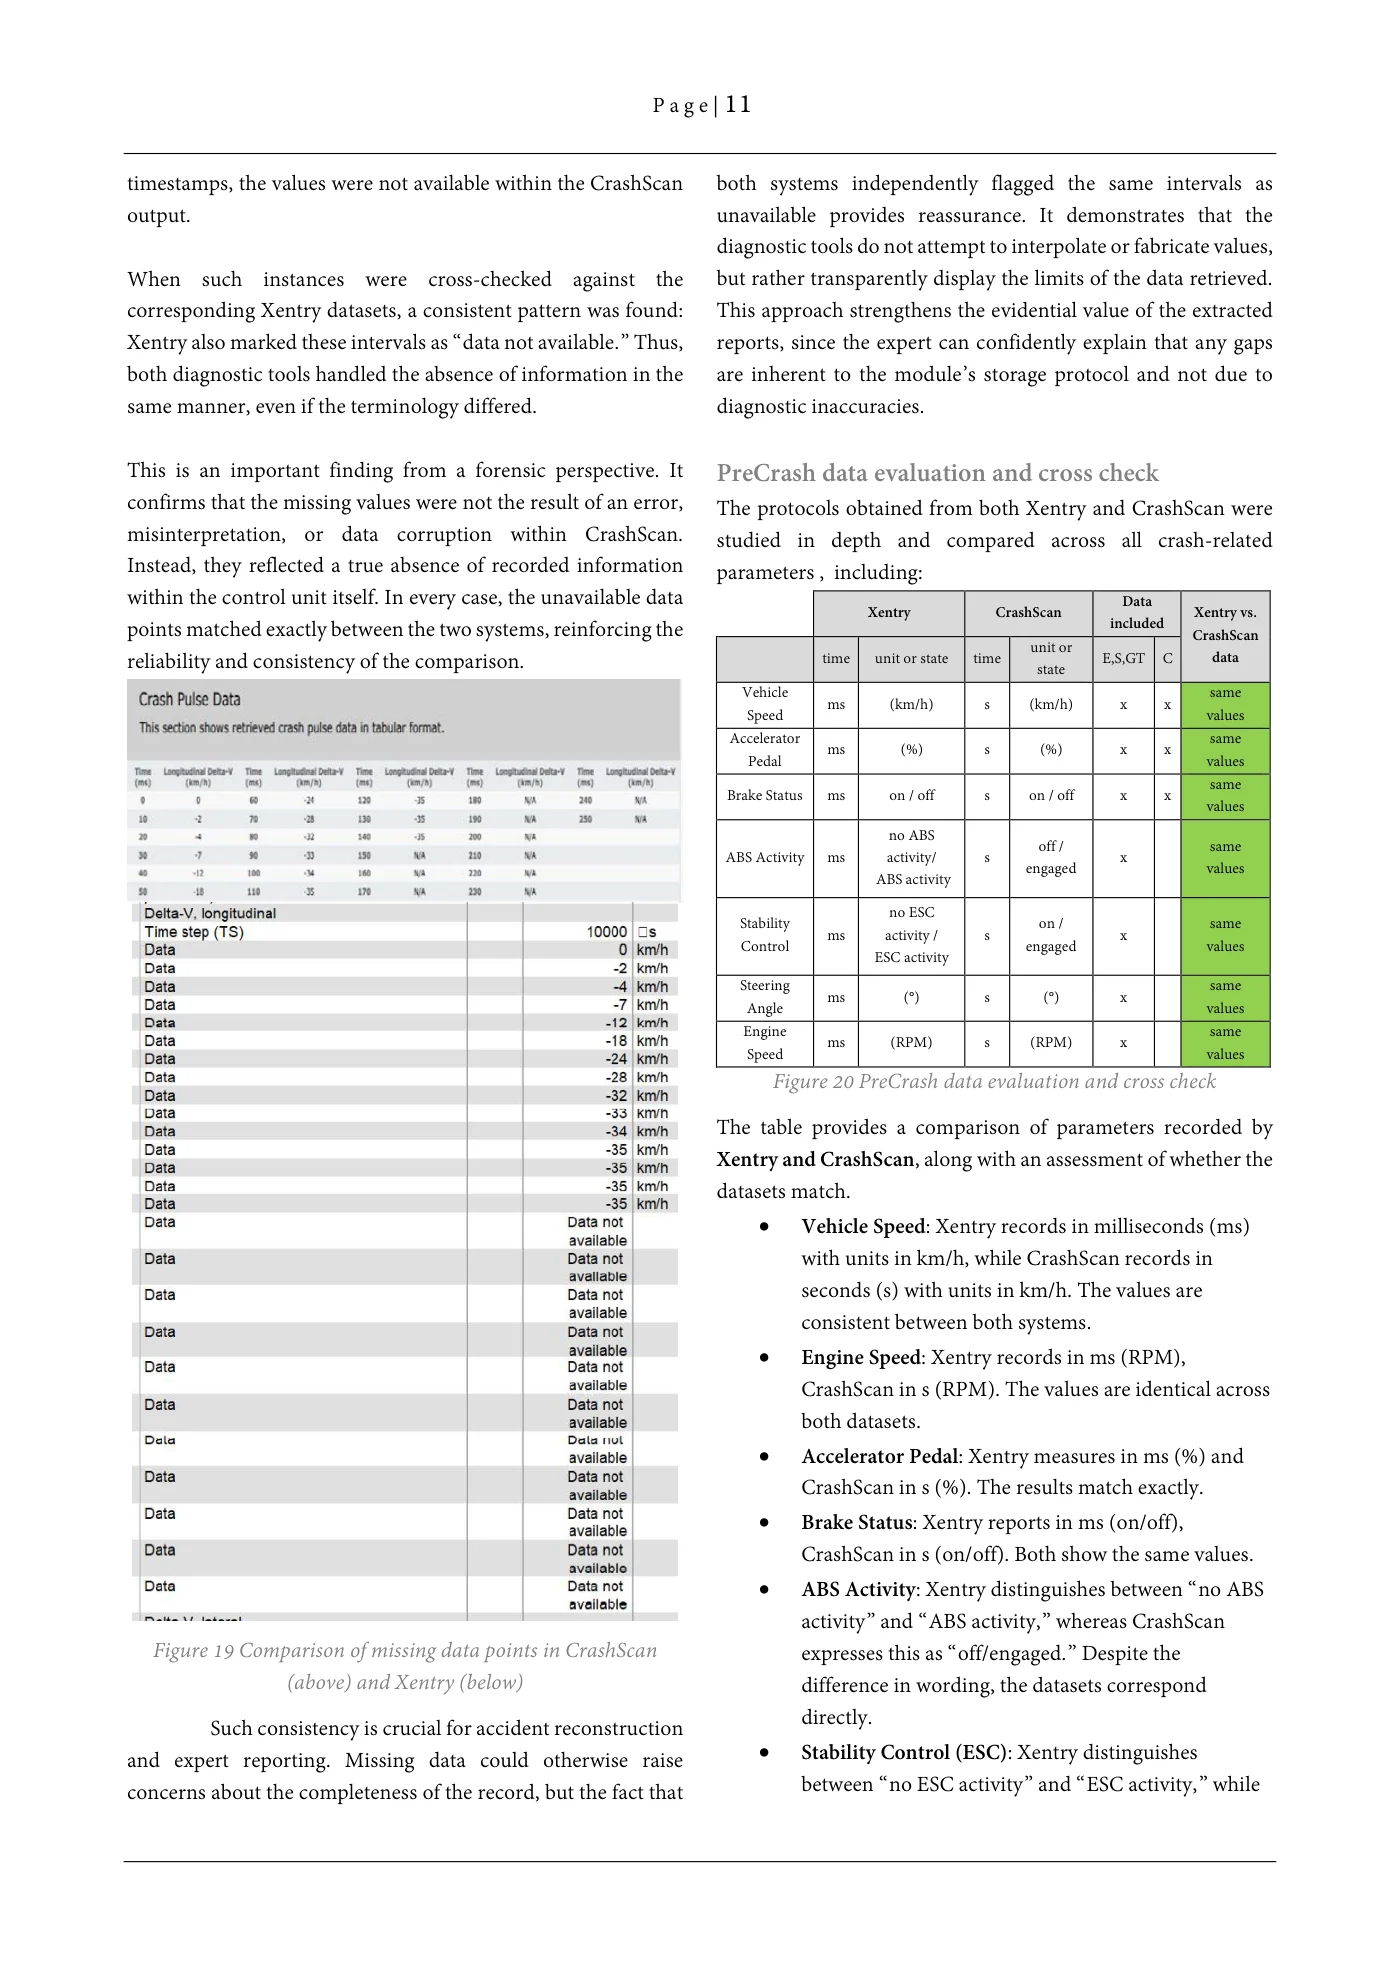
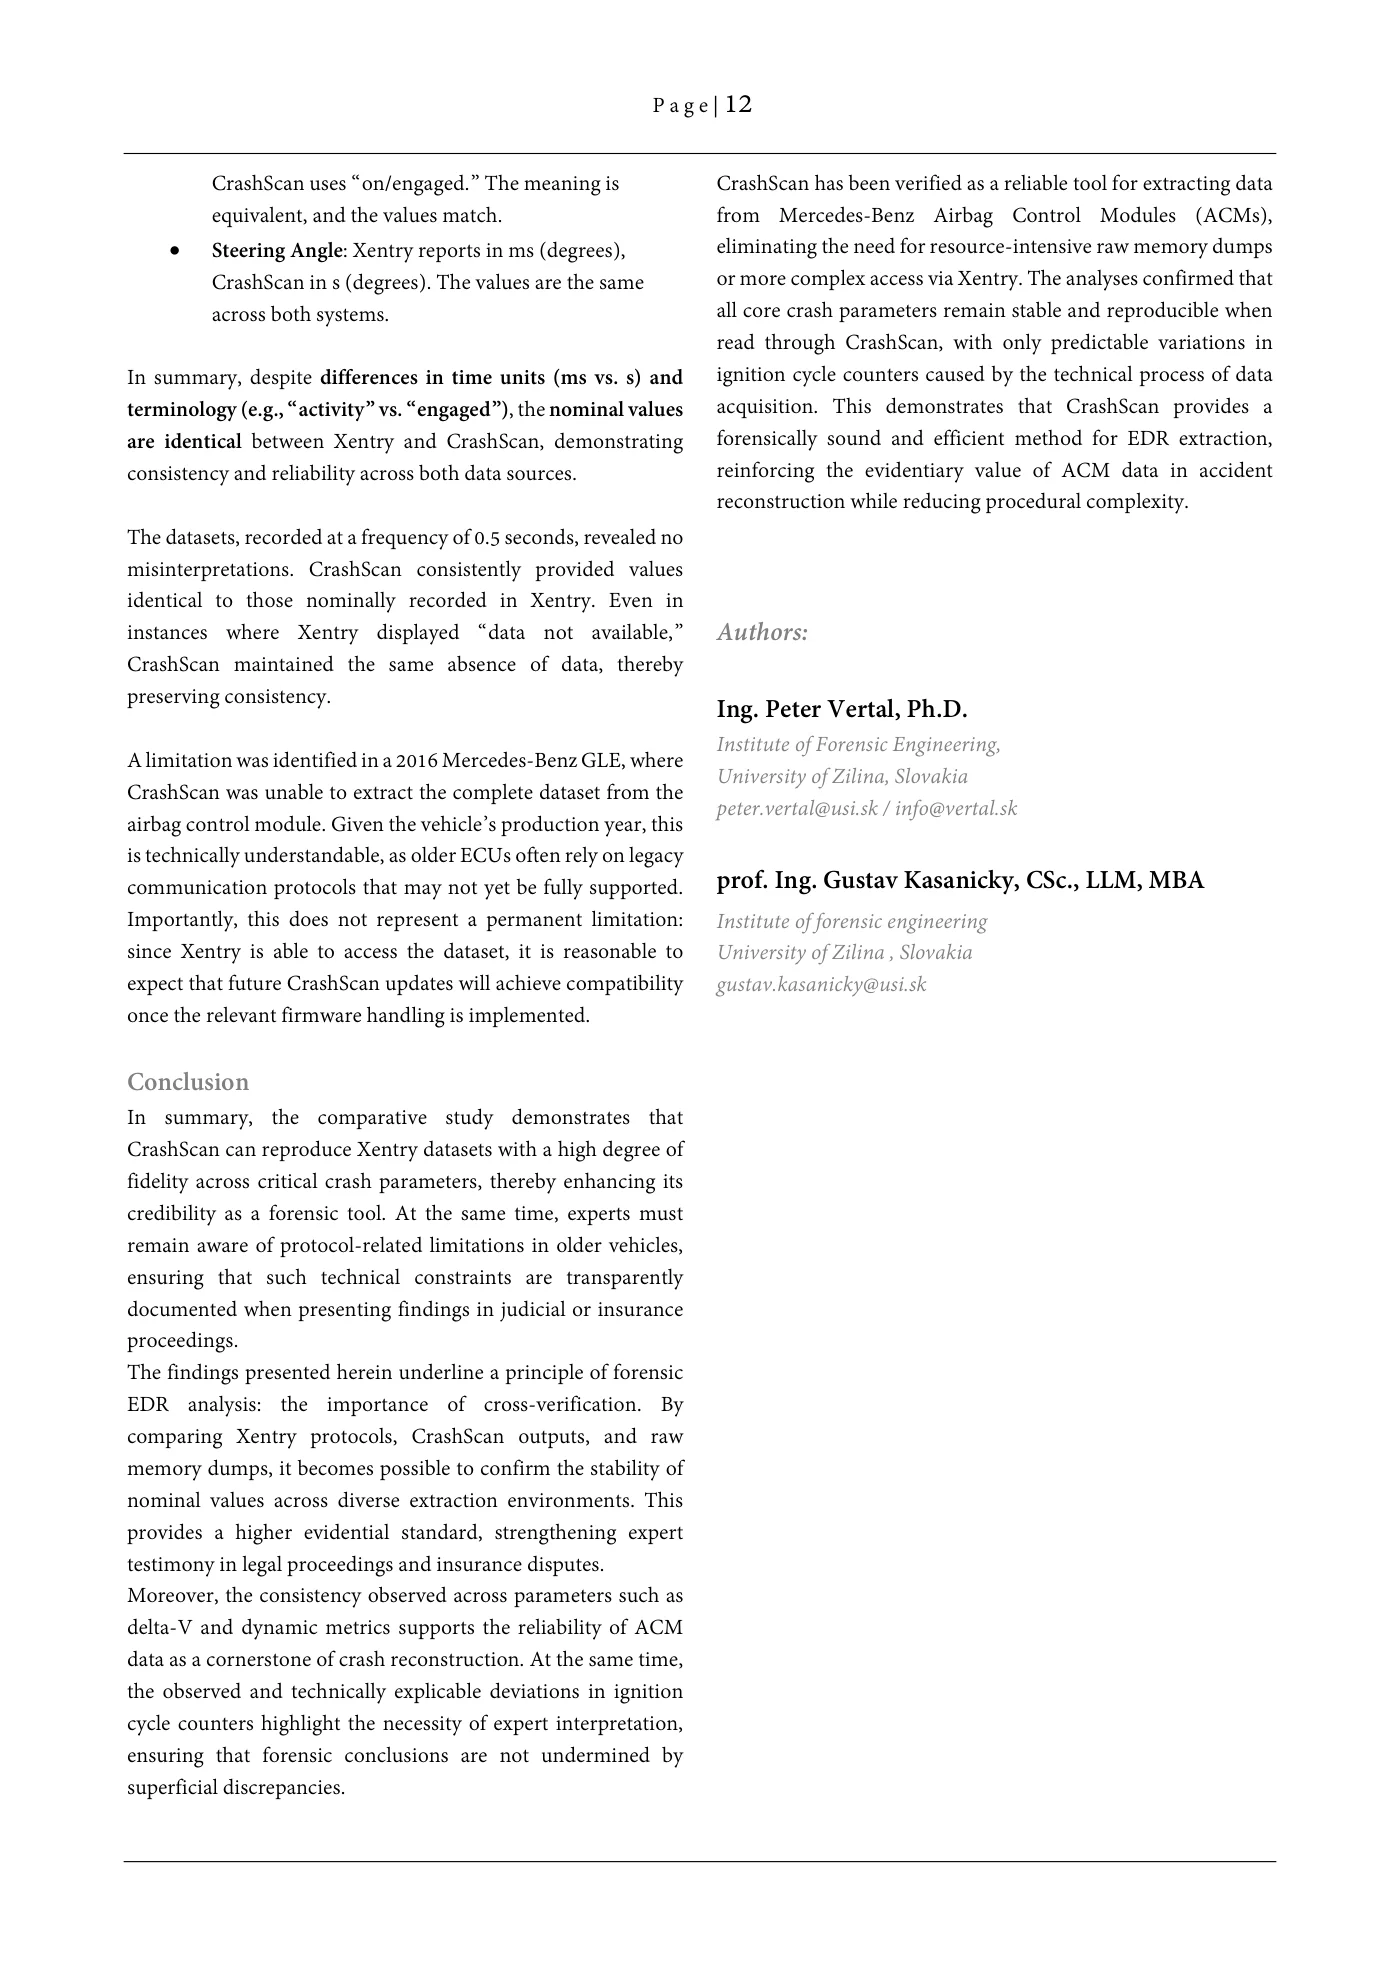
P a g e | 11 timestamps, the values were not available within the CrashScan both systems independently flagged the same intervals as output. unavailable provides reassurance. It demonstrates that the diagnostic tools do not attempt to interpolate or fabricate values, When such instances were cross-checked against the but rather transparently display the limits of the data retrieved. corresponding Xentry datasets, a consistent pattern was found: This approach strengthens the evidential value of the extracted Xentry also marked these intervals as “data not available.” Thus, reports, since the expert can confidently explain that any gaps both diagnostic tools handled the absence of information in the are inherent to the module’s storage protocol and not due to same manner, even if the terminology differed. diagnostic inaccuracies. This is an important finding from a forensic perspective. It PreCrash data evaluation and cross check confirms that the missing values were not the result of an error, The protocols obtained from both Xentry and CrashScan were misinterpretation, or data corruption within CrashScan. studied in depth and compared across all crash-related Instead, they reflected a true absence of recorded information parameters , including: within the control unit itself. In every case, the unavailable data Data Xentry CrashScan Xentry vs. points matched exactly between the two systems, reinforcing the included CrashScan unit or reliability and consistency of the comparison. time unit or state time state E,S,GT C data Vehicle same ms (km/h) s (km/h) x x Speed values Accelerator same ms (%) s (%) x x Pedal values same Brake Status ms on / off s on / off x x values no ABS off / same ABS Activity ms activity/ s x engaged values ABS activity no ESC Stability on / same ms activity / s x Control engaged values ESC activity Steering same ms (°) s (°) x Angle values Engine same ms (RPM) s (RPM) x Speed values Figure 20 PreCrash data evaluation and cross check The table provides a comparison of parameters recorded by Xentry and CrashScan, along with an assessment of whether the datasets match. • Vehicle Speed: Xentry records in milliseconds (ms) with units in km/h, while CrashScan records in seconds (s) with units in km/h. The values are consistent between both systems. • Engine Speed: Xentry records in ms (RPM), CrashScan in s (RPM). The values are identical across both datasets. • Accelerator Pedal: Xentry measures in ms (%) and CrashScan in s (%). The results match exactly. • Brake Status: Xentry reports in ms (on/off), CrashScan in s (on/off). Both show the same values. • ABS Activity: Xentry distinguishes between “no ABS activity” and “ABS activity,” whereas CrashScan Figure 19 Comparison of missing data points in CrashScan expresses this as “off/engaged.” Despite the (above) and Xentry (below) difference in wording, the datasets correspond directly. Such consistency is crucial for accident reconstruction • Stability Control (ESC): Xentry distinguishesand expert reporting. Missing data could otherwise raise between “no ESC activity” and “ESC activity,” whileconcerns about the completeness of the record, but the fact that
Source page 12
Read page 12 extracted text
Extracted text may not preserve table columns. Refer to the page image or original PDF for data relationships.
P a g e | 12 CrashScan uses “on/engaged.” The meaning is CrashScan has been verified as a reliable tool for extracting data equivalent, and the values match. from Mercedes-Benz Airbag Control Modules (ACMs), • Steering Angle: Xentry reports in ms (degrees), eliminating the need for resource-intensive raw memory dumps CrashScan in s (degrees). The values are the same or more complex access via Xentry. The analyses confirmed that across both systems. all core crash parameters remain stable and reproducible when read through CrashScan, with only predictable variations in In summary, despite differences in time units (ms vs. s) and ignition cycle counters caused by the technical process of data terminology (e.g., “activity” vs. “engaged”), the nominal values acquisition. This demonstrates that CrashScan provides a are identical between Xentry and CrashScan, demonstrating forensically sound and efficient method for EDR extraction, consistency and reliability across both data sources. reinforcing the evidentiary value of ACM data in accident reconstruction while reducing procedural complexity. The datasets, recorded at a frequency of 0.5 seconds, revealed no misinterpretations. CrashScan consistently provided values identical to those nominally recorded in Xentry. Even in instances where Xentry displayed “data not available,” Authors: CrashScan maintained the same absence of data, thereby preserving consistency. Ing. Peter Vertal, Ph.D. Institute of Forensic Engineering, A limitation was identified in a 2016 Mercedes-Benz GLE, where University of Zilina, Slovakia CrashScan was unable to extract the complete dataset from the peter.vertal@usi.sk / info@vertal.sk airbag control module. Given the vehicle’s production year, this is technically understandable, as older ECUs often rely on legacy communication protocols that may not yet be fully supported. prof. Ing. Gustav Kasanicky, CSc., LLM, MBA Importantly, this does not represent a permanent limitation: Institute of forensic engineering since Xentry is able to access the dataset, it is reasonable to University of Zilina , Slovakia expect that future CrashScan updates will achieve compatibility gustav.kasanicky@usi.sk once the relevant firmware handling is implemented. Conclusion In summary, the comparative study demonstrates that CrashScan can reproduce Xentry datasets with a high degree of fidelity across critical crash parameters, thereby enhancing its credibility as a forensic tool. At the same time, experts must remain aware of protocol-related limitations in older vehicles, ensuring that such technical constraints are transparently documented when presenting findings in judicial or insurance proceedings. The findings presented herein underline a principle of forensic EDR analysis: the importance of cross-verification. By comparing Xentry protocols, CrashScan outputs, and raw memory dumps, it becomes possible to confirm the stability of nominal values across diverse extraction environments. This provides a higher evidential standard, strengthening expert testimony in legal proceedings and insurance disputes. Moreover, the consistency observed across parameters such as delta-V and dynamic metrics supports the reliability of ACM data as a cornerstone of crash reconstruction. At the same time, the observed and technically explicable deviations in ignition cycle counters highlight the necessity of expert interpretation, ensuring that forensic conclusions are not undermined by superficial discrepancies.