Controlled crash-test validation of event data recorder retrieval
Comparison of CrashScan EDR Outputs with Instrumented Vehicle Dynamics in the DSD 2026 Test Series Jason M. Bayley, P.Eng., MBA
Collision Sciences Inc.
Scientific Technical Paper | September 2026
ABSTRACT This paper presents a quantitative validation analysis of the DSD 2026 controlled crash-test series conducted in Austria, with emphasis on Event Data Recorder (EDR) retrieval using Collision Sciences CrashScan. The dataset combines controlled test configurations, DSD RPiDaq instrumentation, GPS, multi-axis acceleration and angular-rate measurement, video, PC-Crash project files, Bosch CDR/ACM reports and CrashScan case records. For DSD Test 02, CrashScan and Bosch CDR exhibit near-identity across 45 directly comparable Toyota 02EDR longitudinal delta-V samples (MAE 0.024 km/h; RMSE 0.028 km/h; maximum absolute difference 0.05 km/h).
Native DSD DAQ workbooks for Tests 02 through 07 were additionally analyzed directly. Eleven vehicle datasets are sampled at 500 Hz and provide synchronized multi-axis acceleration, integrated velocity change, displacement, angular motion and GPS channels. In the repeated Toyota series, the moving Yaris produced resultant measured delta-V values of 15.31 and 15.10 km/h in Tests 04 and 05, while reversal of the moving/stationary roles produced measured Auris resultants of 8.59 and 13.35 km/h in Tests 06 and 07.
The results support both decoder equivalence and independent physical-event validation while illustrating the importance of collision geometry, sensor axes and event-definition differences when comparing EDR and external instrumentation.
Keywords: event data recorder; EDR; CrashScan; crash testing; accident reconstruction; ACM; PC-Crash; validation; forensic engineering
01 / In this resource
1. Introduction
Event data recorders have become an important source of objective information in collision investigation. Their forensic value, however, depends on more than the successful production of a report. A complete validation question includes at least three distinct layers: whether the vehicle controller recorded the physical event with sufficient fidelity, whether the stored information can be retrieved without altering or misidentifying the event record, and whether the resulting report correctly translates and presents the stored parameters for interpretation.
Controlled crash testing provides one of the strongest settings in which to examine these questions because the physical event can be documented independently through instrumentation, video, known test configuration, vehicle mass properties, and reconstruction files. The DSD 2026 dataset is particularly useful because it combines these independent sources with repeated EDR retrievals and, in several tests, paired CrashScan and ACM-source documentation.
The objective of this paper is to characterize the DSD 2026 series, quantify CrashScan–Bosch agreement where exact source values are available, evaluate those EDR outputs against independent DSD measurements, and identify the repeated tests suitable for subsequent signal-level repeatability analysis. Claims are separated by evidence class so that decoder agreement, measured physical reference data, and derived calculations are not conflated.
02 / In this resource
2. Source dataset and provenance
The test material was supplied by DSD – Dr. Steffan Datentechnik GesmbH, Linz, Austria, following its 2026 Easter seminar and crash-test program. Collision Sciences supported the program. DSD delivered the controlled crash-test archive to Collision Sciences on 20 April 2026 through source-delivery correspondence that is retained internally. The extracted Drive repository contains a dedicated DSD 2026 test hierarchy with indexed test pages in German, English, and Italian, together with test-specific files and media. The index structure identifies seven tests (Test01 through Test07). Each indexed test page includes a general test description, vehicle properties, video references, pre-collision photographs, collision photographs, post-collision photographs, and a DAQ section. PC-Crash project files are also identified. Several tests additionally link CrashScan case reports and ACM reports, creating direct report-to-test traceability.
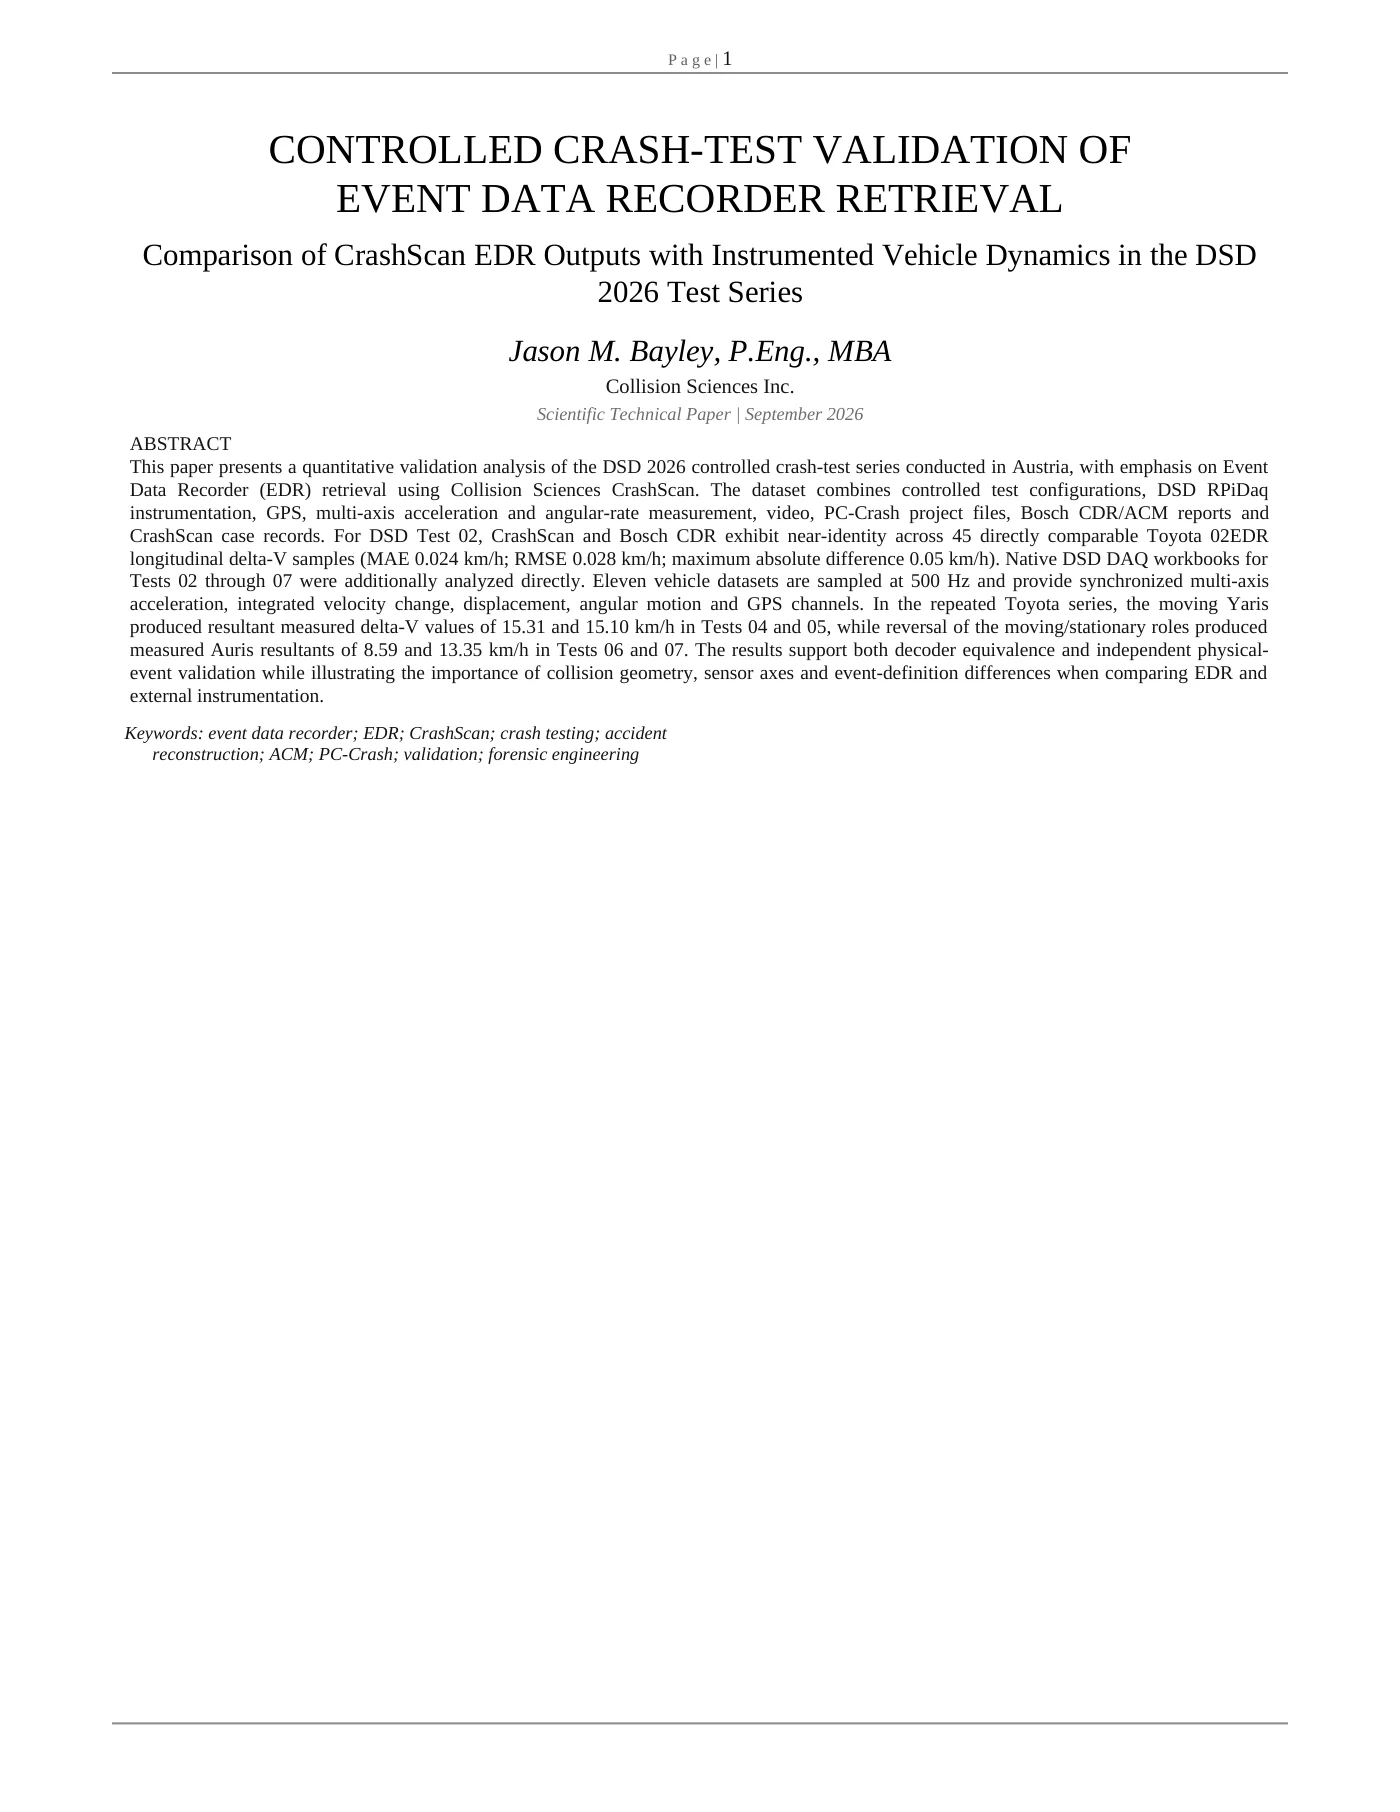
2.1. Test-site visual documentation
The DSD archive includes direct field photography from the 2026 test program. Figure 1 presents three distinct configurations from the series rather than repeated views of a single preparation scene: the Test 01 barrier impact, an aerial Test 02 test view, and the Test 04 vehicle-to-vehicle impact. These photographs provide contextual evidence of test geometry, instrumentation environment, and collision configuration; numerical EDR accuracy is evaluated separately using the underlying DAQ and event records.
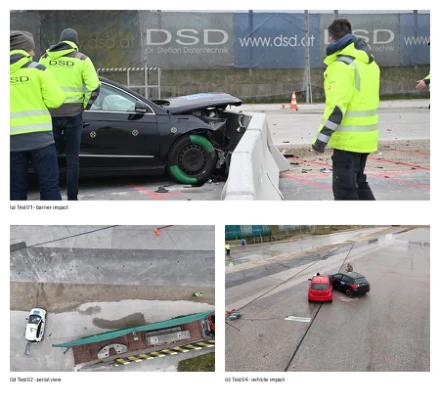
Figure 1. Representative DSD 2026 crash-test configurations: (a) Test 01 Volkswagen Passat barrier impact; (b) Test 02 aerial view of the instrumented test area; and (c) Test 04 Toyota Yaris/Toyota Auris vehicle-to-vehicle impact. Source photographs: DSD 2026 crash-test archive supplied to Collision Sciences.
03 / In this resource
3. Experimental test matrix
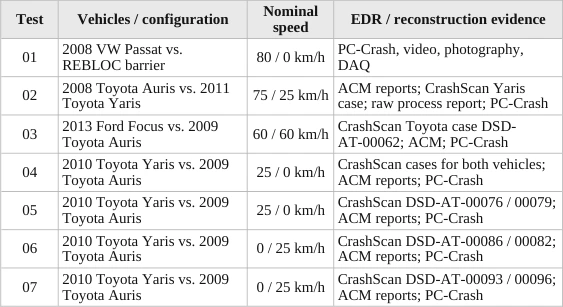
Read table as text
| Test | Vehicles / configuration | Nominal speed | EDR / reconstruction evidence |
| 01 | 2008 VW Passat vs. REBLOC barrier | 80 / 0 km/h | PC-Crash, video, photography, DAQ |
| 02 | 2008 Toyota Auris vs. 2011 Toyota Yaris | 75 / 25 km/h | ACM reports; CrashScan Yaris case; raw process report; PC-Crash |
| 03 | 2013 Ford Focus vs. 2009 Toyota Auris | 60 / 60 km/h | CrashScan Toyota case DSD- AT-00062; ACM; PC-Crash |
| 04 | 2010 Toyota Yaris vs. 2009 Toyota Auris | 25 / 0 km/h | CrashScan cases for both vehicles; ACM reports; PC-Crash |
| 05 | 2010 Toyota Yaris vs. 2009 Toyota Auris | 25 / 0 km/h | CrashScan DSD-AT-00076 / 00079; ACM reports; PC-Crash |
| 06 | 2010 Toyota Yaris vs. 2009 Toyota Auris | 0 / 25 km/h | CrashScan DSD-AT-00086 / 00082; ACM reports; PC-Crash |
| 07 | 2010 Toyota Yaris vs. 2009 Toyota Auris | 0 / 25 km/h | CrashScan DSD-AT-00093 / 00096; ACM reports; PC-Crash |
Table 1. DSD 2026 controlled crash-test matrix derived from the indexed source files.
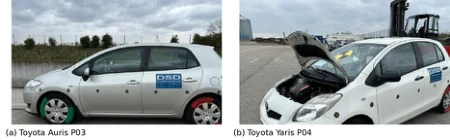
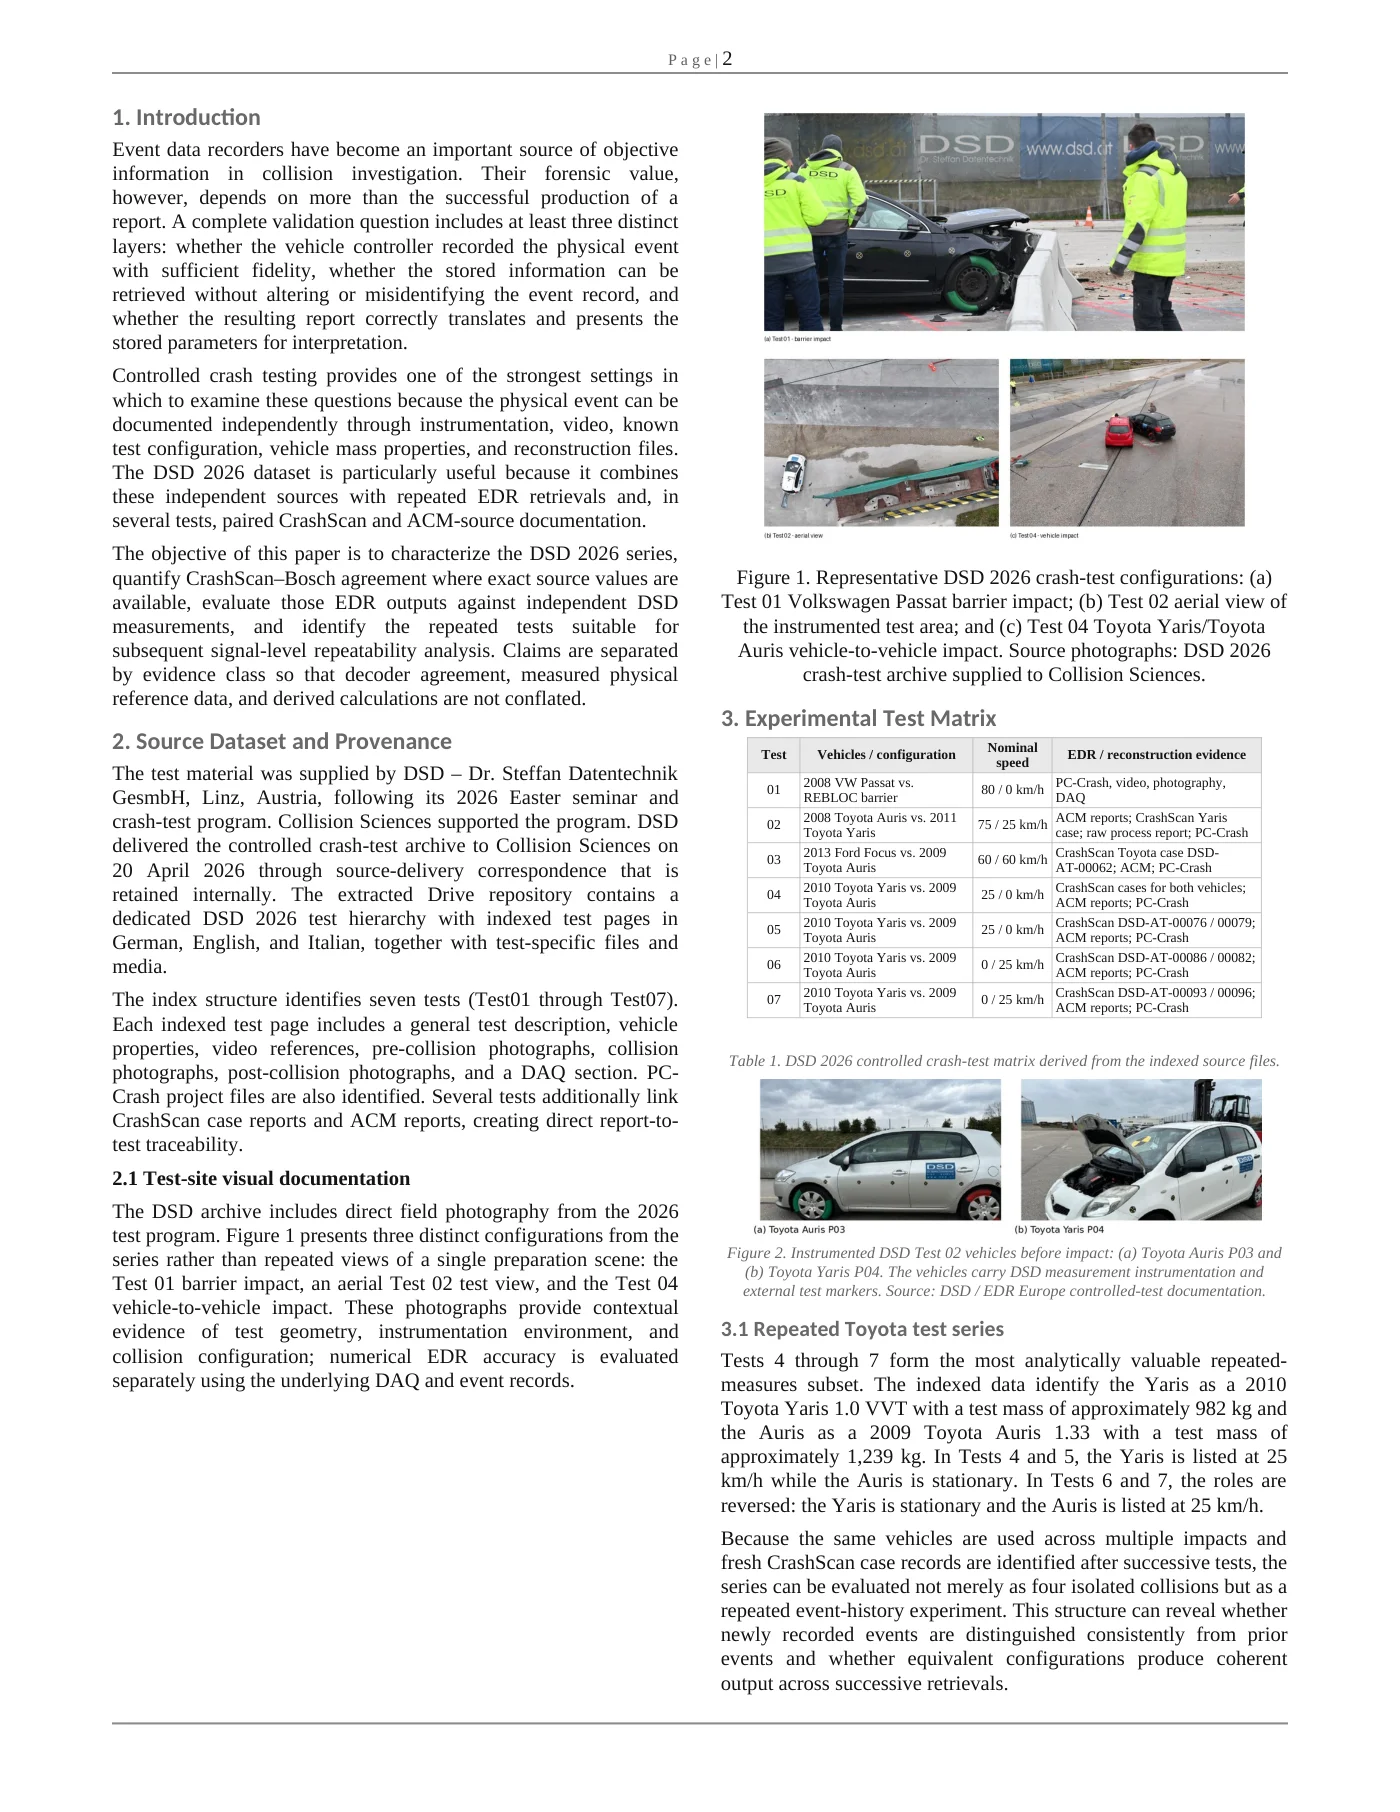
Figure 2. Instrumented DSD Test 02 vehicles before impact: (a) Toyota Auris P03 and (b) Toyota Yaris P04. The vehicles carry DSD measurement instrumentation and external test markers. Source: DSD / EDR Europe controlled-test documentation.
3.1. Repeated Toyota test series
Tests 4 through 7 form the most analytically valuable repeated-measures subset. The indexed data identify the Yaris as a 2010 Toyota Yaris 1.0 VVT with a test mass of approximately 982 kg and the Auris as a 2009 Toyota Auris 1.33 with a test mass of approximately 1,239 kg. In Tests 4 and 5, the Yaris is listed at 25 km/h while the Auris is stationary. In Tests 6 and 7, the roles are reversed: the Yaris is stationary and the Auris is listed at 25 km/h. Because the same vehicles are used across multiple impacts and fresh CrashScan case records are identified after successive tests, the series can be evaluated not merely as four isolated collisions but as a repeated event-history experiment. This structure can reveal whether newly recorded events are distinguished consistently from prior events and whether equivalent configurations produce coherent output across successive retrievals.
04 / In this resource
4. Forensic validation framework
4.1. Three distinct validation layers
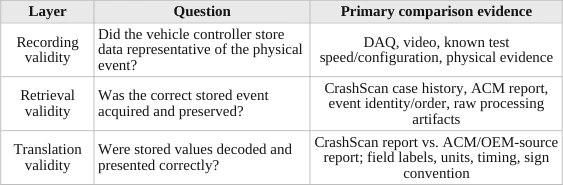
Read table as text
| Layer | Question | Primary comparison evidence |
| Recording validity | Did the vehicle controller store data representative of the physical event? | DAQ, video, known test speed/configuration, physical evidence |
| Retrieval validity | Was the correct stored event acquired and preserved? | CrashScan case history, ACM report, event identity/order, raw processing artifacts |
| Translation validity | Were stored values decoded and presented correctly? | CrashScan report vs. ACM/OEM-source report; field labels, units, timing, sign convention |
Table 2. Separation of recording, retrieval, and translation validation questions.
4.2. Comparison methodology
For each vehicle/event with adequate source data, the preferred analysis is to establish a common event timeline and compare like-for-like quantities. Recorded speed samples should be compared with independently established vehicle speed at corresponding times where the timing basis permits. Longitudinal and lateral acceleration signals should be assessed for axis convention, polarity, sampling interval, filtering, clipping, and event trigger alignment. Integrated delta-V should be compared only after confirming integration limits and the relationship between the EDR event clock and physical first contact. Any numerical comparison should report absolute difference, percentage difference where meaningful, temporal offset where determinable, and the uncertainty or resolution associated with both the reference measurement and the EDR parameter. A visually similar curve is not, by itself, a quantitative validation result; the comparison must retain source units, sample timing, and the applicable data limitations.
05 / In this resource
5. Quantitative results
The DSD 2026 archive supports three complementary quantitative analyses. First, native DSD DAQ workbooks characterize the physical crash response at 500 Hz. Second, Test 02 permits a direct Bosch CDR–CrashScan comparison of the same Toyota 02EDR records. Third, the repeated Tests 04–07 provide a same-vehicle series in which the moving/stationary roles are reversed and the independently measured velocity changes can be compared across successive impacts.
5.1. Native DSD instrumentation — test 01 barrier event
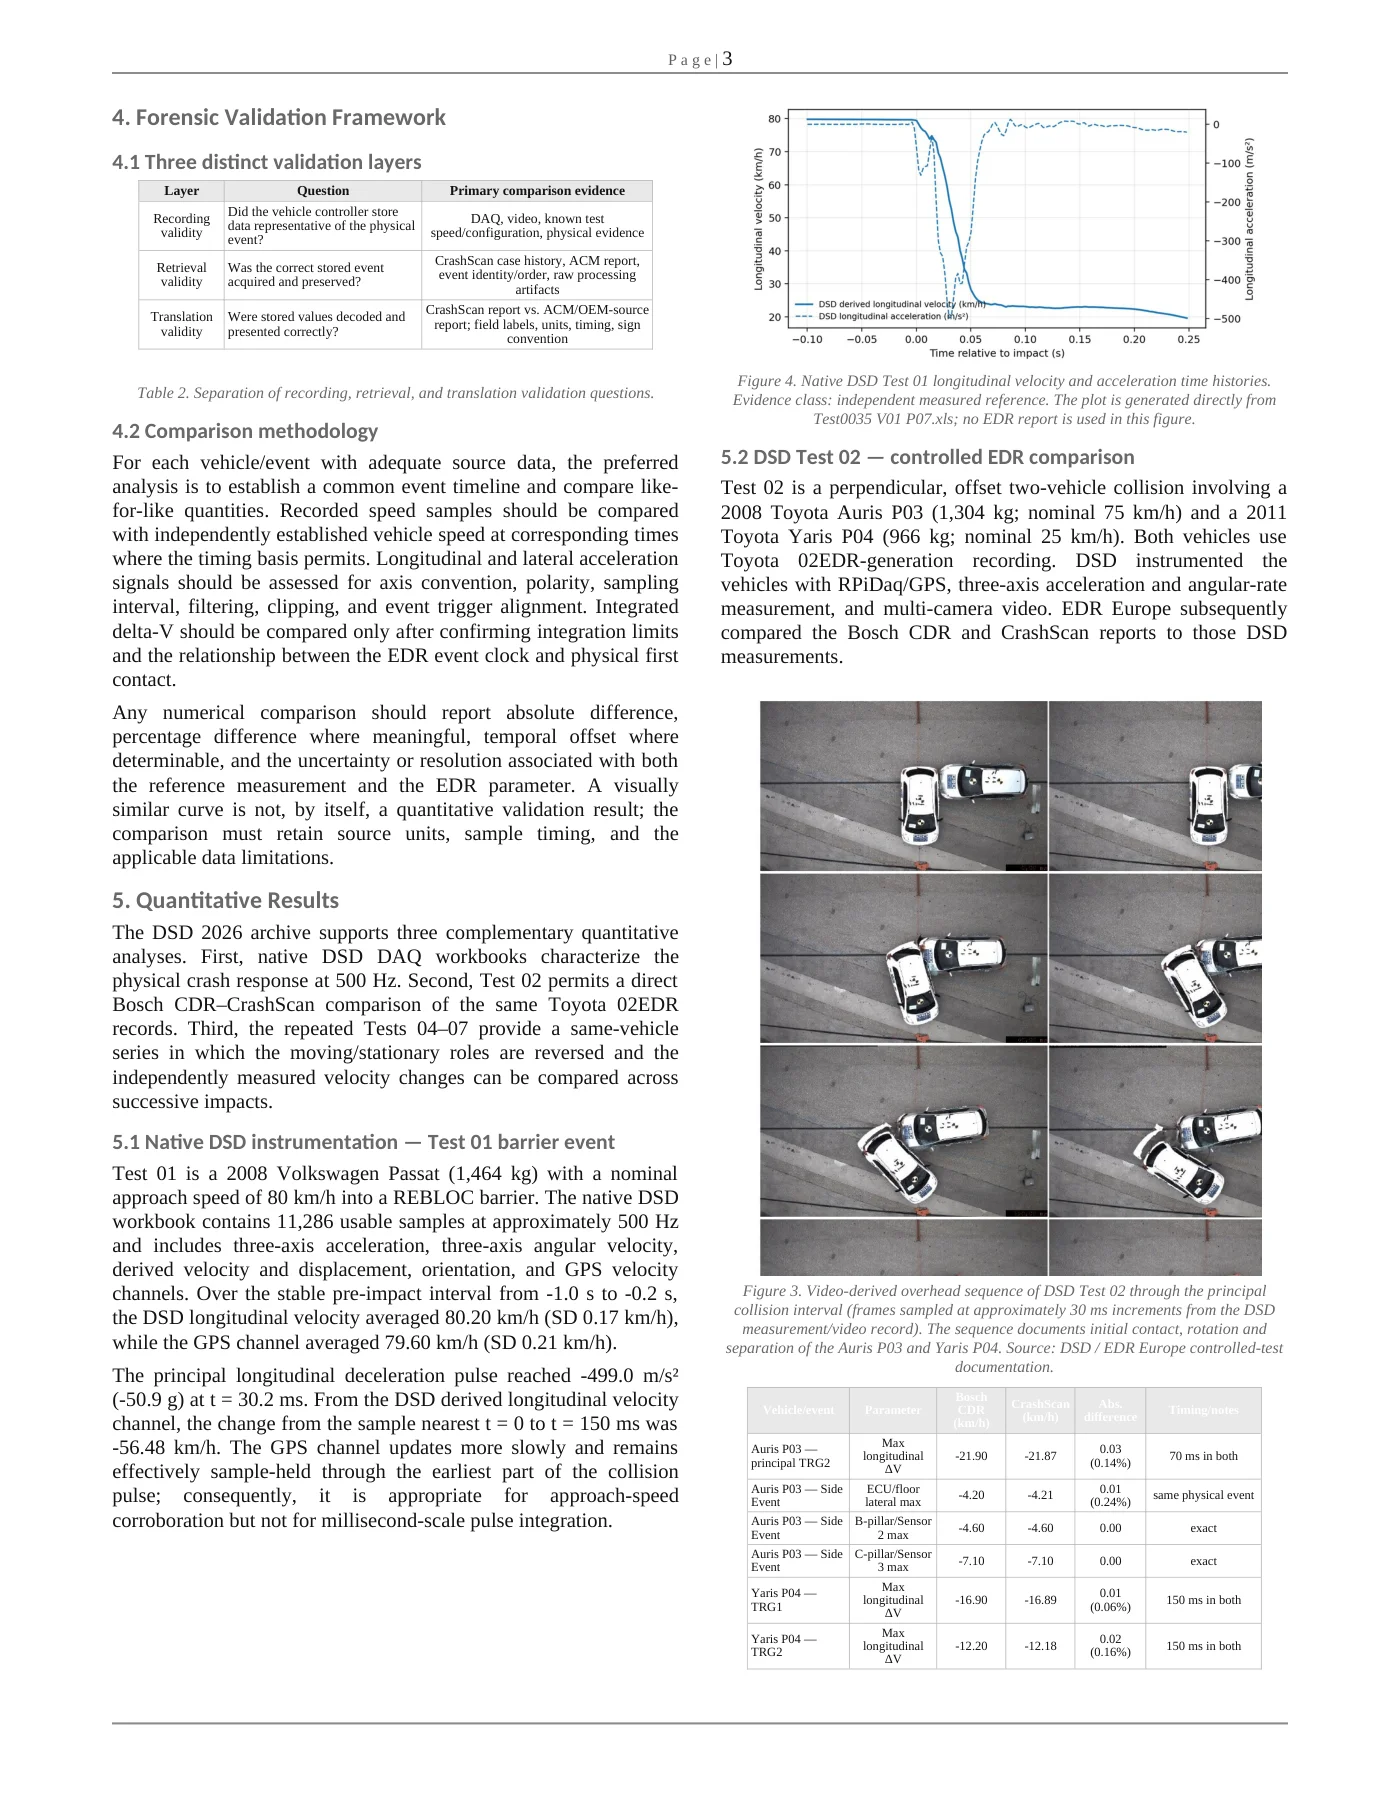
Test 01 is a 2008 Volkswagen Passat (1,464 kg) with a nominal approach speed of 80 km/h into a REBLOC barrier. The native DSD workbook contains 11,286 usable samples at approximately 500 Hz and includes three-axis acceleration, three-axis angular velocity, derived velocity and displacement, orientation, and GPS velocity channels. Over the stable pre-impact interval from -1.0 s to -0.2 s, the DSD longitudinal velocity averaged 80.20 km/h (SD 0.17 km/h), while the GPS channel averaged 79.60 km/h (SD 0.21 km/h). The principal longitudinal deceleration pulse reached -499.0 m/s² (-50.9 g) at t = 30.2 ms. From the DSD derived longitudinal velocity channel, the change from the sample nearest t = 0 to t = 150 ms was -56.48 km/h. The GPS channel updates more slowly and remains effectively sample-held through the earliest part of the collision pulse; consequently, it is appropriate for approach-speed corroboration but not for millisecond-scale pulse integration.
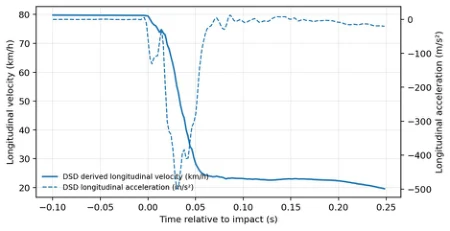
Figure 4. Native DSD Test 01 longitudinal velocity and acceleration time histories. Evidence class: independent measured reference. The plot is generated directly from Test0035 V01 P07.xls; no EDR report is used in this figure.
5.2. DSD test 02 — controlled EDR comparison
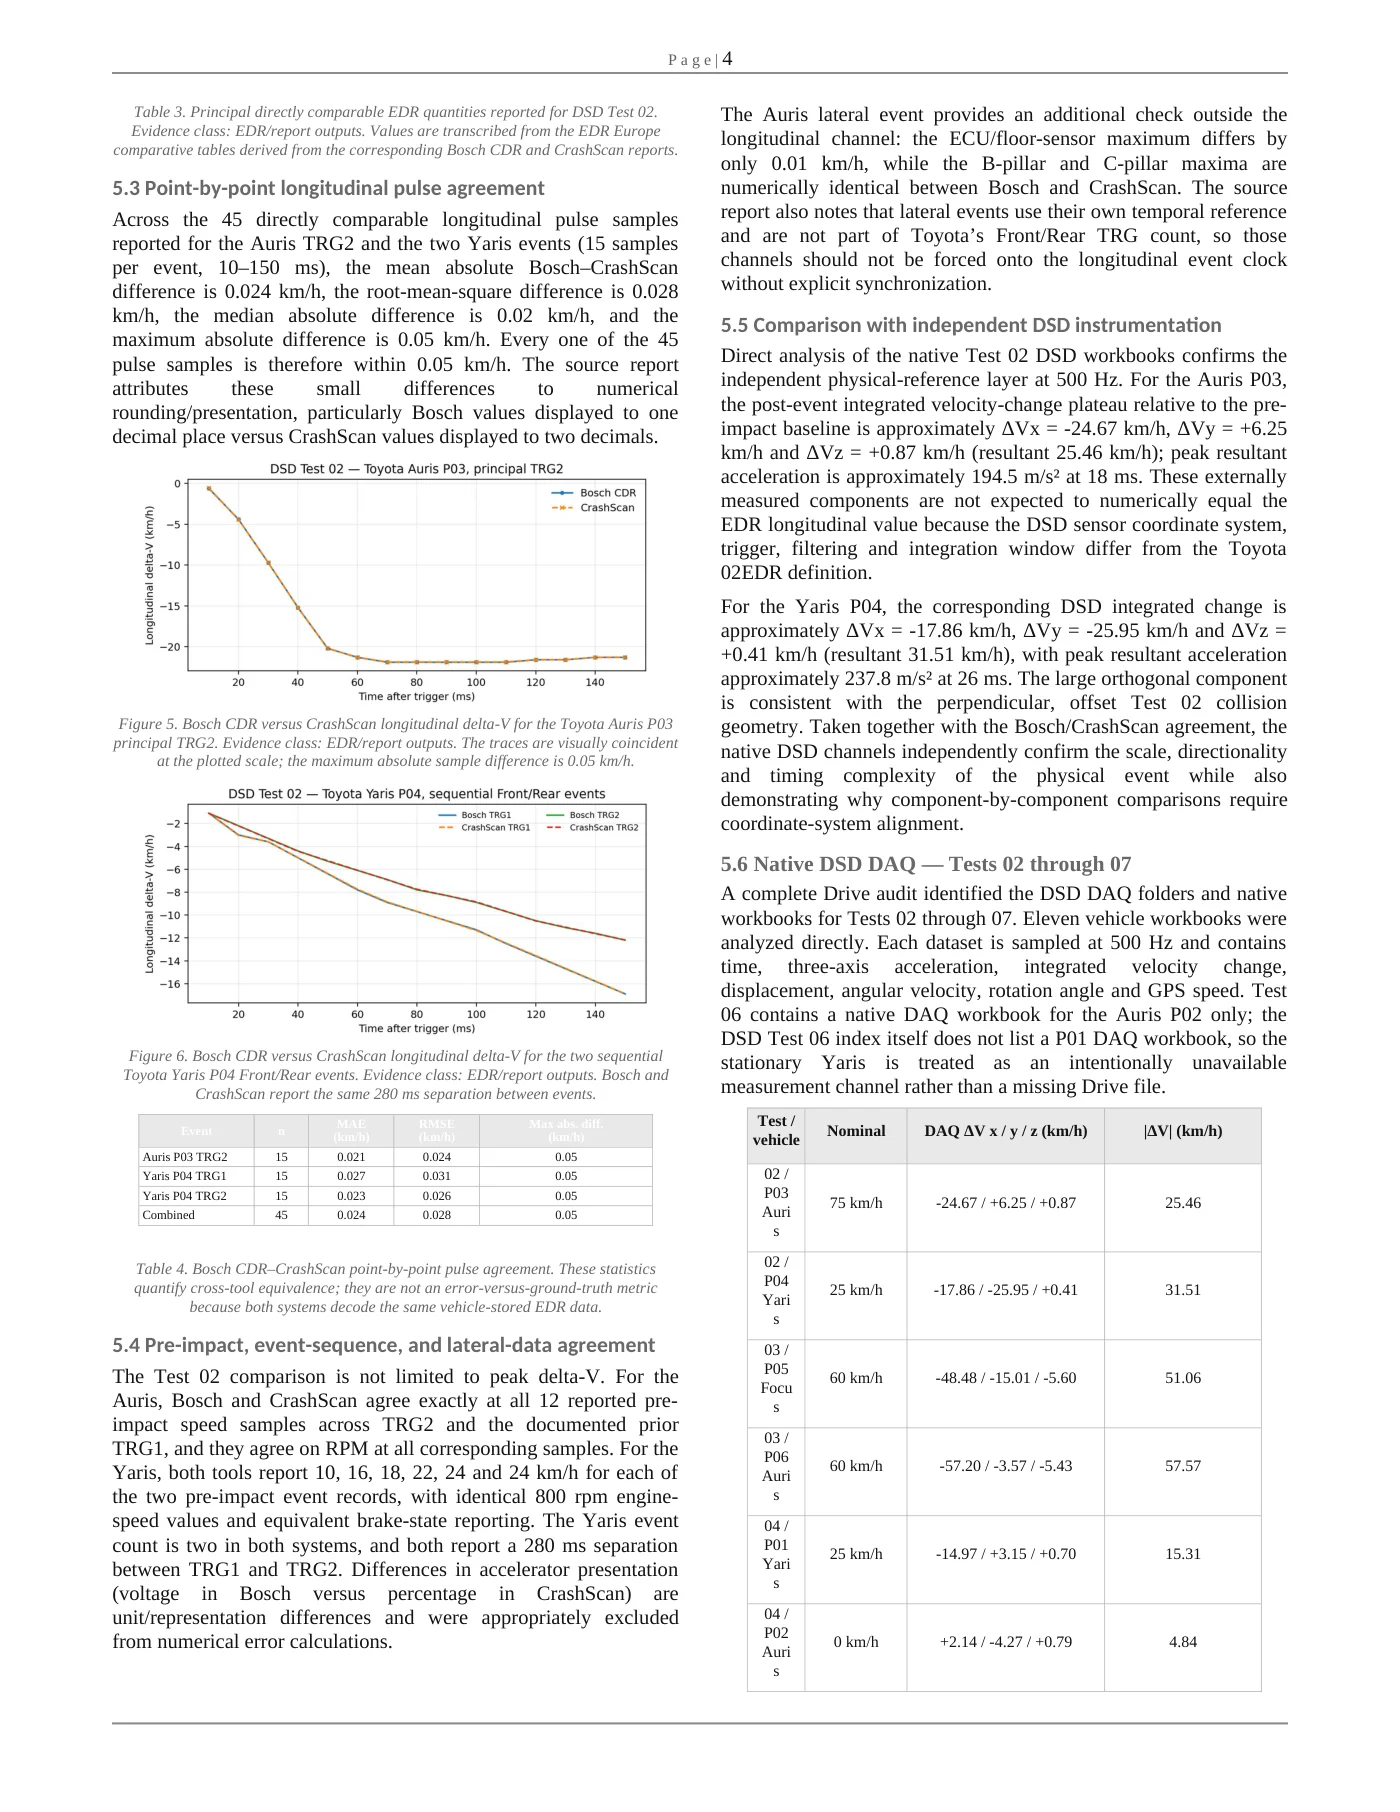
Test 02 is a perpendicular, offset two-vehicle collision involving a 2008 Toyota Auris P03 (1,304 kg; nominal 75 km/h) and a 2011 Toyota Yaris P04 (966 kg; nominal 25 km/h). Both vehicles use Toyota 02EDR-generation recording. DSD instrumented the vehicles with RPiDaq/GPS, three-axis acceleration and angular-rate measurement, and multi-camera video. EDR Europe subsequently compared the Bosch CDR and CrashScan reports to those DSD measurements.
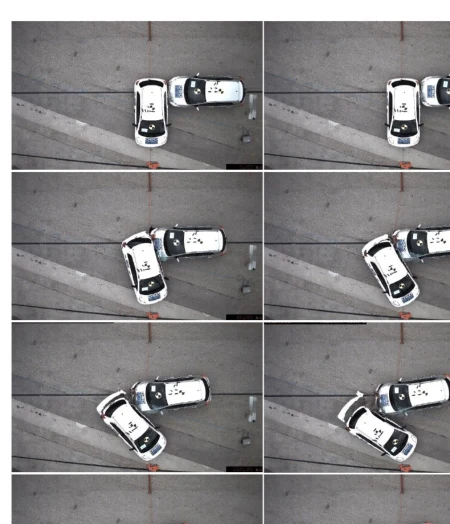
Figure 3. Video-derived overhead sequence of DSD Test 02 through the principal collision interval (frames sampled at approximately 30 ms increments from the DSD measurement/video record). The sequence documents initial contact, rotation and separation of the Auris P03 and Yaris P04. Source: DSD / EDR Europe controlled-test documentation.
Read table as text
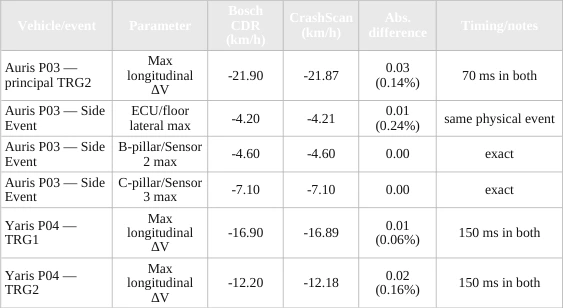
| Vehicle/event | Parameter | Bosch CDR (km/h) | CrashScan (km/h) | Abs. difference | Timing/notes |
| Auris P03 — principal TRG2 | Max longitudinal ΔV | -21.90 | -21.87 | 0.03 (0.14%) | 70 ms in both |
| Auris P03 — Side Event | ECU/floor lateral max | -4.20 | -4.21 | 0.01 (0.24%) | same physical event |
| Auris P03 — Side Event | B-pillar/Sensor 2 max | -4.60 | -4.60 | 0.00 | exact |
| Auris P03 — Side Event | C-pillar/Sensor 3 max | -7.10 | -7.10 | 0.00 | exact |
| Yaris P04 — TRG1 | Max longitudinal ΔV | -16.90 | -16.89 | 0.01 (0.06%) | 150 ms in both |
| Yaris P04 — TRG2 | Max longitudinal ΔV | -12.20 | -12.18 | 0.02 (0.16%) | 150 ms in both |
Table 3. Principal directly comparable EDR quantities reported for DSD Test 02. Evidence class: EDR/report outputs. Values are transcribed from the EDR Europe comparative tables derived from the corresponding Bosch CDR and CrashScan reports.
5.3. Point-by-point longitudinal pulse agreement
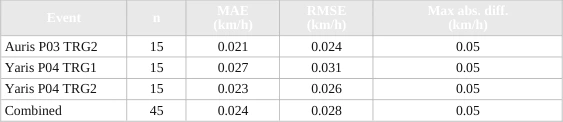
Across the 45 directly comparable longitudinal pulse samples reported for the Auris TRG2 and the two Yaris events (15 samples per event, 10–150 ms), the mean absolute Bosch–CrashScan difference is 0.024 km/h, the root-mean-square difference is 0.028 km/h, the median absolute difference is 0.02 km/h, and the maximum absolute difference is 0.05 km/h. Every one of the 45 pulse samples is therefore within 0.05 km/h. The source report attributes these small differences to numerical rounding/presentation, particularly Bosch values displayed to one decimal place versus CrashScan values displayed to two decimals.
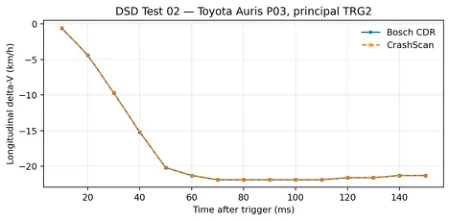
Figure 5. Bosch CDR versus CrashScan longitudinal delta-V for the Toyota Auris P03 principal TRG2. Evidence class: EDR/report outputs. The traces are visually coincident at the plotted scale; the maximum absolute sample difference is 0.05 km/h.
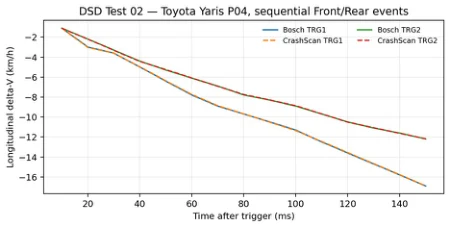
Figure 6. Bosch CDR versus CrashScan longitudinal delta-V for the two sequential Toyota Yaris P04 Front/Rear events. Evidence class: EDR/report outputs. Bosch and CrashScan report the same 280 ms separation between events.
Read table as text
| Event | n | MAE (km/h) | RMSE (km/h) | Max abs. diff. (km/h) |
| Auris P03 TRG2 | 15 | 0.021 | 0.024 | 0.05 |
| Yaris P04 TRG1 | 15 | 0.027 | 0.031 | 0.05 |
| Yaris P04 TRG2 | 15 | 0.023 | 0.026 | 0.05 |
| Combined | 45 | 0.024 | 0.028 | 0.05 |
Table 4. Bosch CDR–CrashScan point-by-point pulse agreement. These statistics quantify cross-tool equivalence; they are not an error-versus-ground-truth metric because both systems decode the same vehicle-stored EDR data.
5.4. Pre-impact, event-sequence, and lateral-data agreement
The Test 02 comparison is not limited to peak delta-V. For the Auris, Bosch and CrashScan agree exactly at all 12 reported pre-impact speed samples across TRG2 and the documented prior TRG1, and they agree on RPM at all corresponding samples. For the Yaris, both tools report 10, 16, 18, 22, 24 and 24 km/h for each of the two pre-impact event records, with identical 800 rpm engine-speed values and equivalent brake-state reporting. The Yaris event count is two in both systems, and both report a 280 ms separation between TRG1 and TRG2. Differences in accelerator presentation (voltage in Bosch versus percentage in CrashScan) are unit/representation differences and were appropriately excluded from numerical error calculations.
The Auris lateral event provides an additional check outside the longitudinal channel: the ECU/floor-sensor maximum differs by only 0.01 km/h, while the B-pillar and C-pillar maxima are numerically identical between Bosch and CrashScan. The source report also notes that lateral events use their own temporal reference and are not part of Toyota’s Front/Rear TRG count, so those channels should not be forced onto the longitudinal event clock without explicit synchronization.
5.5. Comparison with independent DSD instrumentation
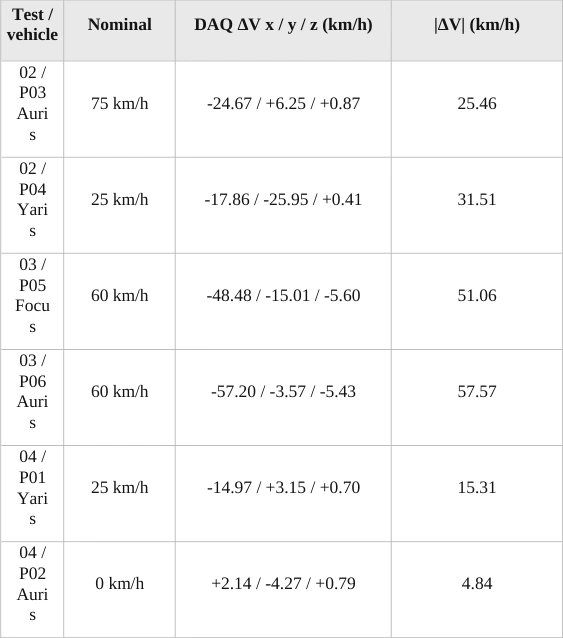
Direct analysis of the native Test 02 DSD workbooks confirms the independent physical-reference layer at 500 Hz. For the Auris P03, the post-event integrated velocity-change plateau relative to the pre-impact baseline is approximately ΔVx = -24.67 km/h, ΔVy = +6.25 km/h and ΔVz = +0.87 km/h (resultant 25.46 km/h); peak resultant acceleration is approximately 194.5 m/s² at 18 ms. These externally measured components are not expected to numerically equal the EDR longitudinal value because the DSD sensor coordinate system, trigger, filtering and integration window differ from the Toyota 02EDR definition.
For the Yaris P04, the corresponding DSD integrated change is approximately ΔVx = -17.86 km/h, ΔVy = -25.95 km/h and ΔVz = +0.41 km/h (resultant 31.51 km/h), with peak resultant acceleration approximately 237.8 m/s² at 26 ms. The large orthogonal component is consistent with the perpendicular, offset Test 02 collision geometry. Taken together with the Bosch/CrashScan agreement, the native DSD channels independently confirm the scale, directionality and timing complexity of the physical event while also demonstrating why component-by-component comparisons require coordinate-system alignment.
5.6. Native DSD DAQ — tests 02 through 07
A complete Drive audit identified the DSD DAQ folders and native workbooks for Tests 02 through 07. Eleven vehicle workbooks were analyzed directly. Each dataset is sampled at 500 Hz and contains time, three-axis acceleration, integrated velocity change, displacement, angular velocity, rotation angle and GPS speed. Test 06 contains a native DAQ workbook for the Auris P02 only; the DSD Test 06 index itself does not list a P01 DAQ workbook, so the stationary Yaris is treated as an intentionally unavailable measurement channel rather than a missing Drive file.
Read table as text
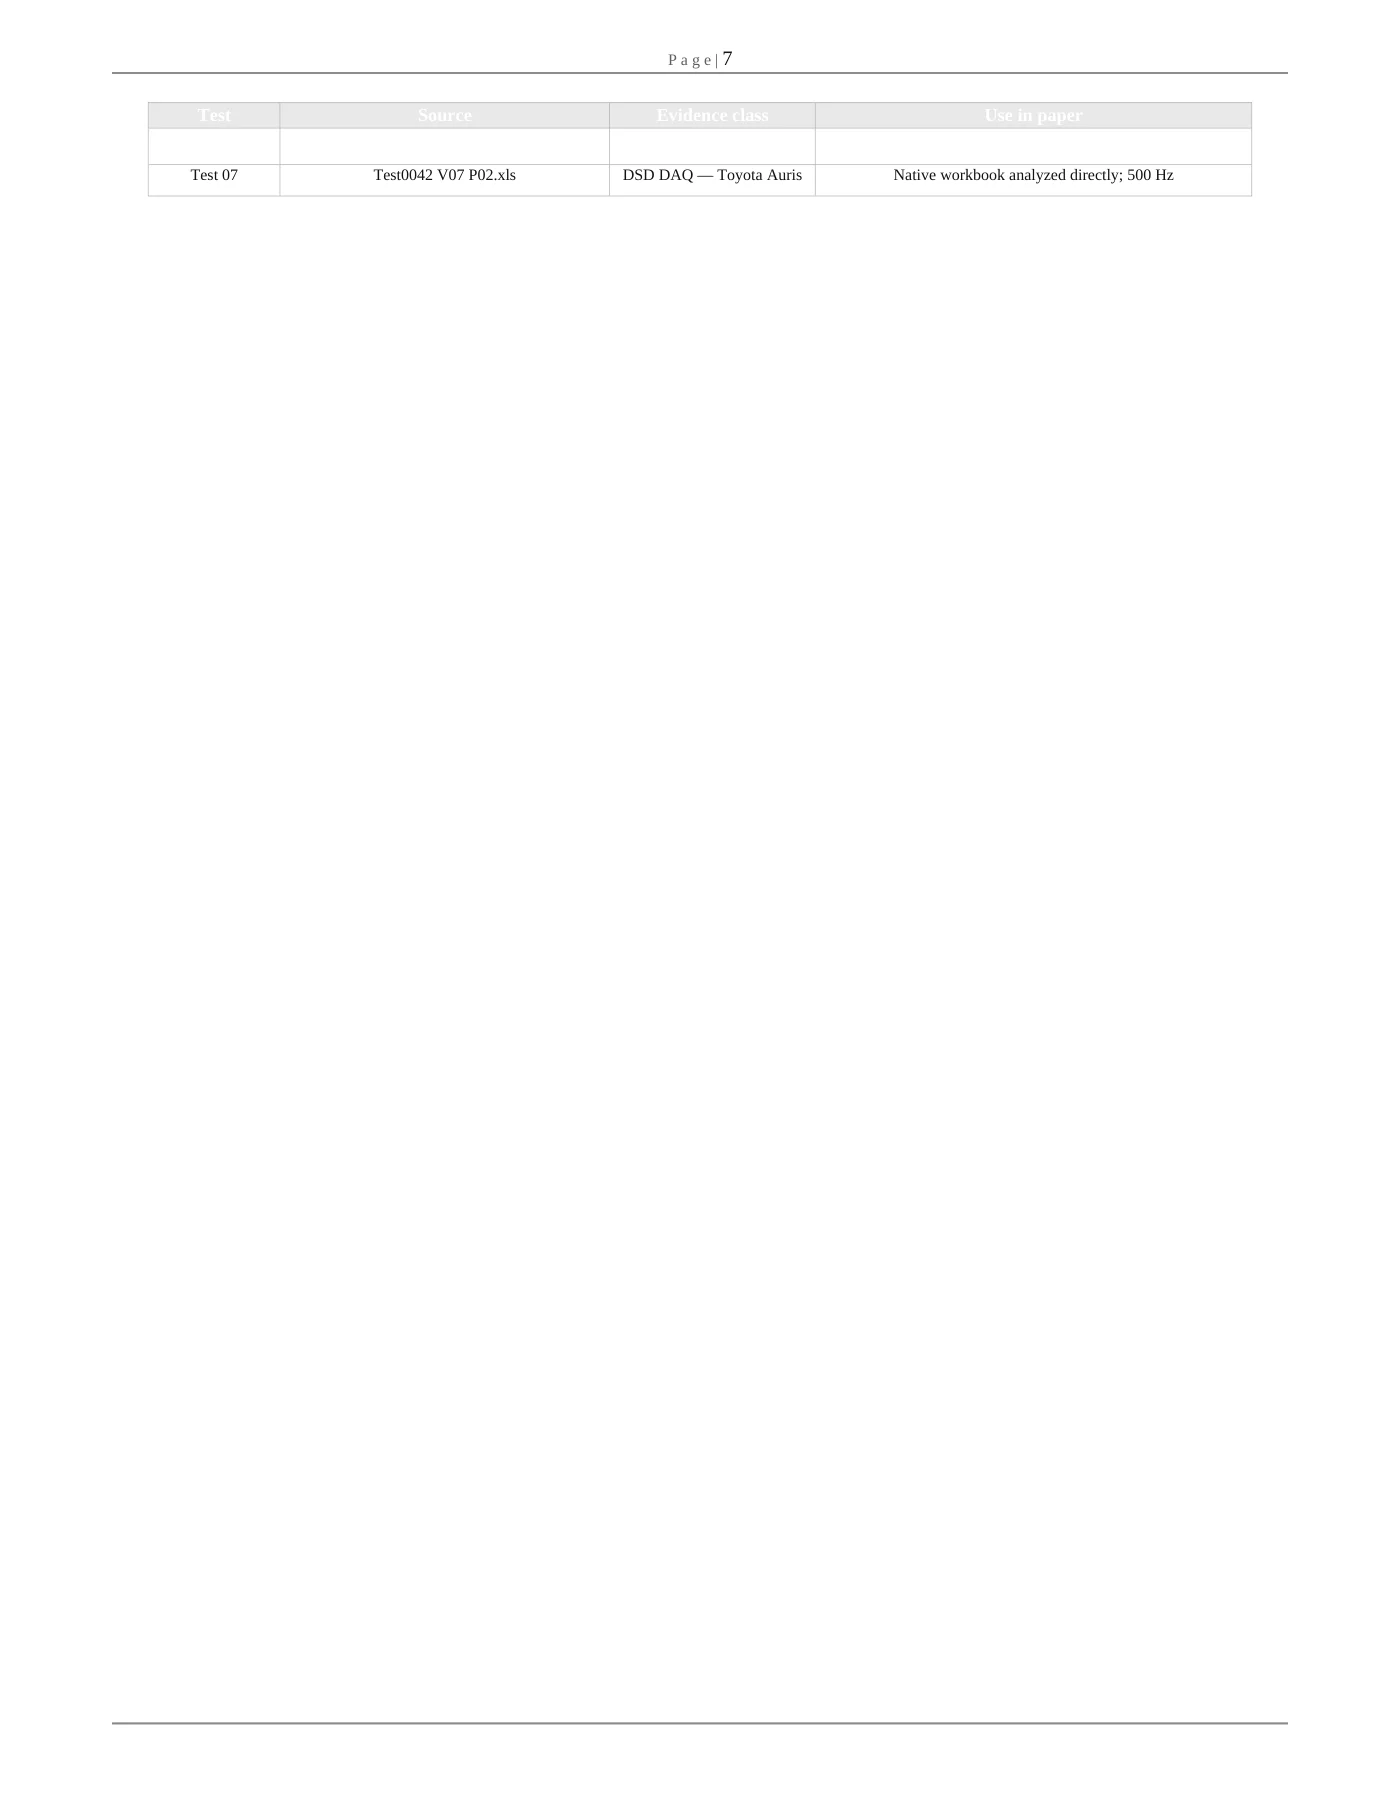
| Test / vehicle | Nominal | DAQ ΔV x / y / z (km/h) | |ΔV| (km/h) |
| 02 / P03 Auri s | 75 km/h | -24.67 / +6.25 / +0.87 | 25.46 |
| 02 / P04 Yari s | 25 km/h | -17.86 / -25.95 / +0.41 | 31.51 |
| 03 / P05 Focu s | 60 km/h | -48.48 / -15.01 / -5.60 | 51.06 |
| 03 / P06 Auri s | 60 km/h | -57.20 / -3.57 / -5.43 | 57.57 |
| 04 / P01 Yari s | 25 km/h | -14.97 / +3.15 / +0.70 | 15.31 |
| 04 / P02 Auri s | 0 km/h | +2.14 / -4.27 / +0.79 | 4.84 |
Read table as text
| Test / vehicle | Nominal | DAQ ΔV x / y / z (km/h) | |ΔV| (km/h) |
| 05 / P01 Yari s | 25 km/h | -14.97 / -1.89 / -0.50 | 15.10 |
| 05 / P02 Auri s | 0 km/h | +2.42 / +2.86 / +0.96 | 3.87 |
| 06 / P02 Auri s | 25 km/h | -8.38 / -1.52 / +1.09 | 8.59 |
| 07 / P01 Yari s | 0 km/h | +8.23 / -3.79 / -0.69 | 9.08 |
| 07 / P02 Auri s | 25 km/h | -13.32 / -0.86 / -0.23 | 13.35 |
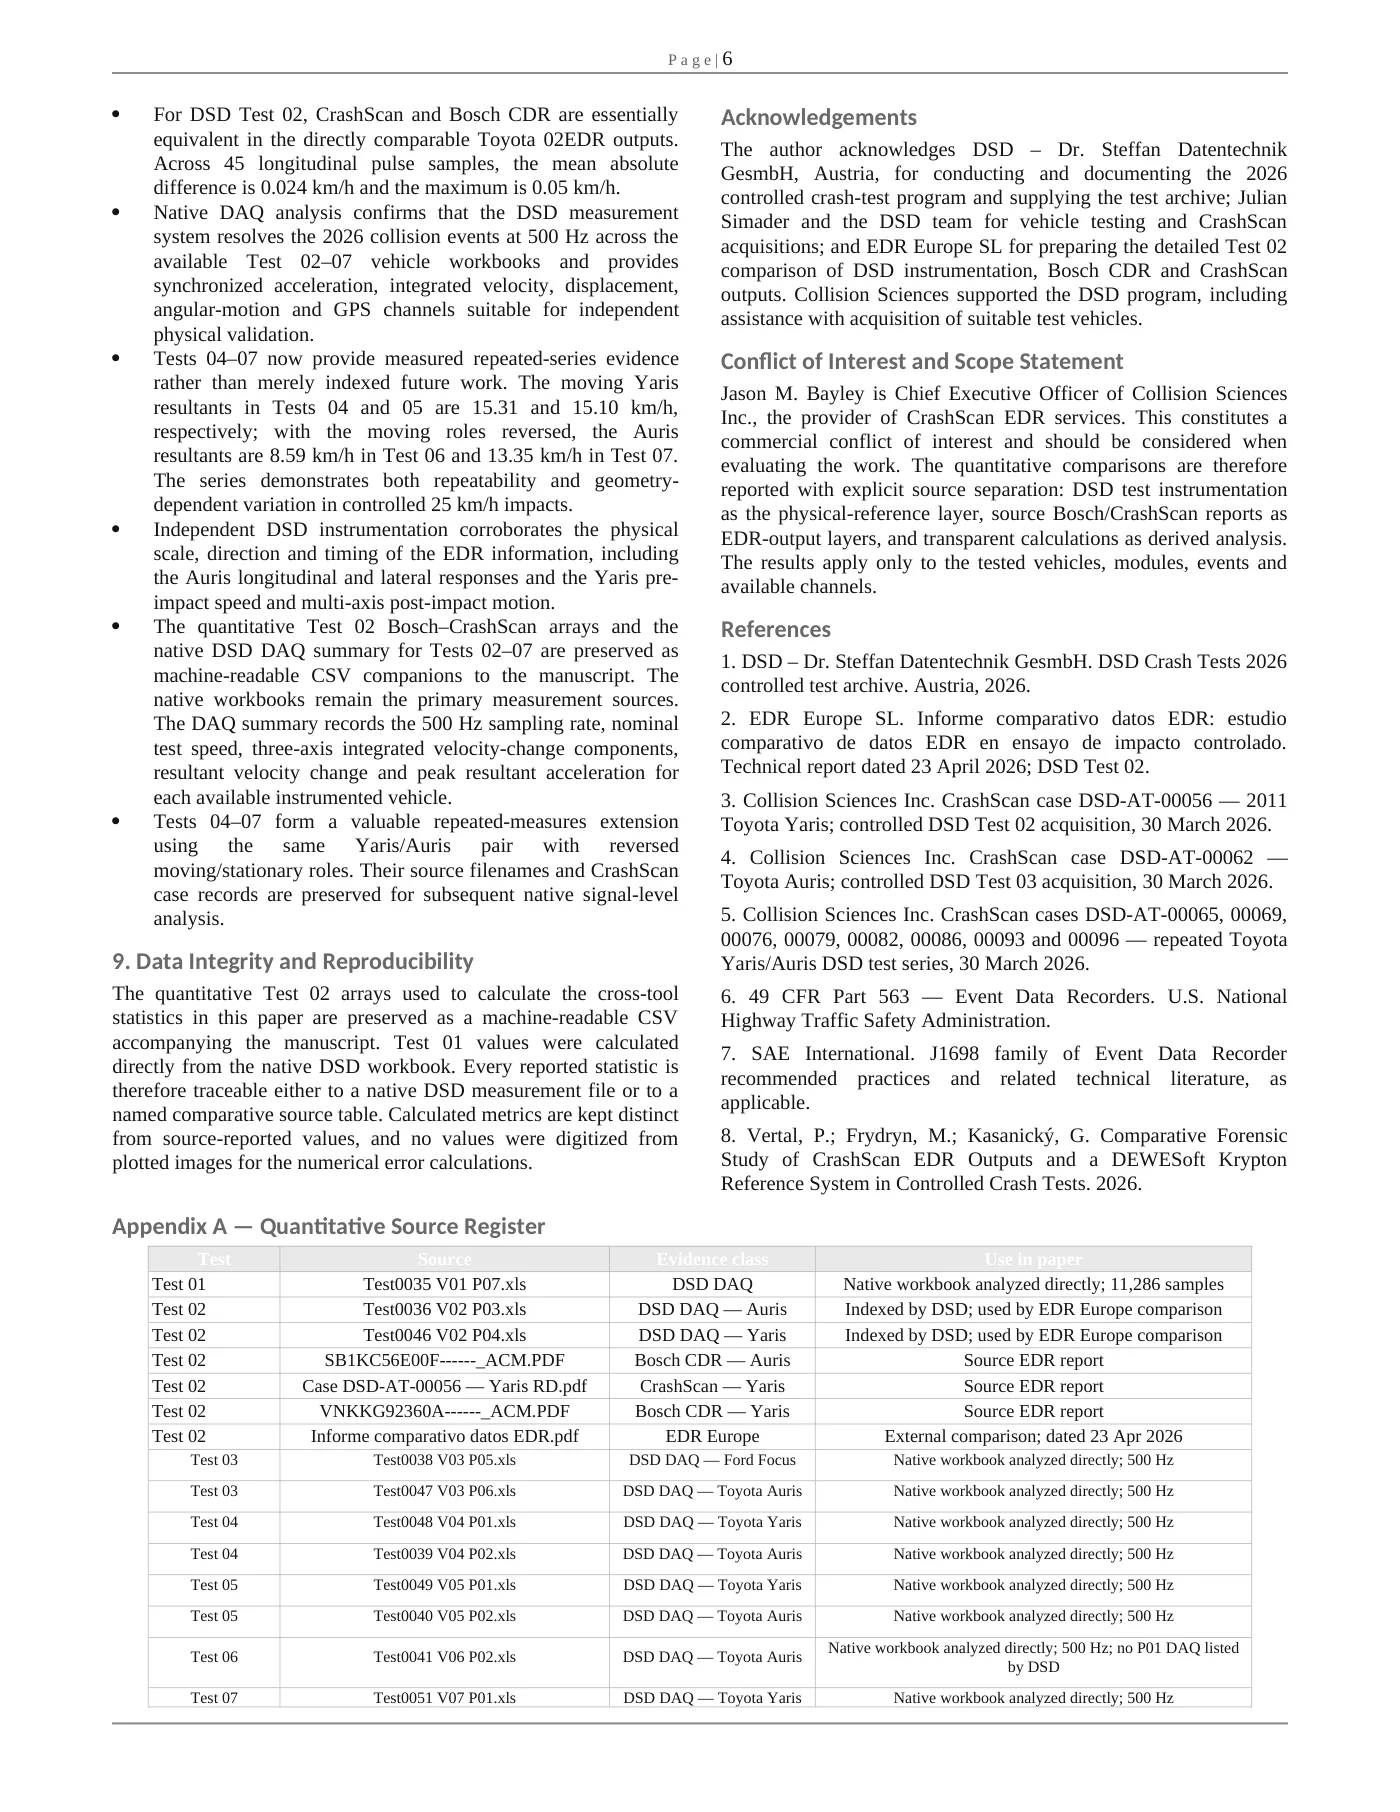
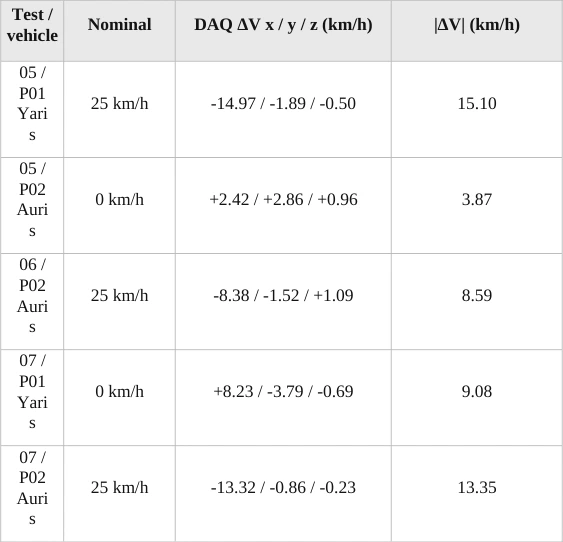
The repeated 25 km/h Yaris-moving tests are highly consistent in resultant measured response: 15.31 km/h in Test 04 and 15.10 km/h in Test 05, a difference of 0.21 km/h (1.4% relative to their mean). The stationary Auris responses in those tests are smaller (4.84 and 3.87 km/h). When the Auris is the moving vehicle, its measured resultant is 8.59 km/h in Test 06 and 13.35 km/h in Test 07. This wider spread indicates that nominal approach speed alone does not determine vehicle ΔV; engagement location, rebound, rotation and collision geometry remain material variables.
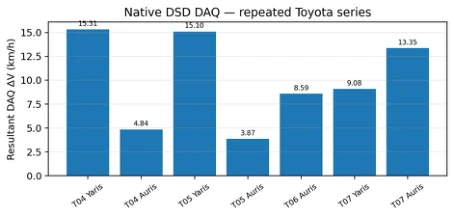
Figure 7. Native DSD resultant velocity change for the repeated Toyota Tests 04– 07. Values are derived directly from the 500 Hz DSD workbooks using the stated pre/post plateau method. Evidence class: independent measured reference.
Table 5. Native DSD DAQ results for Tests 02–07. ΔV components are calculated as the median 0.20–0.50 s post-event integrated velocity plateau minus the median -0.30 to -0.10 s pre-event baseline. Resultant values are vector magnitudes. Evidence class: independent measured reference.
06 / In this resource
6. Discussion
The repeated Tests 04–07 can now be evaluated quantitatively rather than only as a source map. The moving Yaris response is notably repeatable between Tests 04 and 05 (15.31 versus 15.10 km/h resultant ΔV), while the stationary Auris response remains much smaller. After reversal of the moving/stationary roles, the moving Auris produces 8.59 km/h in Test 06 and 13.35 km/h in Test 07, and the stationary Yaris in Test 07 records 9.08 km/h.
These results show both repeatability under closely similar engagement and sensitivity to the actual impact geometry, supporting the use of the series as a controlled reconstruction/EDR validation dataset rather than as a single nominal-speed benchmark. Cross-tool agreement alone, however, is not physical ground truth. The DSD instrumentation provides the independent evidence needed to evaluate whether the stored EDR quantities are physically plausible in the controlled collision.
That comparison supports the EDR speed and delta-V interpretation while also demonstrating why an external crash pulse need not overlay an EDR trace point-for-point: the ECU can apply proprietary trigger criteria, filtering, integration windows and sensor selection, and the Yaris in this test does not store a lateral delta-V channel.
The scientifically appropriate conclusion is therefore two-layered: strong Bosch– CrashScan equivalence and physical coherence of the decoded EDR quantities with independently measured vehicle dynamics. The native DSD DAQ results reported for Tests 02–07 are calculated from the workbooks' integrated velocity channels using a defined pre-impact baseline (-0.30 to -0.10 s) and post-event plateau (0.20 to 0.50 s). Where those windows are not fully populated, the analysis uses the available stable pre/post interval.
These externally measured velocity changes are coordinate- and processing-dependent and must not be equated directly to an OEM EDR longitudinal ΔV without axis and event-window alignment. The repeated Tests 04–07 are scientifically promising because they use the same vehicles multiple times and reverse which vehicle is moving. Those tests can distinguish event-history behavior, trigger storage, and repeatability from vehicle-to-vehicle variation. Their exact native DAQ/report files are identified in the source archive, but the current Drive connector exposes only their HTML references rather than the nested raw files.
The present paper therefore does not manufacture signal-level statistics for those tests.
07 / In this resource
7. Limitations
The principal quantitative Test 02 comparison is based on an external technical report prepared by EDR Europe using the Bosch CDR, CrashScan and DSD source material.
The underlying Test 02 native DAQ workbooks are named in the DSD archive but are not presently enumerated through the connected Drive interface used for this analysis. The Bosch–CrashScan error statistics quantify agreement between two decoders of the same stored EDR information; they must not be described as absolute EDR accuracy against a physical standard. The DSD-versus-EDR comparison is necessarily affected by ECU trigger definition, sensor location, filtering, channel availability and integration-window differences.
For the Yaris in particular, a longitudinal-only EDR record cannot represent total resultant center-of-gravity delta-V in an oblique rotating collision. The Toyota 02EDR findings are vehicle/ECU-generation specific. They should not be generalized to other Toyota generations, other OEMs or other CrashScan-supported architectures without corresponding validation evidence. The author is Chief Executive Officer of Collision Sciences Inc.
The controlled test data were generated by DSD and the comparative Test 02 assessment was prepared externally by EDR Europe; nevertheless, the commercial relationship should be considered when evaluating the work. One Yaris notification associated with case DSD-AT-00086 contains a VIN-character variation relative to the recurring Yaris identifier in the surrounding series. The source report should control vehicle identity before any external publication that reproduces the VIN.
08 / In this resource
8. Conclusions
The DSD 2026 program provides a controlled, instrumented crash-test dataset with known vehicle configurations, independent measurement, video documentation, EDR retrieval records and reconstruction materials.
For DSD Test 02, CrashScan and Bosch CDR are essentially equivalent in the directly comparable Toyota 02EDR outputs. Across 45 longitudinal pulse samples, the mean absolute difference is 0.024 km/h and the maximum is 0.05 km/h. Native DAQ analysis confirms that the DSD measurement system resolves the 2026 collision events at 500 Hz across the available Test 02–07 vehicle workbooks and provides synchronized acceleration, integrated velocity, displacement, angular-motion and GPS channels suitable for independent physical validation. Tests 04–07 now provide measured repeated-series evidence rather than merely indexed future work.
The moving Yaris resultants in Tests 04 and 05 are 15.31 and 15.10 km/h, respectively; with the moving roles reversed, the Auris resultants are 8.59 km/h in Test 06 and 13.35 km/h in Test 07.
The series demonstrates both repeatability and geometry-dependent variation in controlled 25 km/h impacts. Independent DSD instrumentation corroborates the physical scale, direction and timing of the EDR information, including the Auris longitudinal and lateral responses and the Yaris pre-impact speed and multi-axis post-impact motion. The quantitative Test 02 Bosch–CrashScan arrays and the native DSD DAQ summary for Tests 02–07 are preserved as machine-readable CSV companions to the manuscript. The native workbooks remain the primary measurement sources.
The DAQ summary records the 500 Hz sampling rate, nominal test speed, three-axis integrated velocity-change components, resultant velocity change and peak resultant acceleration for each available instrumented vehicle. Tests 04–07 form a valuable repeated-measures extension using the same Yaris/Auris pair with reversed moving/stationary roles. Their source filenames and CrashScan case records are preserved for subsequent native signal-level analysis.
09 / In this resource
9. Data integrity and reproducibility
The quantitative Test 02 arrays used to calculate the cross-tool statistics in this paper are preserved as a machine-readable CSV accompanying the manuscript. Test 01 values were calculated directly from the native DSD workbook. Every reported statistic is therefore traceable either to a native DSD measurement file or to a named comparative source table. Calculated metrics are kept distinct from source-reported values, and no values were digitized from plotted images for the numerical error calculations.
10 / In this resource
Acknowledgements
The author acknowledges DSD – Dr. Steffan Datentechnik GesmbH, Austria, for conducting and documenting the 2026 controlled crash-test program and supplying the test archive; Julian Simader and the DSD team for vehicle testing and CrashScan acquisitions; and EDR Europe SL for preparing the detailed Test 02 comparison of DSD instrumentation, Bosch CDR and CrashScan outputs. Collision Sciences supported the DSD program, including assistance with acquisition of suitable test vehicles.
11 / In this resource
Conflict of interest and scope statement
Jason M. Bayley is Chief Executive Officer of Collision Sciences Inc., the provider of CrashScan EDR services. This constitutes a commercial conflict of interest and should be considered when evaluating the work. The quantitative comparisons are therefore reported with explicit source separation: DSD test instrumentation as the physical-reference layer, source Bosch/CrashScan reports as EDR-output layers, and transparent calculations as derived analysis. The results apply only to the tested vehicles, modules, events and available channels.
12 / In this resource
References
1. DSD – Dr. Steffan Datentechnik GesmbH. DSD Crash Tests 2026 controlled test archive. Austria, 2026. 2. EDR Europe SL. Informe comparativo datos EDR: estudio comparativo de datos EDR en ensayo de impacto controlado. Technical report dated 23 April 2026; DSD Test 02. 3. Collision Sciences Inc. CrashScan case DSD-AT-00056 — 2011 Toyota Yaris; controlled DSD Test 02 acquisition, 30 March 2026. 4. Collision Sciences Inc. CrashScan case DSD-AT-00062 — Toyota Auris; controlled DSD Test 03 acquisition, 30 March 2026. 5. Collision Sciences Inc. CrashScan cases DSD-AT-00065, 00069, 00076, 00079, 00082, 00086, 00093 and 00096 — repeated Toyota Yaris/Auris DSD test series, 30 March 2026. 6. 49 CFR Part 563 — Event Data Recorders. U.S. National Highway Traffic Safety Administration. 7. SAE International. J1698 family of Event Data Recorder recommended practices and related technical literature, as applicable. 8. Vertal, P.; Frydryn, M.; Kasanický, G. Comparative Forensic Study of CrashScan EDR Outputs and a DEWESoft Krypton Reference System in Controlled Crash Tests. 2026.
13 / In this resource
Appendix A — Quantitative source register
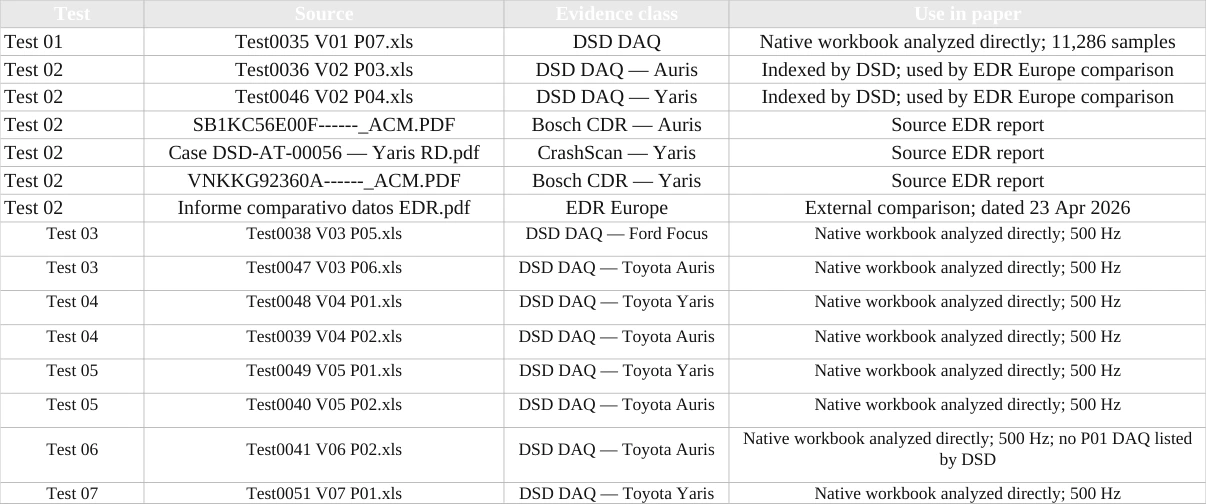
Read table as text
| Test | Source | Evidence class | Use in paper |
| Test 01 | Test0035 V01 P07.xls | DSD DAQ | Native workbook analyzed directly; 11,286 samples |
| Test 02 | Test0036 V02 P03.xls | DSD DAQ — Auris | Indexed by DSD; used by EDR Europe comparison |
| Test 02 | Test0046 V02 P04.xls | DSD DAQ — Yaris | Indexed by DSD; used by EDR Europe comparison |
| Test 02 | SB1KC56E00F------_ACM.PDF | Bosch CDR — Auris | Source EDR report |
| Test 02 | Case DSD-AT-00056 — Yaris RD.pdf | CrashScan — Yaris | Source EDR report |
| Test 02 | VNKKG92360A------_ACM.PDF | Bosch CDR — Yaris | Source EDR report |
| Test 02 | Informe comparativo datos EDR.pdf | EDR Europe | External comparison; dated 23 Apr 2026 |
| Test 03 | Test0038 V03 P05.xls | DSD DAQ — Ford Focus | Native workbook analyzed directly; 500 Hz |
| Test 03 | Test0047 V03 P06.xls | DSD DAQ — Toyota Auris | Native workbook analyzed directly; 500 Hz |
| Test 04 | Test0048 V04 P01.xls | DSD DAQ — Toyota Yaris | Native workbook analyzed directly; 500 Hz |
| Test 04 | Test0039 V04 P02.xls | DSD DAQ — Toyota Auris | Native workbook analyzed directly; 500 Hz |
| Test 05 | Test0049 V05 P01.xls | DSD DAQ — Toyota Yaris | Native workbook analyzed directly; 500 Hz |
| Test 05 | Test0040 V05 P02.xls | DSD DAQ — Toyota Auris | Native workbook analyzed directly; 500 Hz |
| Test 06 | Test0041 V06 P02.xls | DSD DAQ — Toyota Auris | Native workbook analyzed directly; 500 Hz; no P01 DAQ listed by DSD |
| Test 07 | Test0051 V07 P01.xls | DSD DAQ — Toyota Yaris | Native workbook analyzed directly; 500 Hz |

Read table as text
| Test | Source | Evidence class | Use in paper |
| Test 07 | Test0042 V07 P02.xls | DSD DAQ — Toyota Auris | Native workbook analyzed directly; 500 Hz |