Forensic verification of event data recorder (EDR) outputs against reference measurement systems in controlled crash tests
Ing. Peter Vertal, Ph.D., Ing. Michal Frydryn, Ph.D., prof. Gustav Kasanicky, CSc., MBA
01 / In this resource
Abstract
The article presents a study focused on the long-term retention and forensic reliability of crash data stored in Airbag Control Modules (ACMs). The research was based on a series of controlled crash tests, enabling precise validation of Event Data Recorder (EDR) outputs against reference measurement systems. The ACMs were stored for five to eight years under room-temperature conditions, after which communication was successfully re-established and data were re-retrieved using Collision Sciences CrashScan and Bosch CDR. The results showed complete consistency between the newly retrieved datasets and the original crash test data, confirming full functional integrity of the memory systems. The article explains EEPROM principles, its role in reliable data retention, and its evidentiary significance. The study demonstrates that ACMs maintain data integrity over extended periods and that EDR data can be confidently used for forensic analysis years after the original crash event.
02 / In this resource
Introduction
The VIMOT 4U Project (Development of an Innovative Method for Detecting Criminal Offenses in Road Traffic through the Use of Electronic Accident Data) focused on the experimental development of a methodology utilizing electronic accident data (EDR) stored in vehicle control units for the detection, evidencing, and suppression of criminal activity in road traffic. The core objective of the project was realized through an extensive series of dynamic crash tests conducted between 2017 and 2019. The purpose of these tests was the validation and verification of techniques and procedures for retrieving and decoding EDR data (e.g., with the Collision Sciences CrashScan and Bosch CDR) under controlled conditions.
The EDR records were systematically compared with ultra-precise measurements obtained from independent reference systems, including Dewesoft Krypton, PicDAQ5, high-speed video cameras, and geodetic surveying stations. These tests enabled the verification of critical EDR parameters, including vehicle pre-impact speed, acceleration/deceleration profile, brake pedal application, steering wheel angle, and seatbelt usage, which are essential for accurate accident reconstruction and forensically robust evidentiary purposes. The outcomes of the project directly resulted in the establishment of a Certified Methodology adopted by the Police of the Czech Republic.
03 / In this resource
Test vehicles
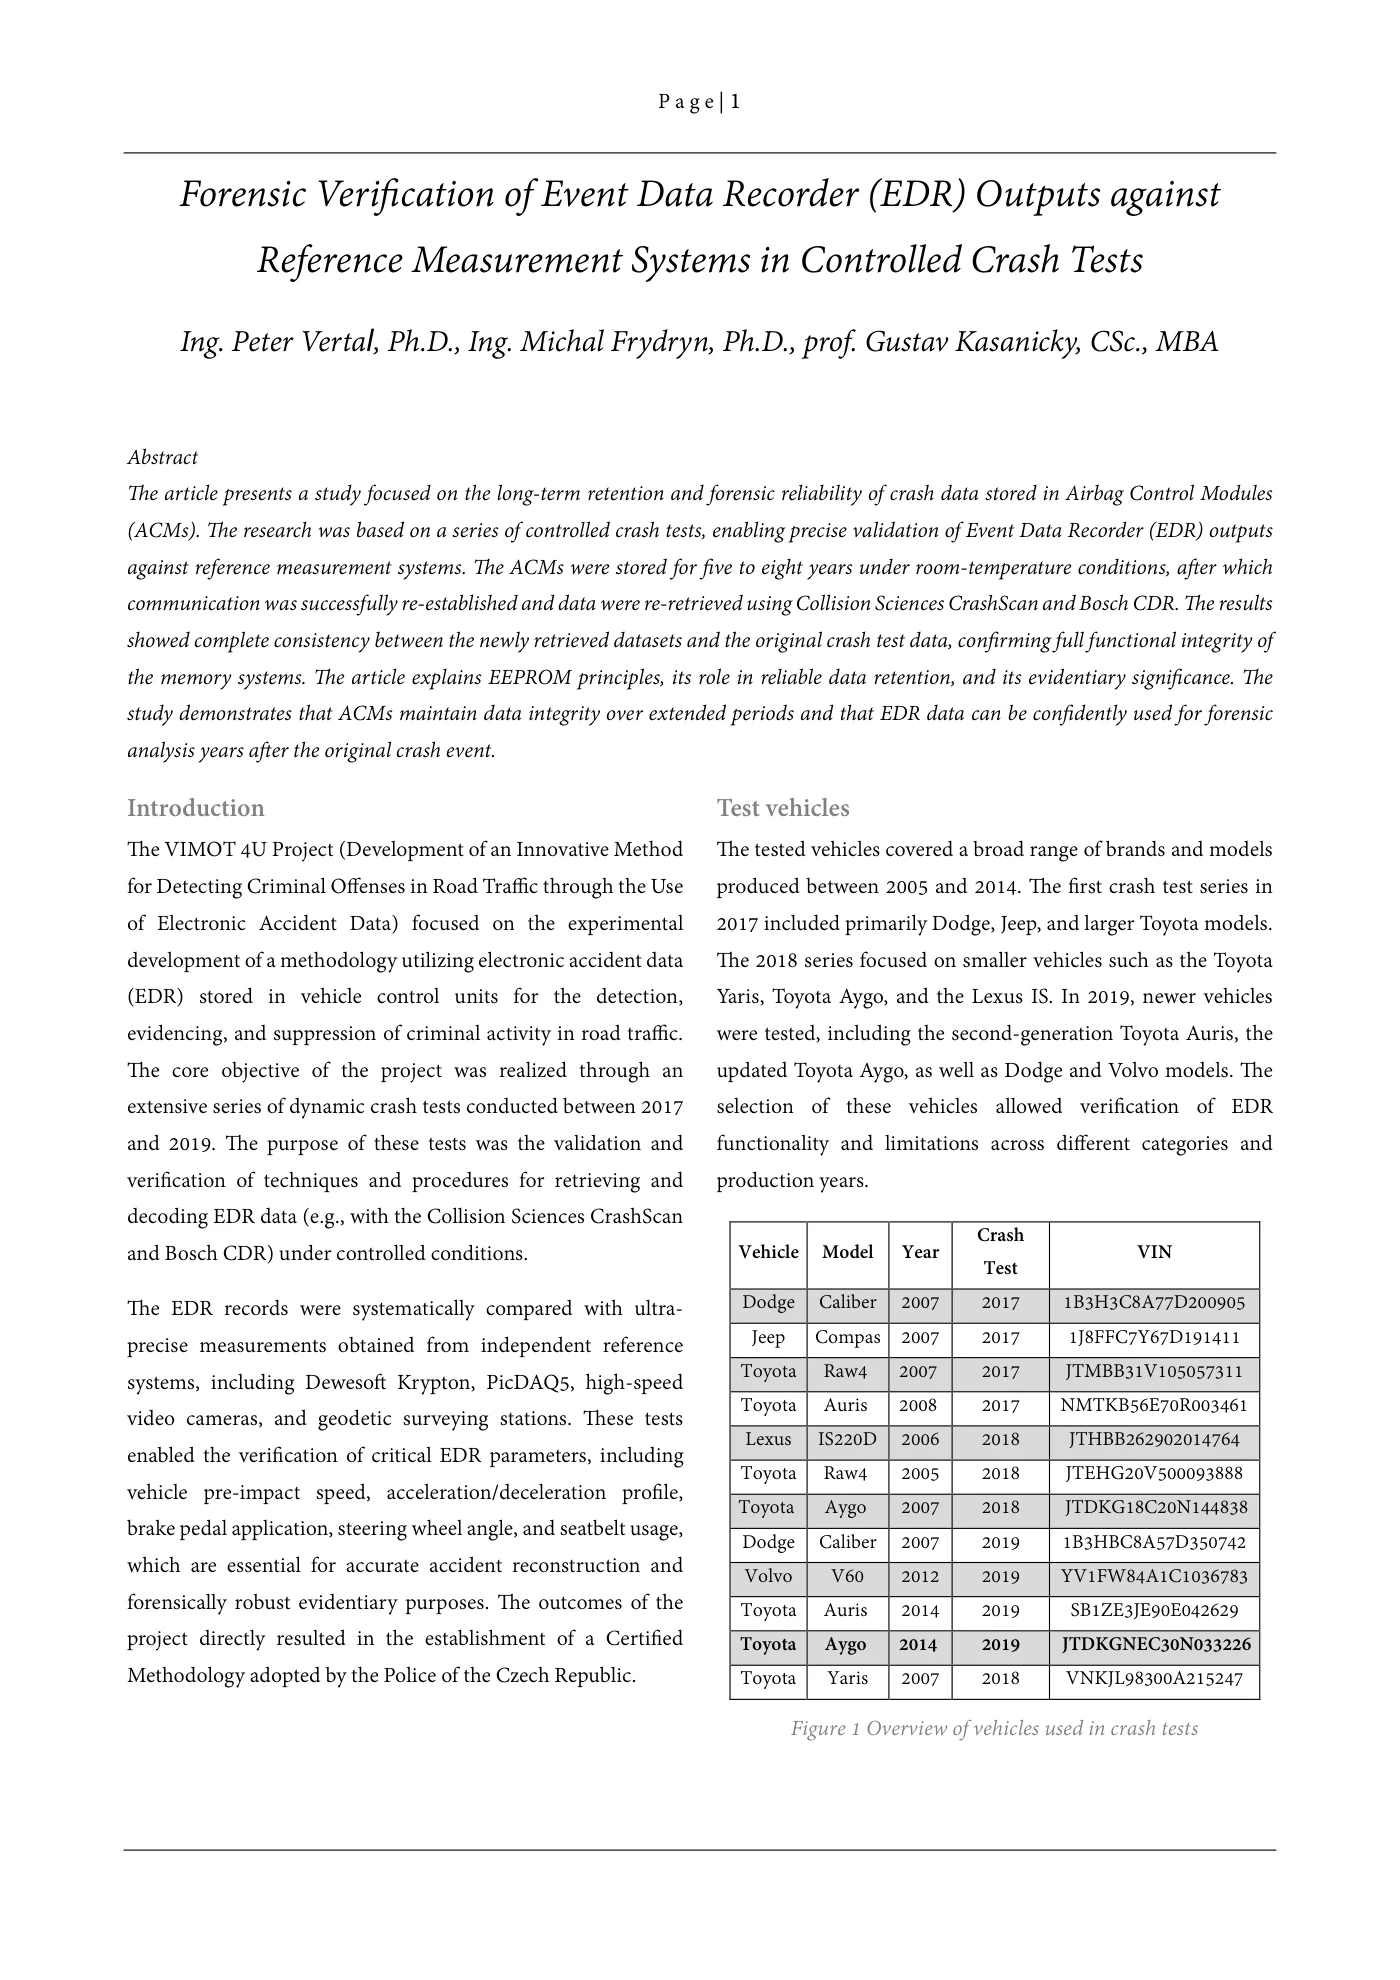
The tested vehicles covered a broad range of brands and models produced between 2005 and 2014. The first crash test series in 2017 included primarily Dodge, Jeep, and larger Toyota models. The 2018 series focused on smaller vehicles such as the Toyota Yaris, Toyota Aygo, and the Lexus IS. In 2019, newer vehicles were tested, including the second-generation Toyota Auris, the updated Toyota Aygo, as well as Dodge and Volvo models. The selection of these vehicles allowed verification of EDR functionality and limitations across different categories and production years.
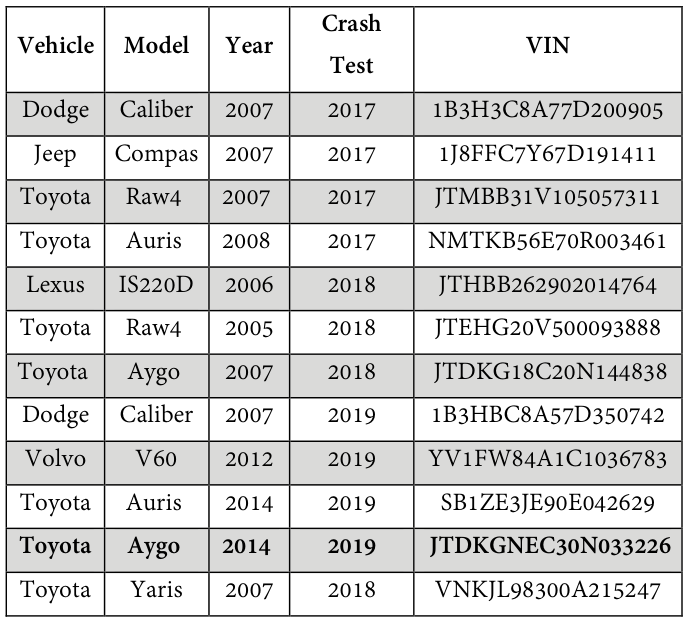
Read extracted table text
The image preserves the original columns. Extracted text below is retained for accessibility; refer to the table image or PDF for row and column relationships.
Vehicle model year crash
Test VIN
Dodge Caliber 2007 2017 1B3H3C8A77D200905 Jeep Compas 2007 2017 1J8FFC7Y67D191411 Toyota Raw4 2007 2017 JTMBB31V105057311 Toyota Auris 2008 2017 NMTKB56E70R003461 Lexus IS220D 2006 2018 JTHBB262902014764 Toyota Raw4 2005 2018 JTEHG20V500093888 Toyota Aygo 2007 2018 JTDKG18C20N144838 Dodge Caliber 2007 2019 1B3HBC8A57D350742 Volvo V60 2012 2019 YV1FW84A1C1036783 Toyota Auris 2014 2019 SB1ZE3JE90E042629
Toyota Aygo 2014 2019 jtdkgnec30n033226
Toyota Yaris 2007 2018 VNKJL98300A215247
Figure 1 Overview of vehicles used in crash tests
04 / In this resource
Measuring equipment
To ensure the reliability of the recorded and retrieved values, the test vehicles were fitted with an independent measurement assembly consisting of a DEWESoft Krypton data acquisition unit with a dedicated power source, accelerometers supplied by Kistler and Measurement Specialties, potentiometers from Micro-Epsilon, a seat belt force transducer, and a purpose-built measurement computer. This configuration is hereinafter designated as the Krypton measurement system.
The measurement computer was engineered specifically for demanding conditions such as crash testing and was therefore designed without any rotating or freely suspended components. In essence, it consists of a mainboard with standard PC elements—including a network interface card and Wi-Fi module—housed within a robust aluminum enclosure. This unit provides configuration of measurement parameters, execution of acquisition software, and secure storage of collected data. Communication is achieved via wireless connection with remote-desktop access.
The Krypton central unit was deployed in two variants: two modules of type 3xSTG and two modules of type 6xSTG, together supporting up to 18 channels, each capable of sampling at frequencies up to 20 kHz. Owing to its modular architecture, the system could be divided for experiments involving more than two vehicles, thereby forming two fully independent reference assemblies. Data and power transmission between the central unit, the computer, and individual modules was facilitated by the EtherCAT protocol and dedicated EtherCAT cabling, ensuring both rapid transfer and reliable synchronization. During all tests, the Krypton unit was powered by a 12 V battery pack.
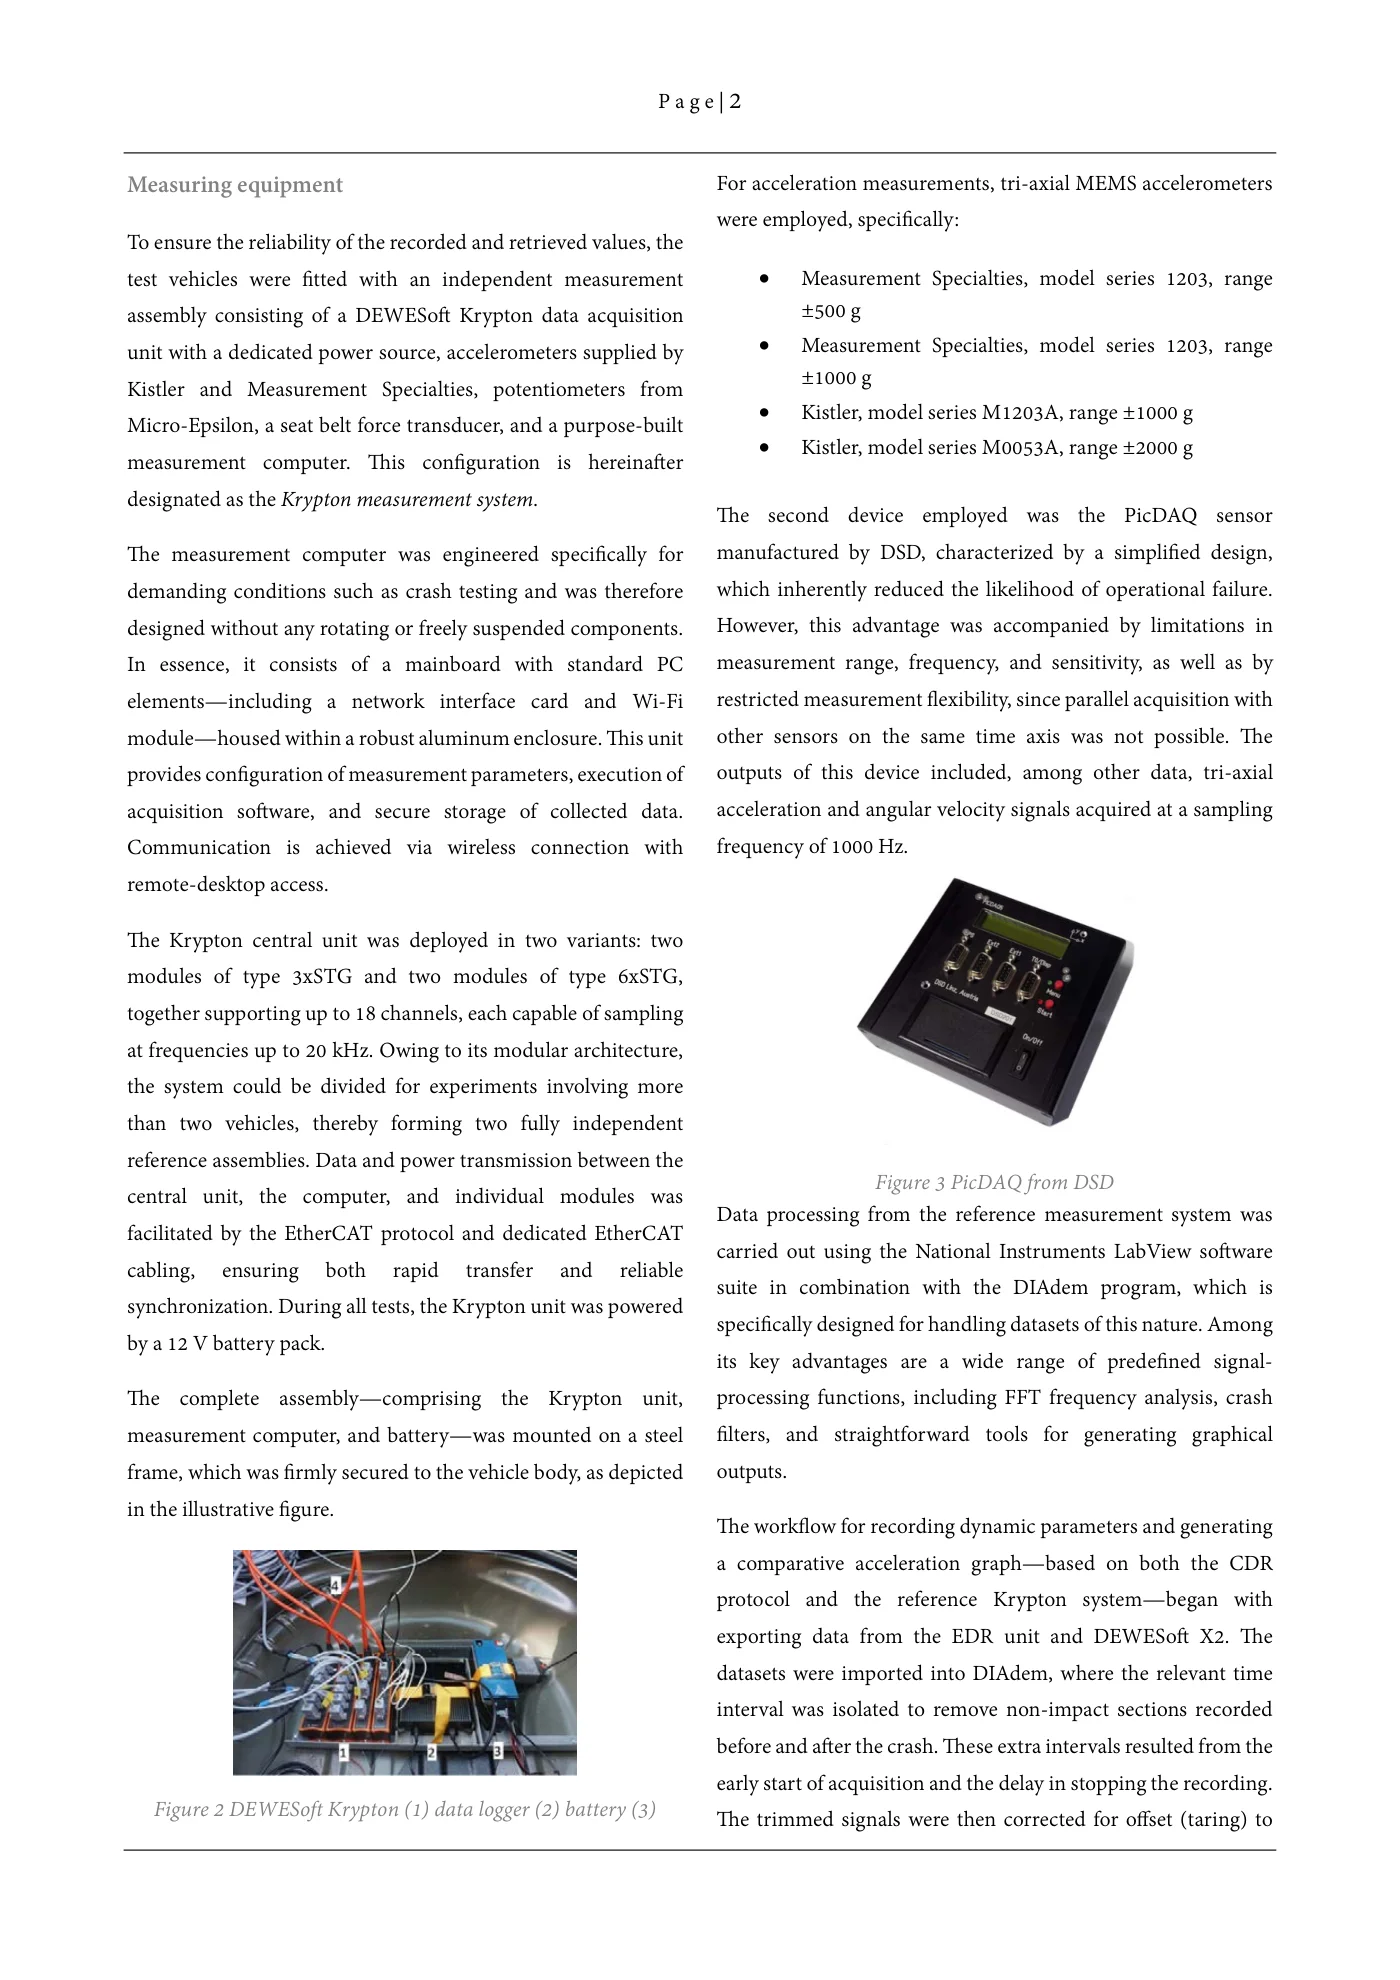
The complete assembly—comprising the Krypton unit, measurement computer, and battery—was mounted on a steel frame, which was firmly secured to the vehicle body, as depicted in the illustrative figure.
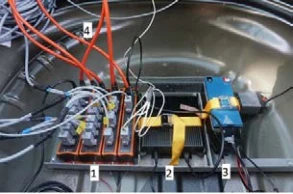
Figure 2 DEWESoft Krypton (1) data logger (2) battery (3)
For acceleration measurements, tri-axial MEMS accelerometers were employed, specifically:
- Measurement Specialties, model series 1203, range ±500 g
- Measurement Specialties, model series 1203, range ±1000 g
- Kistler, model series M1203A, range ±1000 g
- Kistler, model series M0053A, range ±2000 g
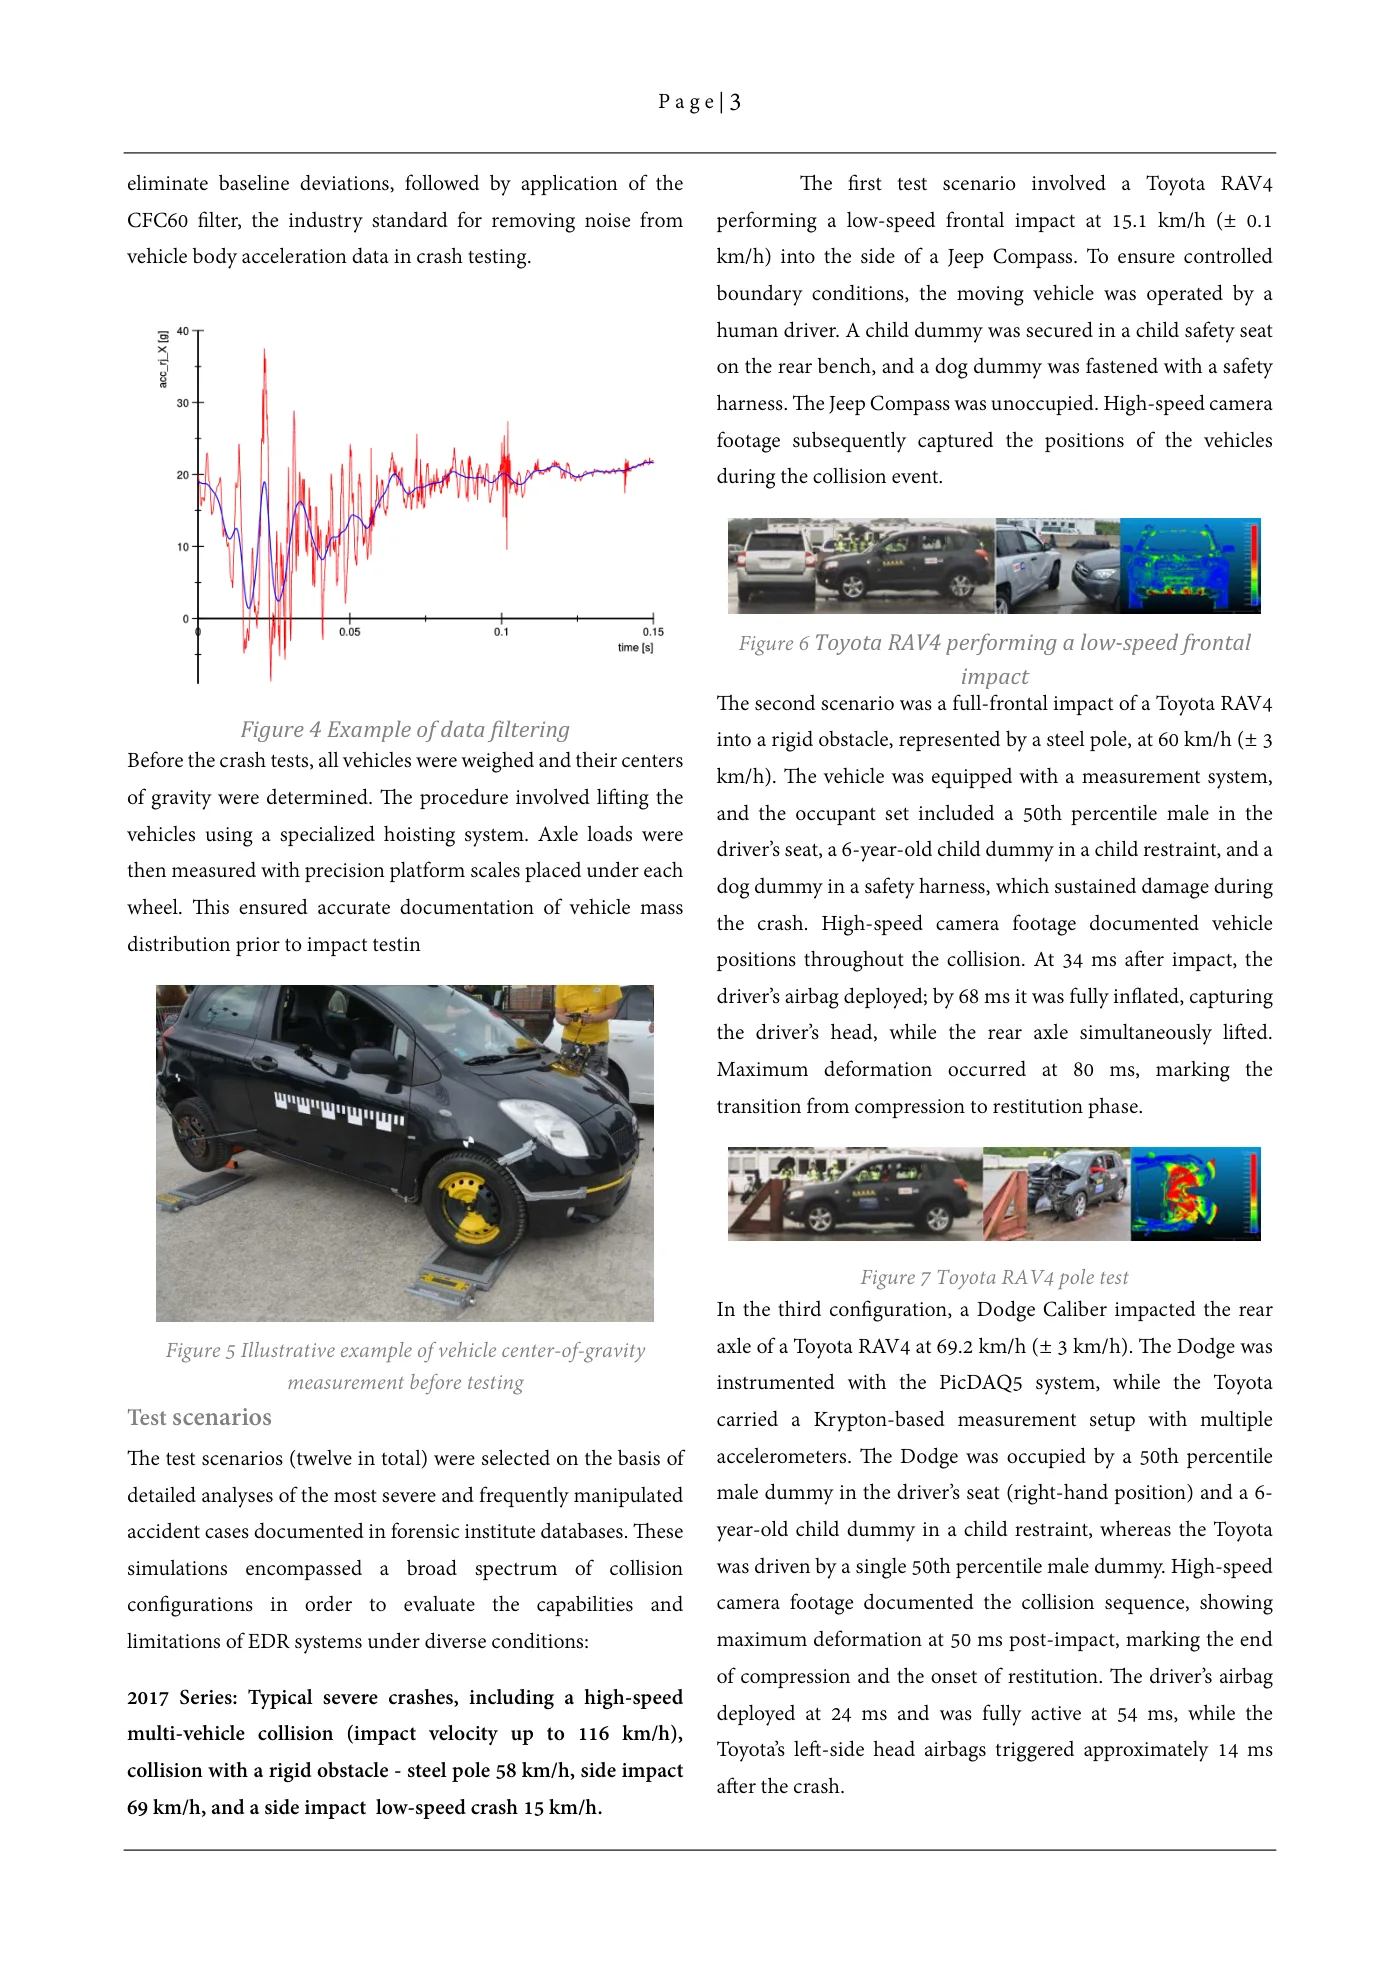
The second device employed was the PicDAQ sensor manufactured by DSD, characterized by a simplified design, which inherently reduced the likelihood of operational failure. However, this advantage was accompanied by limitations in measurement range, frequency, and sensitivity, as well as by restricted measurement flexibility, since parallel acquisition with other sensors on the same time axis was not possible. The outputs of this device included, among other data, tri-axial acceleration and angular velocity signals acquired at a sampling frequency of 1000 Hz.
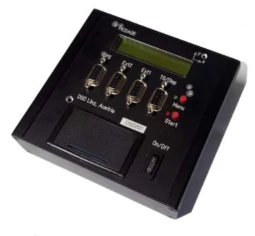
Figure 3 PicDAQ from DSD
Data processing from the reference measurement system was carried out using the National Instruments LabView software suite in combination with the DIAdem program, which is specifically designed for handling datasets of this nature. Among its key advantages are a wide range of predefined signal-processing functions, including FFT frequency analysis, crash filters, and straightforward tools for generating graphical outputs.
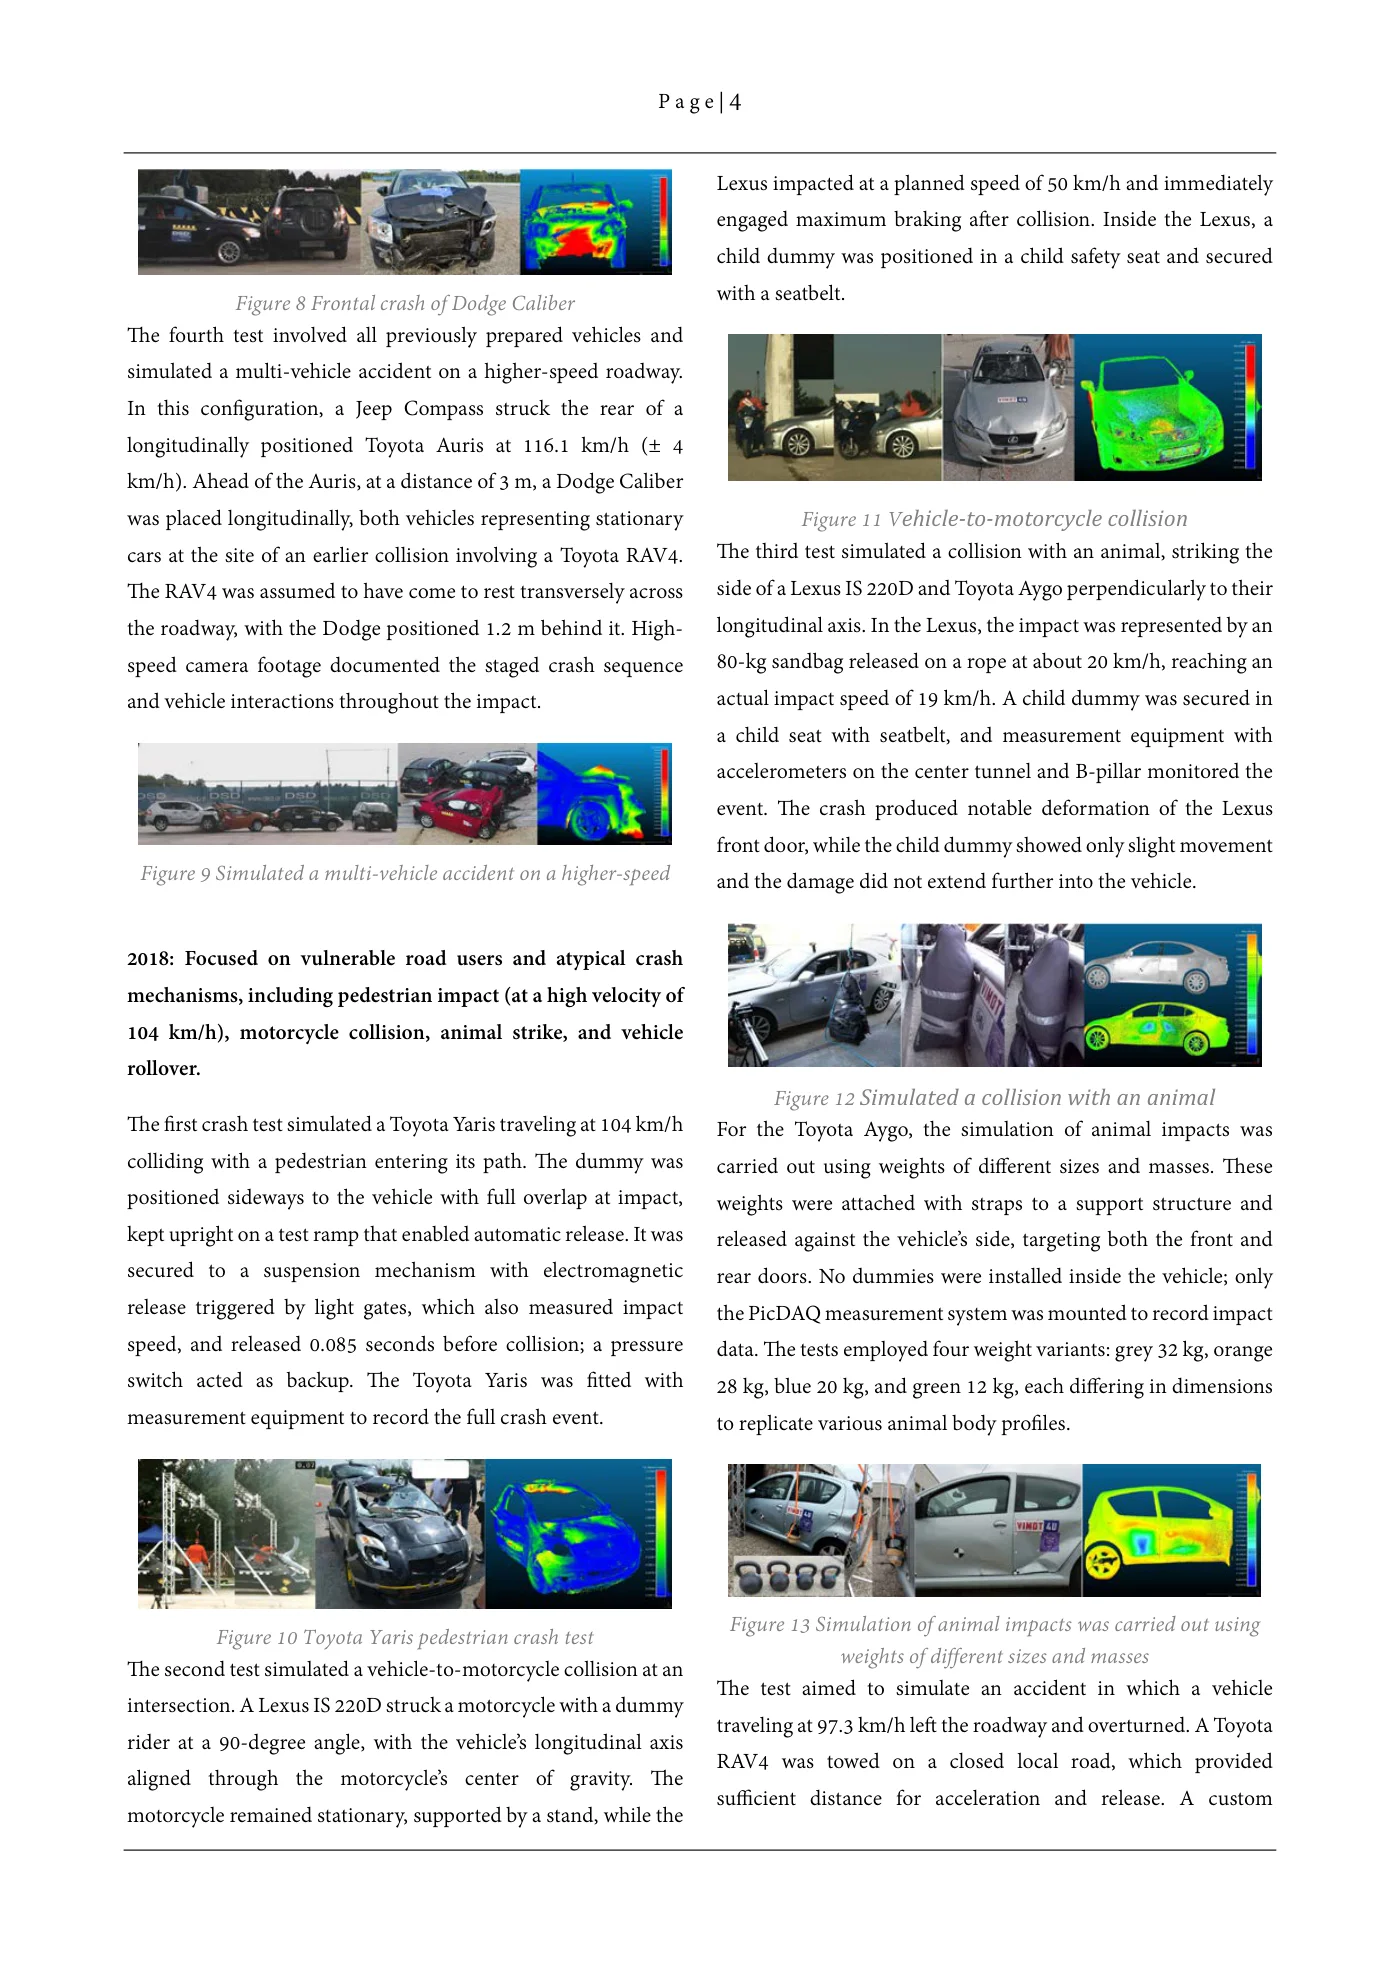
The workflow for recording dynamic parameters and generating a comparative acceleration graph—based on both the CDR protocol and the reference Krypton system—began with exporting data from the EDR unit and DEWESoft X2. The datasets were imported into DIAdem, where the relevant time interval was isolated to remove non-impact sections recorded before and after the crash. These extra intervals resulted from the early start of acquisition and the delay in stopping the recording. The trimmed signals were then corrected for offset (taring) to eliminate baseline deviations, followed by application of the CFC60 filter, the industry standard for removing noise from vehicle body acceleration data in crash testing.
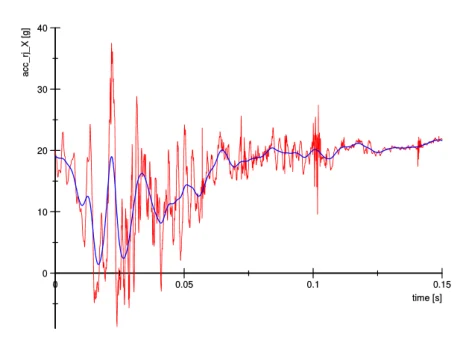
Figure 4 Example of data filtering
Before the crash tests, all vehicles were weighed and their centers of gravity were determined. The procedure involved lifting the vehicles using a specialized hoisting system. Axle loads were then measured with precision platform scales placed under each wheel. This ensured accurate documentation of vehicle mass distribution prior to impact testin
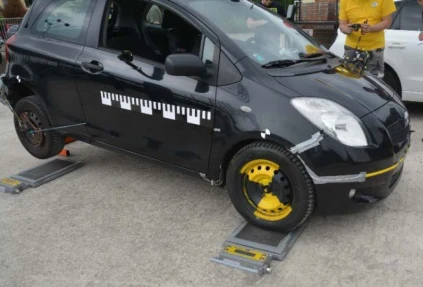
Figure 5 Illustrative example of vehicle center-of-gravity measurement before testing
05 / In this resource
Test scenarios
The test scenarios (twelve in total) were selected on the basis of detailed analyses of the most severe and frequently manipulated accident cases documented in forensic institute databases. These simulations encompassed a broad spectrum of collision configurations in order to evaluate the capabilities and limitations of EDR systems under diverse conditions:
2017 Series: Typical severe crashes, including a high-speed Multi-vehicle collision (impact velocity up to 116 km/H), Collision with a rigid obstacle - steel pole 58 km/H, side impact 69 Km/H, and a side impact low-speed crash 15 km/H.
The first test scenario involved a Toyota RAV4 performing a low-speed frontal impact at 15.1 km/h (± 0.1 km/h) into the side of a Jeep Compass. To ensure controlled boundary conditions, the moving vehicle was operated by a human driver. A child dummy was secured in a child safety seat on the rear bench, and a dog dummy was fastened with a safety harness. The Jeep Compass was unoccupied. High-speed camera footage subsequently captured the positions of the vehicles during the collision event.
Figure 6 Toyota RAV4 performing a low-speed frontal impact
The second scenario was a full-frontal impact of a Toyota RAV4 into a rigid obstacle, represented by a steel pole, at 60 km/h (± 3 km/h). The vehicle was equipped with a measurement system, and the occupant set included a 50th percentile male in the driver’s seat, a 6-year-old child dummy in a child restraint, and a dog dummy in a safety harness, which sustained damage during the crash. High-speed camera footage documented vehicle positions throughout the collision. At 34 ms after impact, the driver’s airbag deployed; by 68 ms it was fully inflated, capturing the driver’s head, while the rear axle simultaneously lifted. Maximum deformation occurred at 80 ms, marking the transition from compression to restitution phase.
Figure 7 Toyota RAV4 pole test
In the third configuration, a Dodge Caliber impacted the rear axle of a Toyota RAV4 at 69.2 km/h (± 3 km/h). The Dodge was instrumented with the PicDAQ5 system, while the Toyota carried a Krypton-based measurement setup with multiple accelerometers. The Dodge was occupied by a 50th percentile male dummy in the driver’s seat (right-hand position) and a 6-year-old child dummy in a child restraint, whereas the Toyota was driven by a single 50th percentile male dummy. High-speed camera footage documented the collision sequence, showing maximum deformation at 50 ms post-impact, marking the end of compression and the onset of restitution. The driver’s airbag deployed at 24 ms and was fully active at 54 ms, while the Toyota’s left-side head airbags triggered approximately 14 ms after the crash.
Figure 8 Frontal crash of Dodge Caliber
The fourth test involved all previously prepared vehicles and simulated a multi-vehicle accident on a higher-speed roadway. In this configuration, a Jeep Compass struck the rear of a longitudinally positioned Toyota Auris at 116.1 km/h (± 4 km/h). Ahead of the Auris, at a distance of 3 m, a Dodge Caliber was placed longitudinally, both vehicles representing stationary cars at the site of an earlier collision involving a Toyota RAV4. The RAV4 was assumed to have come to rest transversely across the roadway, with the Dodge positioned 1.2 m behind it. High-speed camera footage documented the staged crash sequence and vehicle interactions throughout the impact.
Figure 9 Simulated a multi-vehicle accident on a higher-speed
2018: Focused on vulnerable road users and atypical crash Mechanisms, including pedestrian impact (at a high velocity of 104 Km/H), motorcycle collision, animal strike, and vehicle Rollover.
The first crash test simulated a Toyota Yaris traveling at 104 km/h colliding with a pedestrian entering its path. The dummy was positioned sideways to the vehicle with full overlap at impact, kept upright on a test ramp that enabled automatic release. It was secured to a suspension mechanism with electromagnetic release triggered by light gates, which also measured impact speed, and released 0.085 seconds before collision; a pressure switch acted as backup. The Toyota Yaris was fitted with measurement equipment to record the full crash event.
Figure 10 Toyota Yaris pedestrian crash test
The second test simulated a vehicle-to-motorcycle collision at an intersection. A Lexus IS 220D struck a motorcycle with a dummy rider at a 90-degree angle, with the vehicle’s longitudinal axis aligned through the motorcycle’s center of gravity. The motorcycle remained stationary, supported by a stand, while the Lexus impacted at a planned speed of 50 km/h and immediately engaged maximum braking after collision. Inside the Lexus, a child dummy was positioned in a child safety seat and secured with a seatbelt.
Figure 11 Vehicle-to-motorcycle collision
The third test simulated a collision with an animal, striking the side of a Lexus IS 220D and Toyota Aygo perpendicularly to their longitudinal axis. In the Lexus, the impact was represented by an 80-kg sandbag released on a rope at about 20 km/h, reaching an actual impact speed of 19 km/h. A child dummy was secured in a child seat with seatbelt, and measurement equipment with accelerometers on the center tunnel and B-pillar monitored the event. The crash produced notable deformation of the Lexus front door, while the child dummy showed only slight movement and the damage did not extend further into the vehicle.
Figure 12 Simulated a collision with an animal
For the Toyota Aygo, the simulation of animal impacts was carried out using weights of different sizes and masses. These weights were attached with straps to a support structure and released against the vehicle’s side, targeting both the front and rear doors. No dummies were installed inside the vehicle; only the PicDAQ measurement system was mounted to record impact data. The tests employed four weight variants: grey 32 kg, orange 28 kg, blue 20 kg, and green 12 kg, each differing in dimensions to replicate various animal body profiles.
Figure 13 Simulation of animal impacts was carried out using weights of different sizes and masses
The test aimed to simulate an accident in which a vehicle traveling at 97.3 km/h left the roadway and overturned. A Toyota RAV4 was towed on a closed local road, which provided sufficient distance for acceleration and release. A custom synchronization mechanism, developed within the VIMOT project, enabled controlled towing, detachment, and automatic right steering of the RAV4 to induce rollover. Inside the vehicle were two unbelted dummies in the front seats and a child dummy secured in a safety seat behind the driver. For safety, the Toyota was equipped with a remotely controlled emergency braking system in case of uncontrolled trajectory.
Figure 14 Roll over crash test
2019 Series: Addressed lateral and longitudinal impacts, such As a side collision of two parallel-moving vehicles, frontal Impact into the rear of a braking vehicle, and head-on collisions With stationary vehicles.
A side-impact crash test was conducted involving two passenger vehicles traveling in parallel trajectories and in the same direction of motion. In this scenario, a Toyota Auris, positioned in the notional left traffic lane and maintaining a velocity of 50 km/h, was impacted laterally on its right-hand side doors. The colliding vehicle, a Toyota Aygo, was traveling in the adjacent notional right lane at an identical speed of 50 km/h, and its trajectory intersected the Auris, producing the side impact.
Figure 15 Crash test involving two passenger vehicles traveling in parallel trajectories
The second test simulated a frontal impact into the left rear corner of a braking vehicle. The scenario represented a Toyota Aygo performing sudden emergency braking while simultaneously steering left, followed closely by a Toyota Auris that, due to driver inattention or insufficient reaction time, collided with the Aygo. During the impact, the change in velocity was sufficient for the EDR systems of both vehicles to successfully record crash event data. According to these data, the Toyota Aygo decelerated from 34 km/h to a complete stop within 5 seconds, with the last recorded value of 6 km/h at 0.5 s before impact and 0 km/h at the moment of collision, while the Toyota Auris reduced speed from 36 km/h to 23 km/h, which was the velocity at impact.
Figure 16 Frontal impact into the rear section of another vehicle
The objective of third test was to conduct a crash experiment involving a Dodge Caliber and a Toyota Aygo. The Dodge Caliber was accelerated along a rail system by means of a pulley and steel cable, counterbalanced by a driven Škoda Superb, to reach an impact velocity of 49 km/h. The vehicle subsequently collided frontally with the stationary Toyota Aygo, positioned several meters beyond the end of the rail. The collision resulted in the Dodge decelerating to 28 km/h and the Aygo being accelerated to 37 km/h.
Figure 17 Frontal collision of vehicles
The aim of this test was to perform a crash experiment with a Volvo V60 and a Toyota Auris. The Volvo V60 was accelerated along a rail system, using the same pulley-and-cable method with a counterbalancing Škoda Superb, to an impact speed of 48 km/h. It then collided with the rear of a stationary Toyota Auris placed a few meters beyond the rail. For the Auris, battery voltage was intentionally reduced to 10.34 V to assess EDR functionality under simulated electrical faults. The test also served to validate the proposed methodology, including potential use of external power or removal of the EDR unit, with the results integrated into the final procedure.
Figure 18 Frontal impact into the rear section of another vehicle
06 / In this resource
EDR data storage in ACMs
All ACM units were dismantled from the vehicles and subsequently stored under room stable conditions. After a period of five to seven years, the modules were re-examined to evaluate their functionality and data retention. In the initial phase, the units were disassembled to identify the type of memory used for storing EDR crash data. The investigation revealed that in all cases, the data were retained in EEPROM memory. This finding confirmed the non-volatile nature of storage within the ACM units, ensuring data preservation even after extended storage periods.
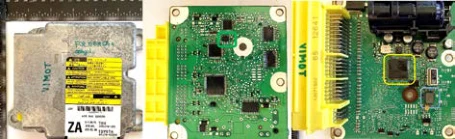
Figure 19 ACM unit from a Toyota Auris. Green – EEPROM, Yellow – Processor, Blue – Accelerometer
MEMS accelerometer
An example of the sensing elements integrated in Airbag Control Modules (ACMs) is the VTI Technologies SCA2100-D01, a two-axis MEMS accelerometer later manufactured by Murata Electronics. This device measures acceleration along the X and Y axes and is optimized for automotive safety applications. Within the ACM, it provides critical input data for airbag deployment logic, Electronic Stability Control, and Event Data Recorder functionality. Its robust design, with high resistance to vibration and temperature, together with an SPI digital interface, ensures reliable operation under demanding vehicle conditions.
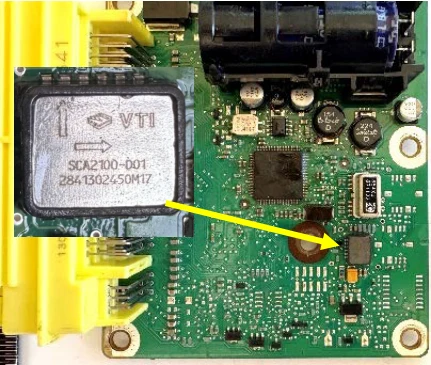
Figure 20 VTI Technologies SCA2100-D01, a two-axis MEMS accelerometer
07 / In this resource
Structure and function of EEPROM memories
EEPROM (Electrically Erasable Programmable Read-Only Memory) is a semiconductor memory that allows digital data to be retained even after power is removed. It is based on MOS transistor technology with a so-called floating gate.
The memory is implemented as a matrix of transistors on a silicon chip. Each memory cell consists of a MOSFET transistor with a special structure, where a floating gate isolated by a thin layer of silicon oxide is located between the control gate and the channel. Electrons are stored in this gate, representing the stored information (logical “0” or “1”). Physically, it is a silicon wafer with a network of transistors and conductors, encapsulated in a plastic or ceramic package with external pins.
Writing and erasing of data is performed electrically – by applying a high voltage (typically 10–20 V), electrons are injected into or removed from the floating gate through the thin oxide barrier using Fowler–Nordheim tunneling or hot-carrier injection. If electrons are present in the floating gate, the transistor is in a different conduction state than when the gate is empty. This state can be read as a logical “0” or “1.” Reading is performed at normal supply voltage – the control circuitry measures whether the transistor conducts current or not, thereby determining the stored bit.
The advantage of EEPROM over classic ROM or PROM is the ability to be rewritten many times (typically 10⁴ to 10⁶ cycles).
EEPROM retains data because the electrons trapped in the floating gate of the MOSFET transistor are isolated by a silicon oxide layer with extremely high electrical resistance. This insulator practically prevents the spontaneous leakage of charge.
Technical note:
- Typical data retention of commercially manufactured EEPROM memories is 10 to 20 years at room temperature (25 °C).
- In industrial and automotive applications, manufacturers often guarantee at least 10 years of data retention even without power.
- At elevated temperatures (above 85 °C), electron leakage from the floating gate accelerates, reducing retention (e.g., from 20 years to about 5–7 years)
- Under normal automotive operating conditions, data are expected to remain stable throughout the vehicle’s lifetime.
The stability of the stored charge is determined by the quality of the oxide layer, dielectric thickness, and the tunneling mechanism. Fowler–Nordheim tunneling current is exponentially dependent on oxide thickness and the electric field. In the absence of power, the electric field is minimal, so electron leakage is negligible, and the memory retains its content for many years. Experimental studies have shown that well-designed EEPROM cells can retain readable data for more than 30 years under laboratory conditions.
A future articles will also address methods of re-establishing communication with stored modules, including the use of dedicated cabling or CAN pinouts, direct EEPROM access on the PCB or after chip removal, and the correct CAN pin connections based on wiring schematics.
08 / In this resource
Acquisition of EDR data from ACM units
To obtain the EDR data, Collision Sciences CrashScan and Bosch CDR were used, which are currently the two most accessible diagnostic tools. Both operate on different licensing principles and apply distinct fee structures for data access. This aspect has direct implications for their availability and cost-effectiveness in forensic practice. A comparative table is provided below.
Data acquisition with Collision Sciences CrashScan
Event Data Recorder (EDR) information stored in the Airbag Control Modules (ACMs) was extracted using the CrashScan application in combination with the dedicated hardware kit EDRlab Kit. It should be emphasized that the CrashScan application is fully capable of performing in-vehicle EDR retrieval as well, by connecting to the diagnostic interface of an intact vehicle. Nevertheless, for the methodological reasons described above, the bench-top extraction procedure was employed in this study.
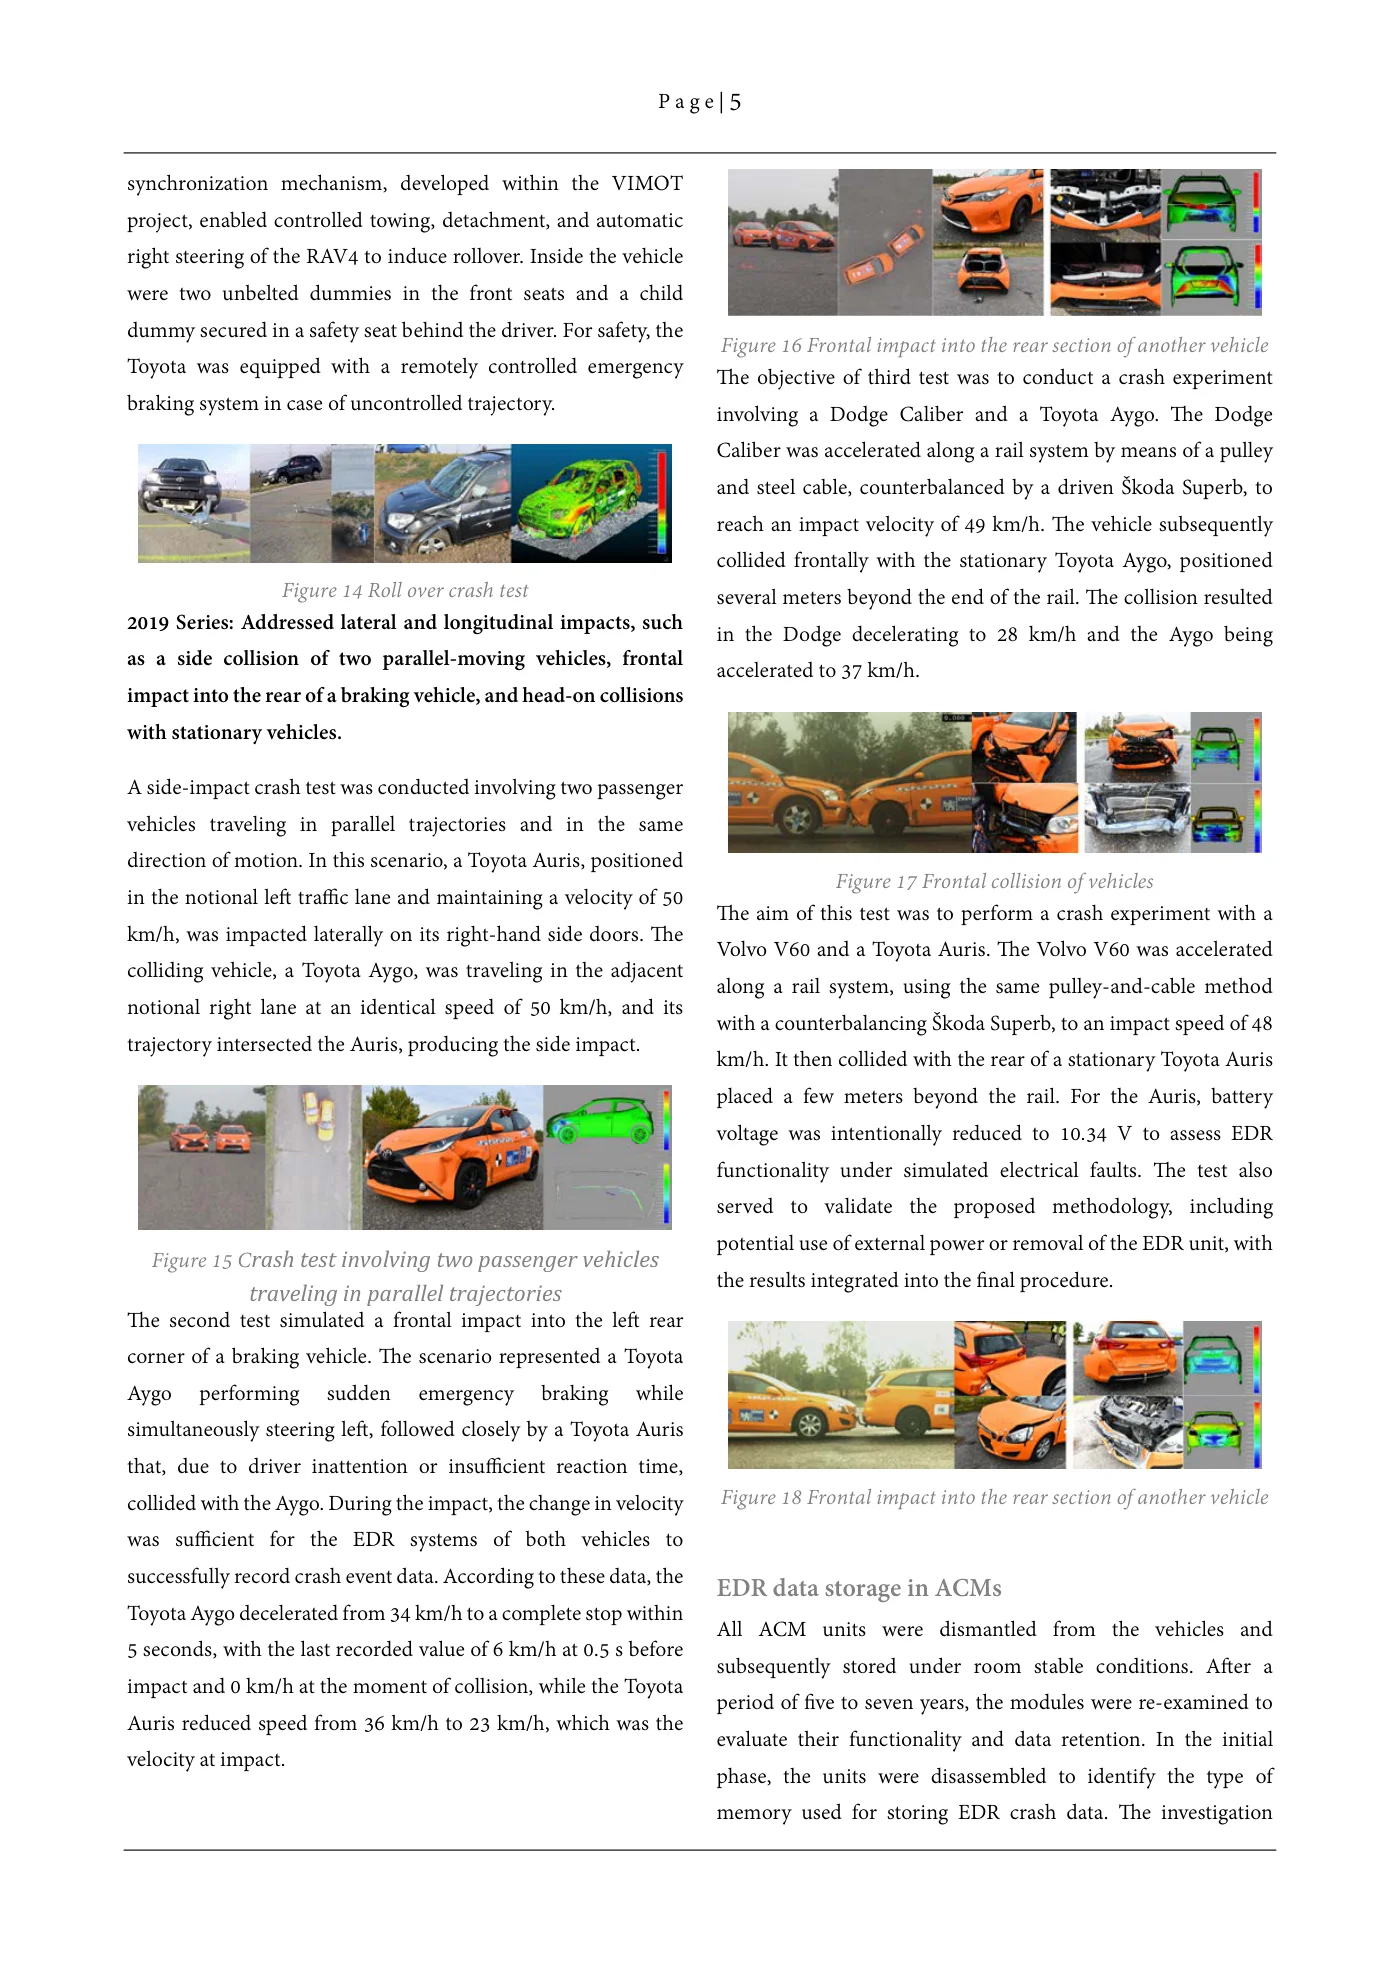
Proper network termination is achieved simply by adding the supplied 60-Ω or 120-Ω resistor, selected to suit the bus topology under examination. The image shows an OBD Breakout Cable [60 Ω and 120 Ω]. The cable consists of several wires, each color-coded and corresponding to a specific OBD pin according to the pinout. The diagnostic connector uses the following pin configuration: Pin 1 (Purple) – SWCAN, Pin 2 (Brown) – VPW, Pin 5 (Black) – Ground, Pin 6 (Yellow) – CAN High, Pin 7 (Green) – K-Line, Pin 14 (Blue) – CAN Low, and Pin 16 (Red) – DC +12 V. The breakout cable is used for connecting directly to control units, such as airbag modules, during diagnostics or EDR/Crash data extraction.
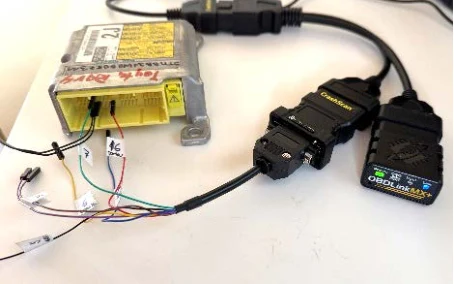
Figure 21 CrashScan OBD LAB Kit and breakout cable connected to Toyota RAV4 ACM
A principal advantage of CrashScan bench-top connectivity is that no dedicated harnesses are needed for each individual control module. The application provides precise pin-out diagrams, and the kit includes a set of small jumper pins that are inserted according to the illustrated wiring scheme. This approach removes the burden of stocking dozens of OEM break-out cables while still delivering the correct power, CAN-H/CAN-L,K-line and ignition references to the target ECU.
Data acquisition with Bosch CDR
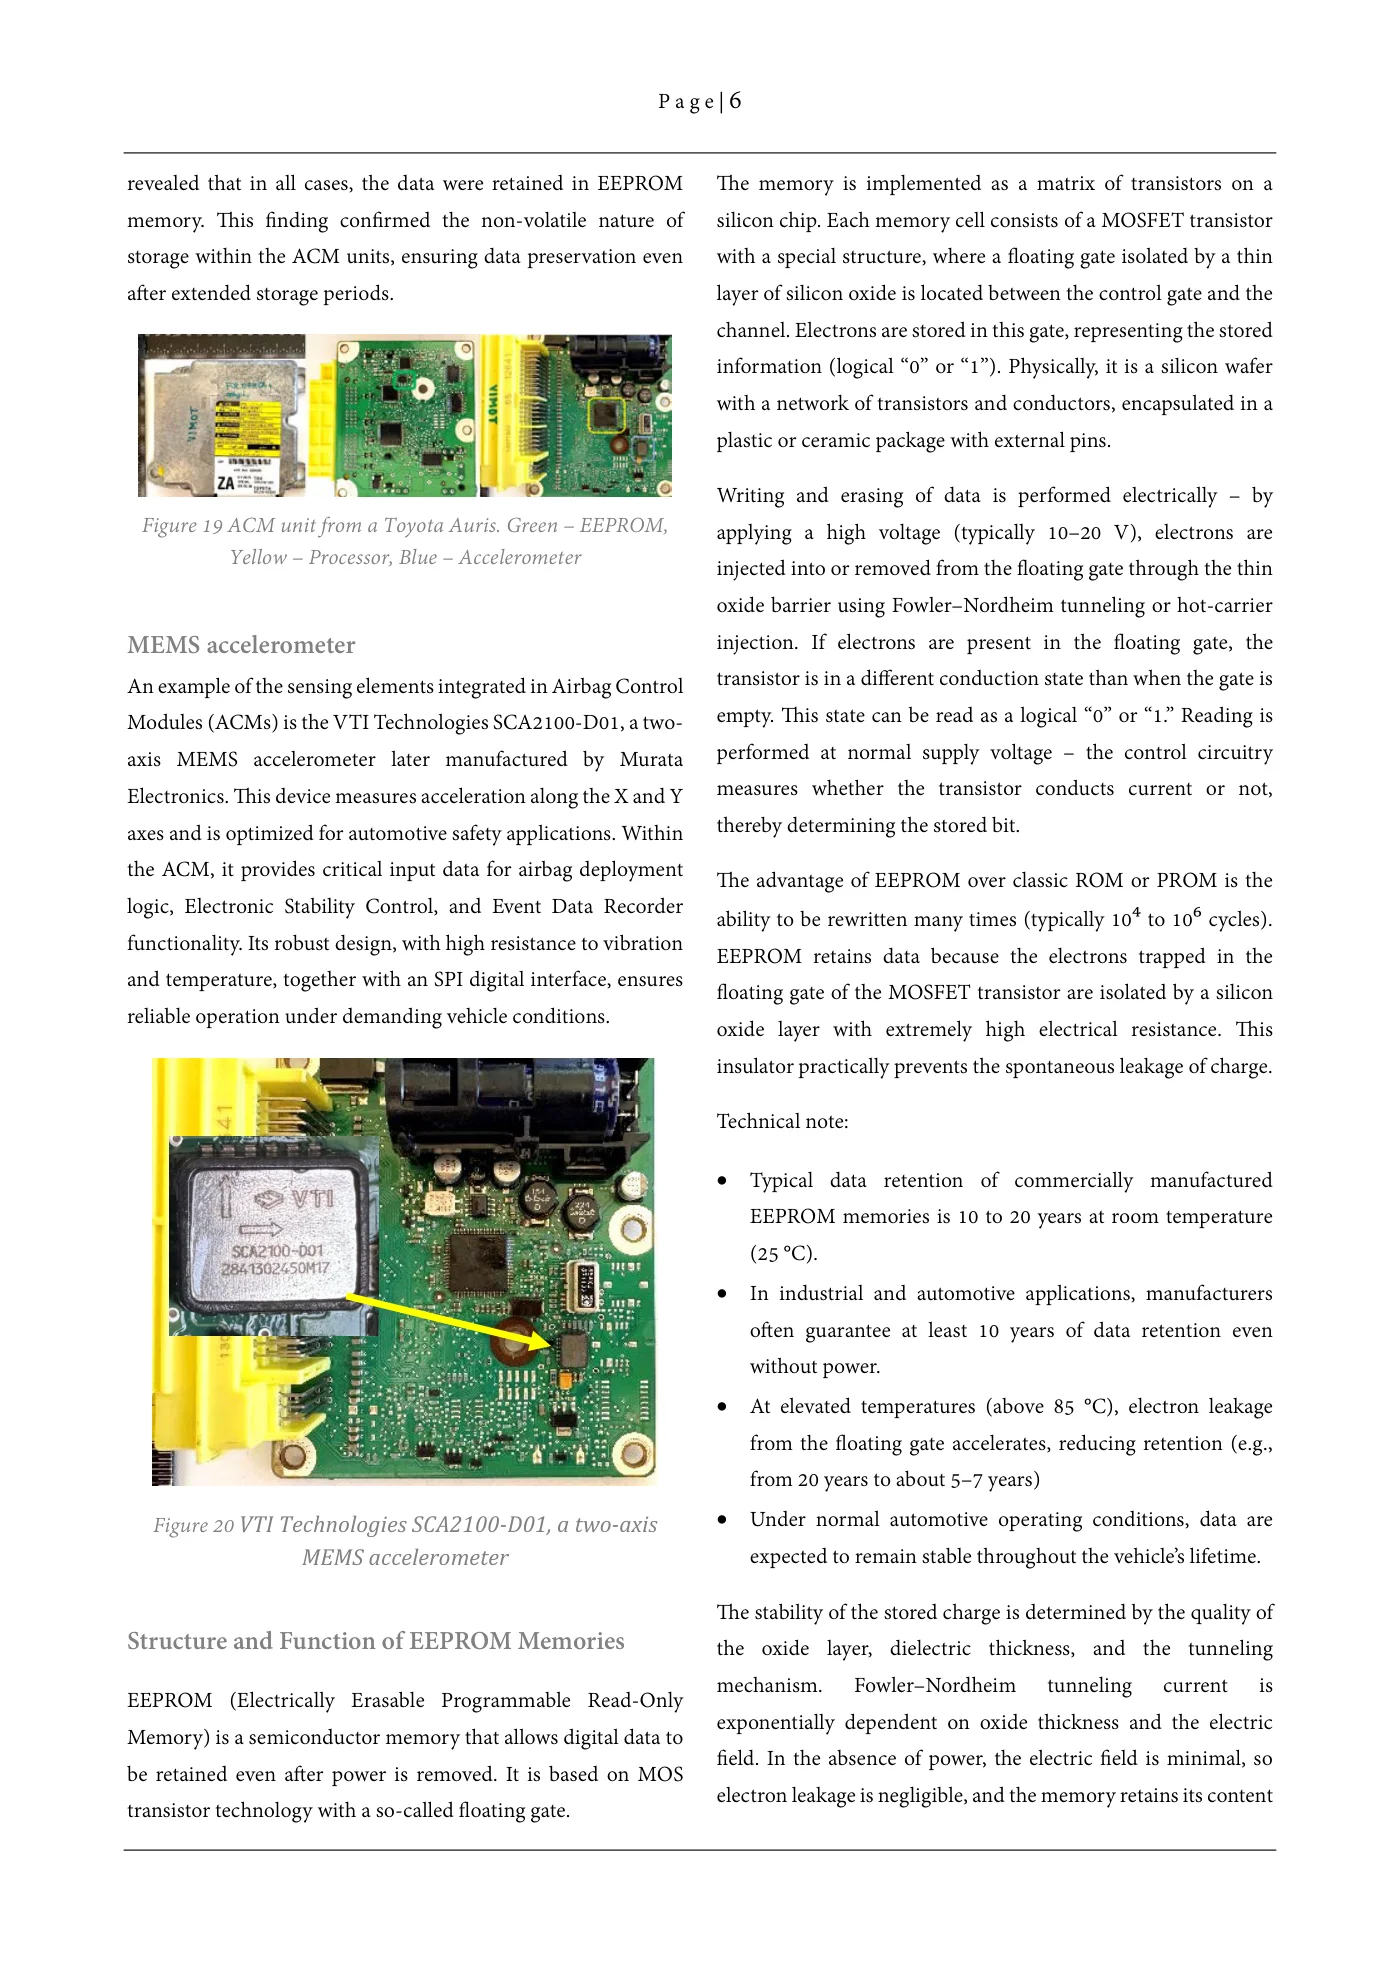
The Bosch CDR is an established tool for retrieving EDR data. Its main advantage lies in the straightforward and unambiguous connection of a dedicated diagnostic cable directly to the control unit. From a general perspective, however, it is not always entirely clear which pins in the connector are populated and which remain unused.
For the purpose of repeated data retrieval, all units were supported by Bosch CDR CAN Plus, and some units were also compatible with Bosch CDR 900. Unlike CrashScan, Bosch CDR uses dedicated cables for connecting the CDR interface with the ACM. The attached table specifies which connection cable was required for each vehicle.
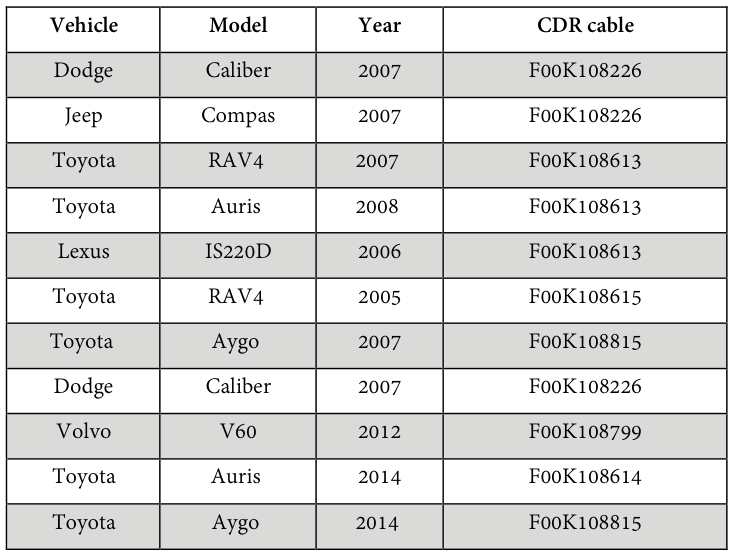
Read extracted table text
The image preserves the original columns. Extracted text below is retained for accessibility; refer to the table image or PDF for row and column relationships.
Vehicle model year CDR cable
Dodge Caliber 2007 F00K108226 Jeep Compas 2007 F00K108226 Toyota RAV4 2007 F00K108613 Toyota Auris 2008 F00K108613 Lexus IS220D 2006 F00K108613 Toyota RAV4 2005 F00K108615 Toyota Aygo 2007 F00K108815 Dodge Caliber 2007 F00K108226 Volvo V60 2012 F00K108799 Toyota Auris 2014 F00K108614 Toyota Aygo 2014 F00K108815
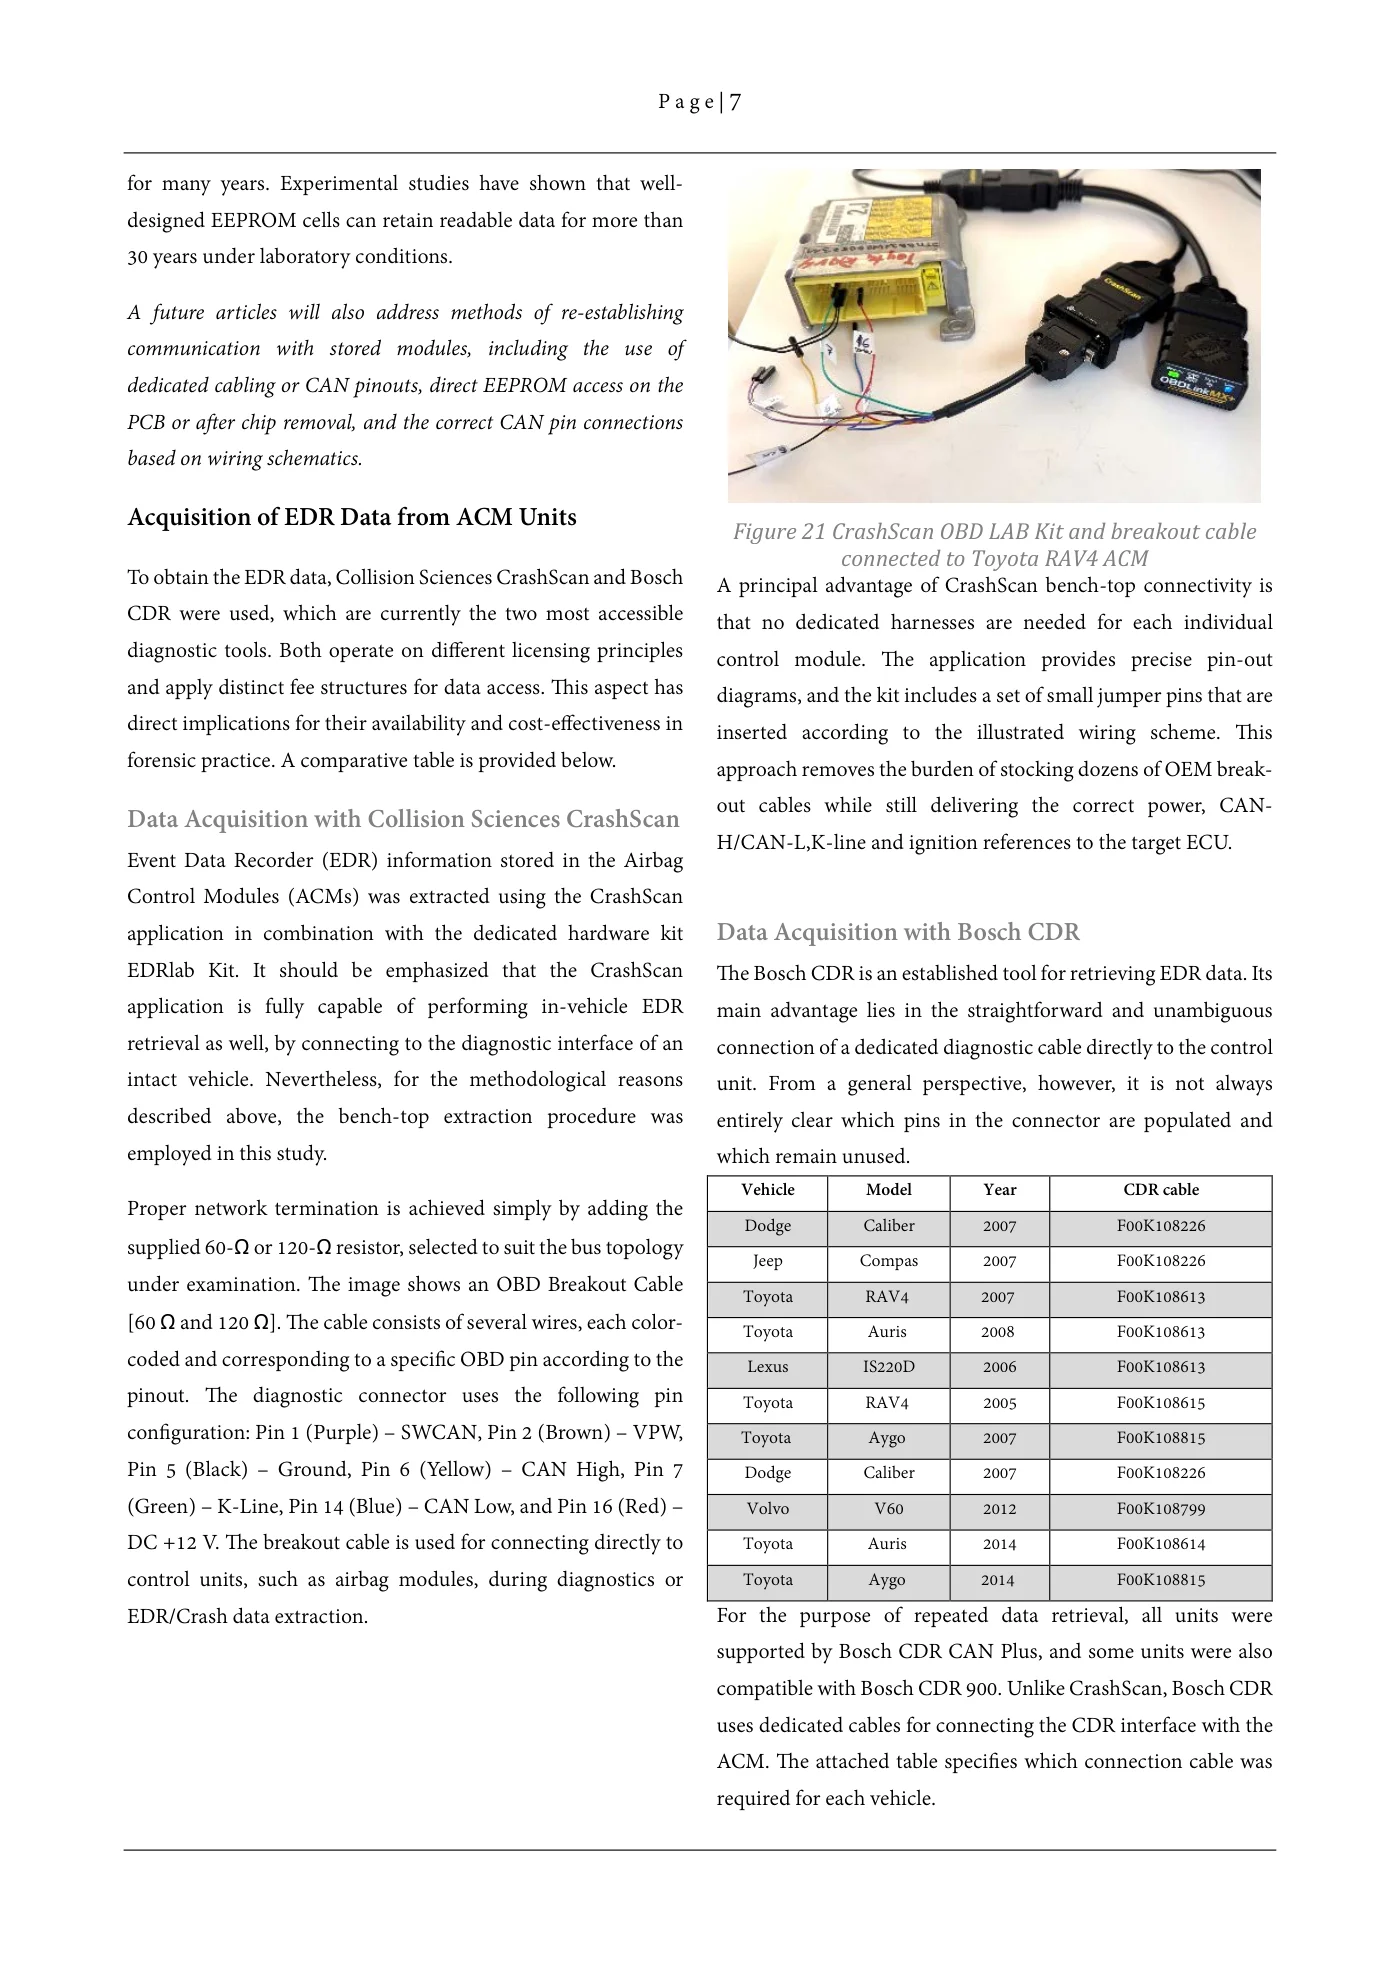
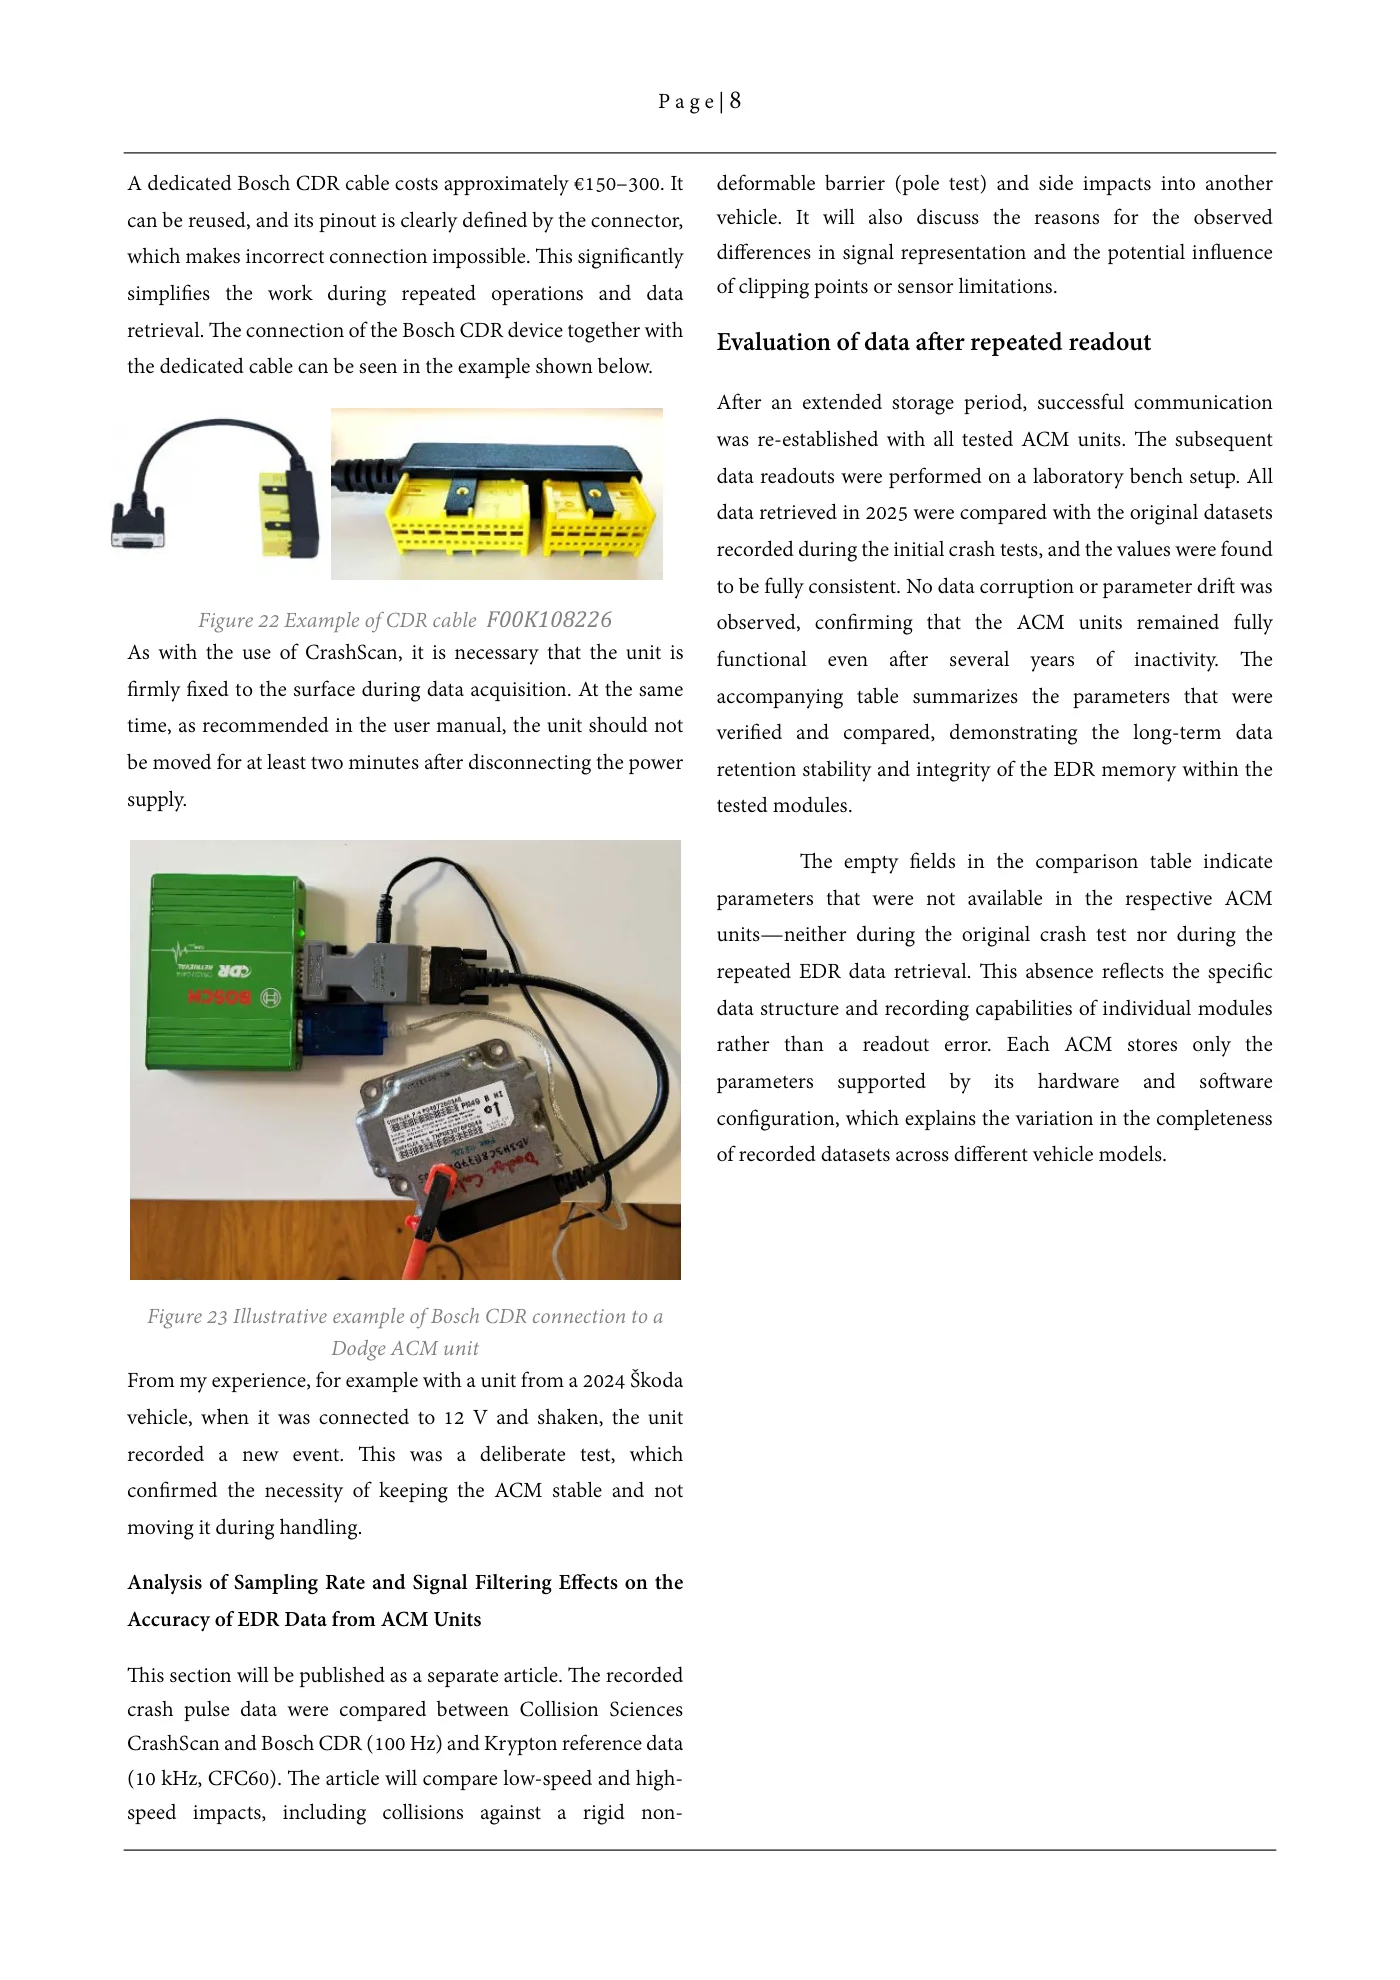
A dedicated Bosch CDR cable costs approximately €150–300. It can be reused, and its pinout is clearly defined by the connector, which makes incorrect connection impossible. This significantly simplifies the work during repeated operations and data retrieval. The connection of the Bosch CDR device together with the dedicated cable can be seen in the example shown below.
Figure 22 Example of CDR cable F00K108226
As with the use of CrashScan, it is necessary that the unit is firmly fixed to the surface during data acquisition. At the same time, as recommended in the user manual, the unit should not be moved for at least two minutes after disconnecting the power supply.
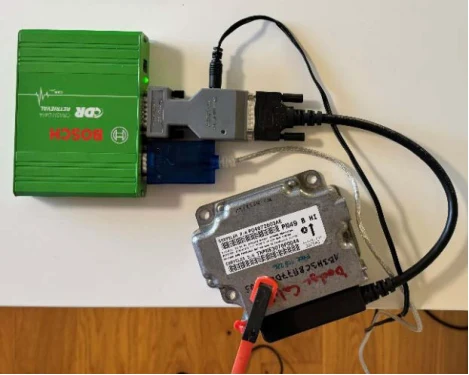
Figure 23 Illustrative example of Bosch CDR connection to a Dodge ACM unit
From my experience, for example with a unit from a 2024 Škoda vehicle, when it was connected to 12 V and shaken, the unit recorded a new event. This was a deliberate test, which confirmed the necessity of keeping the ACM stable and not moving it during handling.
09 / In this resource
Analysis of sampling rate and signal filtering effects on the accuracy of EDR data from ACM units
This section will be published as a separate article. The recorded crash pulse data were compared between Collision Sciences CrashScan and Bosch CDR (100 Hz) and Krypton reference data (10 kHz, CFC60). The article will compare low-speed and high-speed impacts, including collisions against a rigid non-deformable barrier (pole test) and side impacts into another vehicle. It will also discuss the reasons for the observed differences in signal representation and the potential influence of clipping points or sensor limitations.
10 / In this resource
Evaluation of data after repeated readout
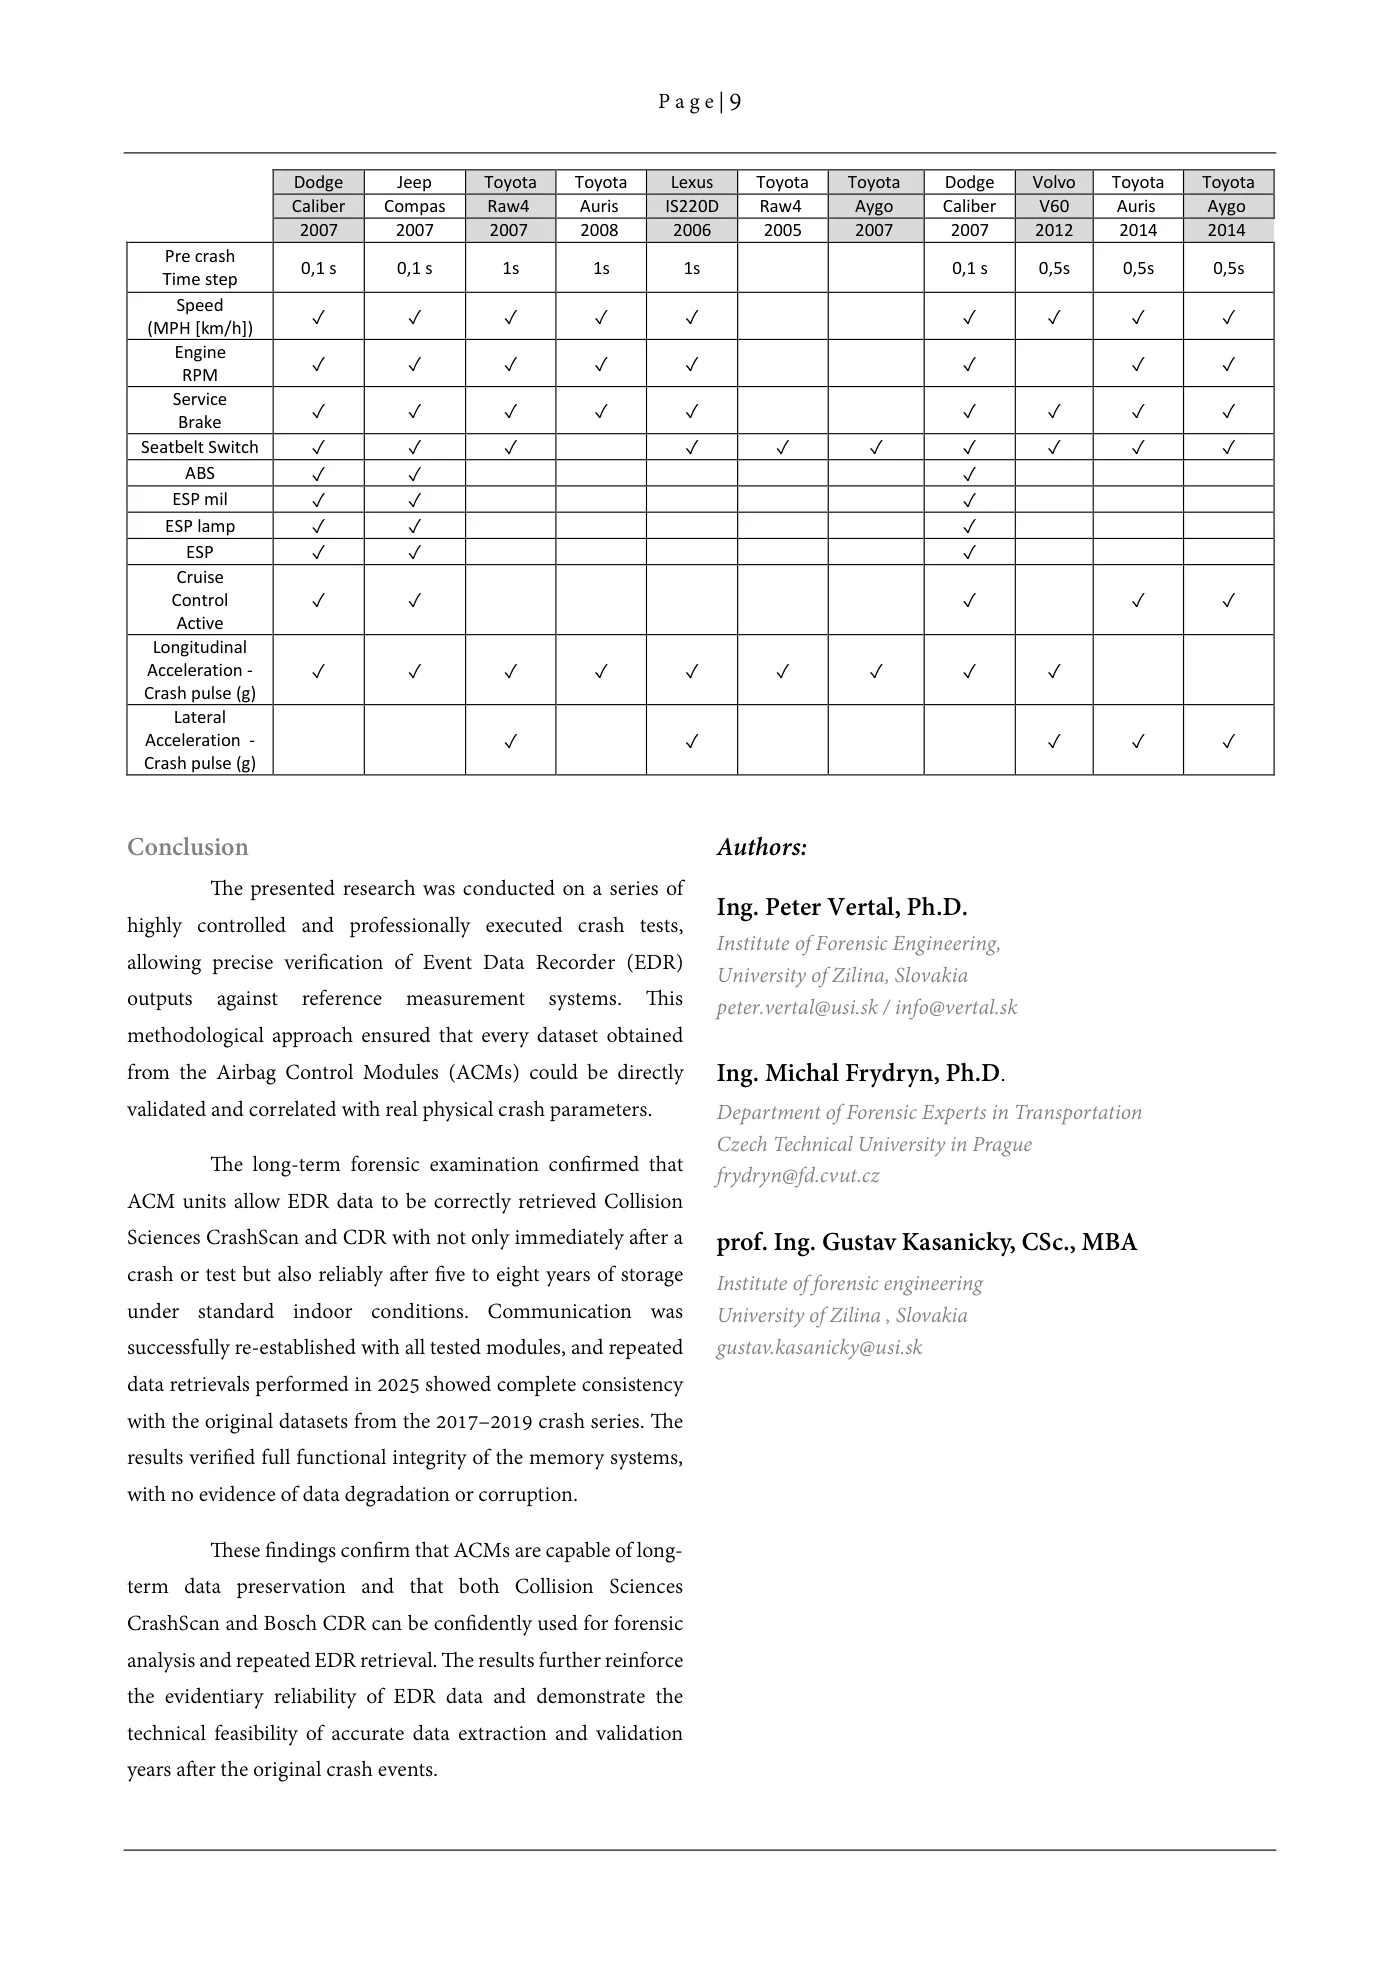
After an extended storage period, successful communication was re-established with all tested ACM units. The subsequent data readouts were performed on a laboratory bench setup. All data retrieved in 2025 were compared with the original datasets recorded during the initial crash tests, and the values were found to be fully consistent. No data corruption or parameter drift was observed, confirming that the ACM units remained fully functional even after several years of inactivity. The accompanying table summarizes the parameters that were verified and compared, demonstrating the long-term data retention stability and integrity of the EDR memory within the tested modules.
The empty fields in the comparison table indicate parameters that were not available in the respective ACM units—neither during the original crash test nor during the repeated EDR data retrieval. This absence reflects the specific data structure and recording capabilities of individual modules rather than a readout error. Each ACM stores only the parameters supported by its hardware and software configuration, which explains the variation in the completeness of recorded datasets across different vehicle models.
Dodge Jeep Toyota Toyota Lexus Toyota Toyota Dodge Volvo Toyota Toyota Caliber Compas Raw4 Auris IS220D Raw4 Aygo Caliber V60 Auris Aygo 2007 2007 2007 2008 2006 2005 2007 2007 2012 2014 2014
Pre crash Time step 0,1 s 0,1 s 1s 1s 1s 0,1 s 0,5s 0,5s 0,5s
Speed (MPH [km/h]) ✓✓✓✓✓ ✓✓✓✓ Engine RPM ✓✓✓✓✓ ✓ ✓✓ Service Brake ✓✓✓✓✓ ✓✓✓✓
Seatbelt Switch ✓✓✓ ✓✓✓✓✓✓✓ ABS ✓✓ ✓ ESP mil ✓✓ ✓ ESP lamp ✓✓ ✓ ESP ✓✓ ✓ Cruise Control Active ✓✓ ✓ ✓✓
Longitudinal Acceleration -Crash pulse (g) ✓✓✓✓✓✓✓✓✓
Lateral Acceleration -Crash pulse (g) ✓ ✓ ✓✓✓
11 / In this resource
Conclusion
The presented research was conducted on a series of highly controlled and professionally executed crash tests, allowing precise verification of Event Data Recorder (EDR) outputs against reference measurement systems. This methodological approach ensured that every dataset obtained from the Airbag Control Modules (ACMs) could be directly validated and correlated with real physical crash parameters.
The long-term forensic examination confirmed that ACM units allow EDR data to be correctly retrieved Collision Sciences CrashScan and CDR with not only immediately after a crash or test but also reliably after five to eight years of storage under standard indoor conditions. Communication was successfully re-established with all tested modules, and repeated data retrievals performed in 2025 showed complete consistency with the original datasets from the 2017–2019 crash series. The results verified full functional integrity of the memory systems, with no evidence of data degradation or corruption.
These findings confirm that ACMs are capable of long-term data preservation and that both Collision Sciences CrashScan and Bosch CDR can be confidently used for forensic analysis and repeated EDR retrieval. The results further reinforce the evidentiary reliability of EDR data and demonstrate the technical feasibility of accurate data extraction and validation years after the original crash events.
12 / In this resource
Authors:
Ing. Peter Vertal, Ph.D.
Institute of Forensic Engineering, University of Zilina, Slovakia peter.vertal@usi.sk / info@vertal.sk
Ing. Michal Frydryn, Ph.D.
Department of Forensic Experts in Transportation Czech Technical University in Prague frydryn@fd.cvut.cz
prof. Ing. Gustav Kasanicky, CSc., MBA
Institute of forensic engineering University of Zilina , Slovakia gustav.kasanicky@usi.sk