
Read page 1 text
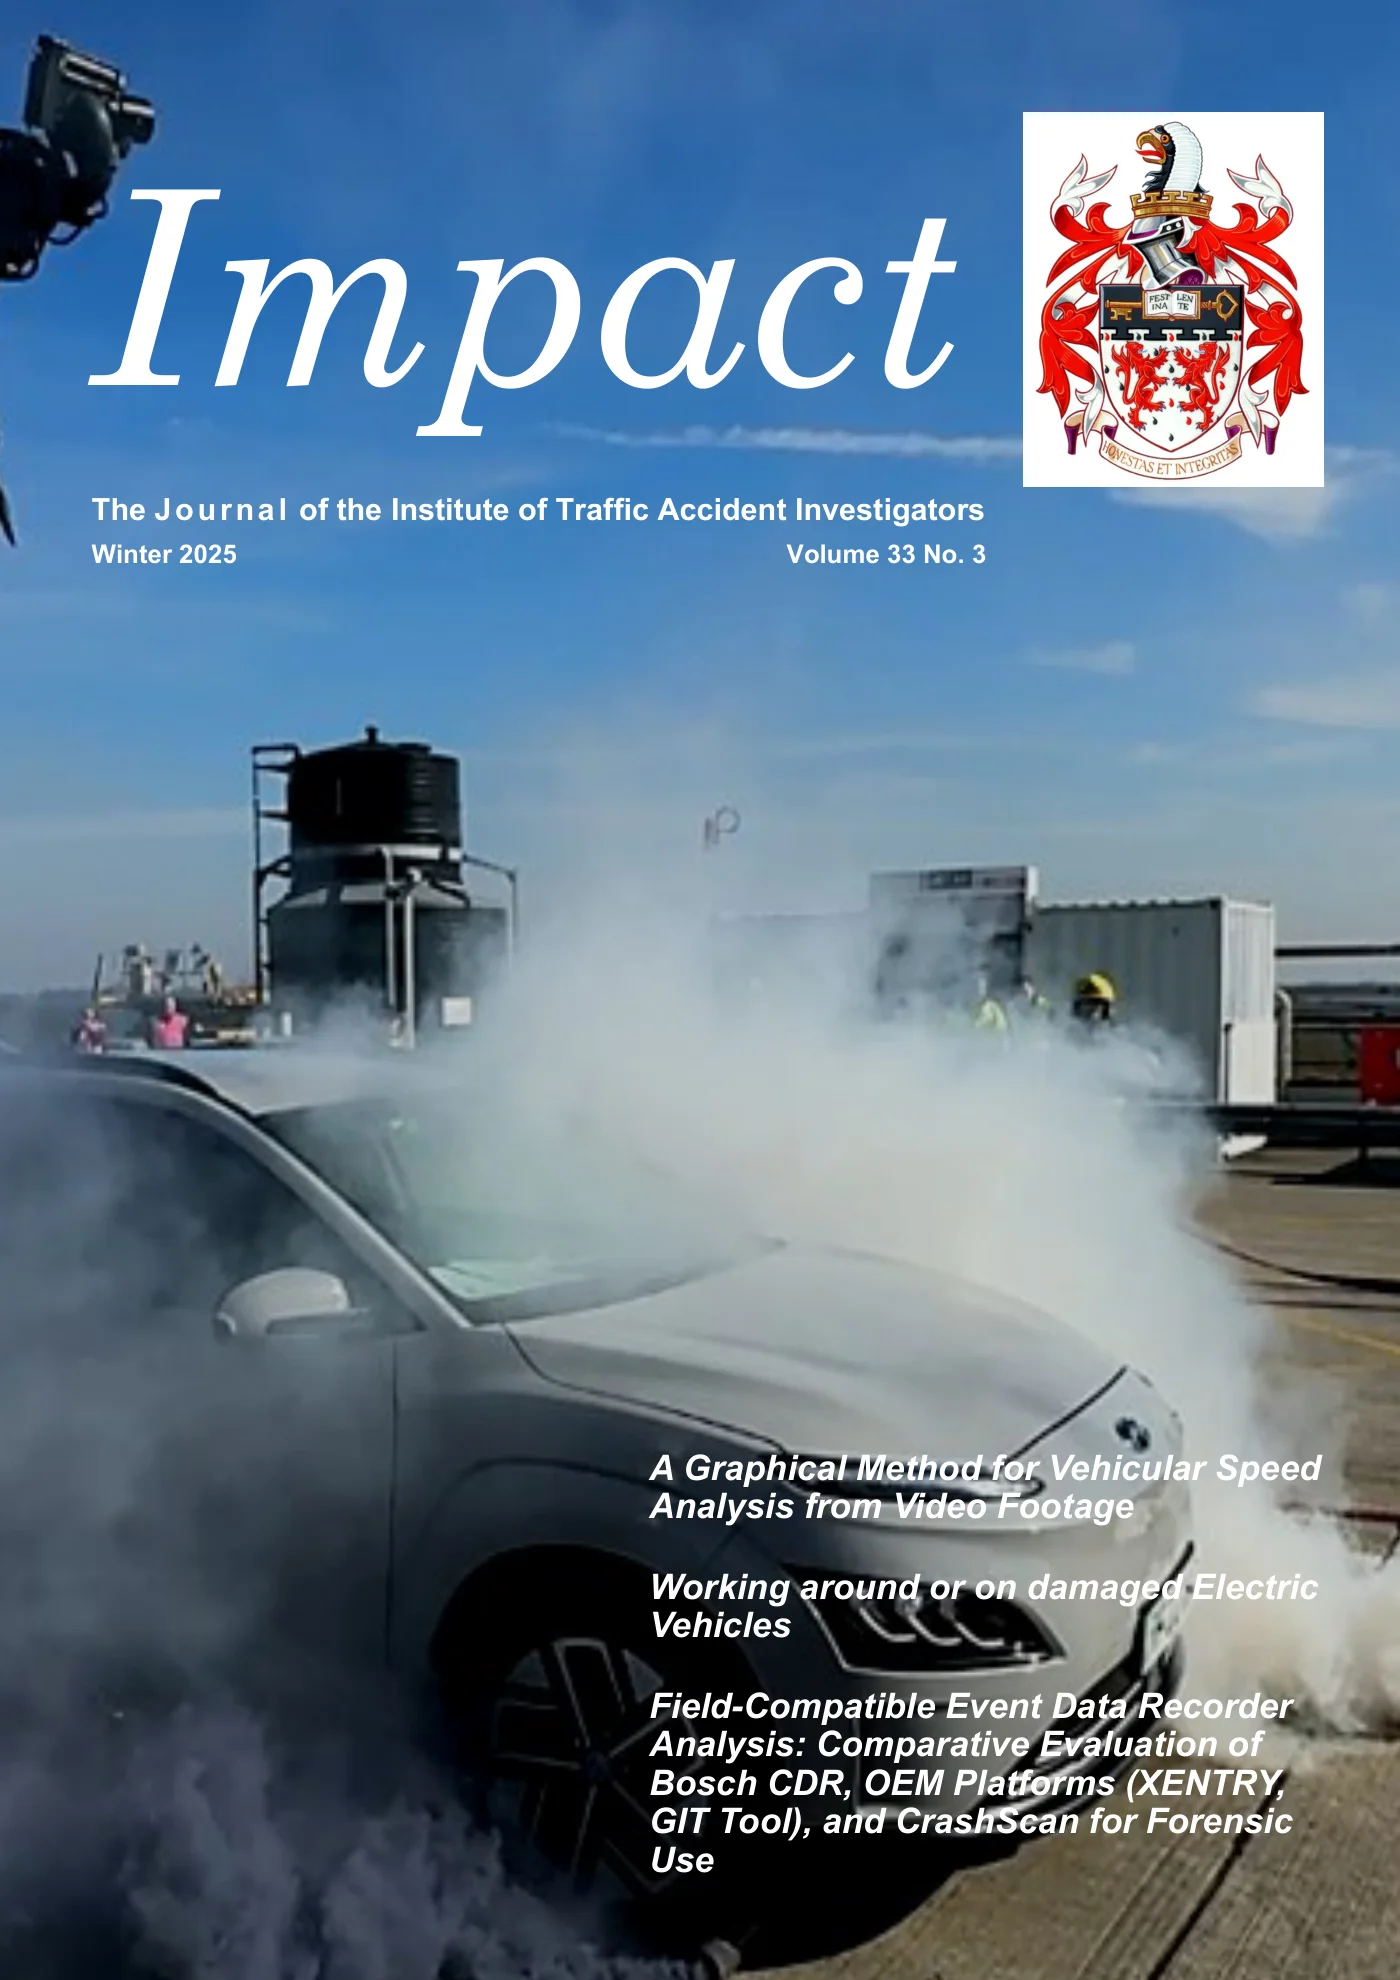
A Graphical Method for Vehicular Speed Analysis from Video Footage Working around or on damaged Electric Vehicles Field-Compatible Event Data Recorder Analysis: Comparative Evaluation of Bosch CDR, OEM Platforms (XENTRY, GIT Tool), and CrashScan for Forensic Use Impact The Journal of the Institute of Traffic Accident Investigators Winter 2025 Volume 33 No. 3
Read page 2 text
Page 2 ‘Impact’ : Winter 2025 CHAIRMAN Mark Crouch Consultant : South Croydon chairman@itai.org GENERAL SECRETARY Bob Seston Consultant: Solihull gensec@itai.org TREASURER Bob Wagstaff Consultant: Maulden treasurer@itai.org COUNCIL OF MANAGEMENT ORDINARY MEMBERS EDITOR OF ‘CONTACT’ Mark Weaver Police FCI: Greater Manchester Police EDITOR OF ‘IMPACT’ Stephen Cash Consultant: Longfield Hill editor@itai.org Jon Webb Consultant: Westward Ho ! webmaster@itai.org Ian White Consultant: Macclesfield Jenny Miller Police FCI: Bedfordshire Iwan Parry Consultant: Wokingham Martin Davies Police FCI/Tech. Manager: West Mids. Gregg Beatson Consultant: Worksop Mike Andrews Police FCI: Metropolitan Impact : Winter Edition 2025 (Vol.33 No.3) Contents A Graphical Method for Vehicular Speed Analysis from Video Footage Dr Richard Ellwood & Mr Craig Dawson 4 Working around or on damaged Electric Vehicles Martin Lown 14 Field-Compatible Event Data Recorder Analysis: Comparative Evaluation of Bosch CDR, OEM Platforms (XENTRY, GIT Tool), and CrashScan for Forensic Use Ing. Peter Vertal, Ph.D. 20 Obituary: Dragos Dima 38 From the Editor I have no doubt many of you are continuing to wrestle with event data that is slowly becoming more readily available in its differing forms. But how good are these emerging iterations. In this edition Ing. Peter Vertal compares varying methods of data recovery. Some of you may have met Martin Lown at Crash Day in June—he presents an article in this edition highlighting the dangers presented by collision damaged electric vehicles—from collision scene to storage facility. Whilst we are all exposed to video evidence and its use in calculating vehicle speed, Dr Rick Elwood and Craig Dawson explore the use of video images and vehicle displacement to calculate time intervals. Stephen Cash editor@itai.org

Read page 3 text
Page 3 ‘Impact’ : Winter 2025 The Institute of Traffic Accident Investigators provides a means of communication, education, representation and regulation in the field of traffic accident investigation. Its main aim is to provide a forum for spreading knowledge and enhancing experience amongst those engaged in the discipline. Further, the Institute seeks to promote a professional approach to traffic accident investigation and, through its rules and discipline procedures, to encourage honesty and integrity. The current membership represents a wide spectrum of professions, including police officers, researchers, lecturers in higher education, and private practitioners. Membership of the Institute will be of assistance to anyone wishing to be informed of current developments and thinking in the discipline of traffic accident investigation, in addition to those in a career where the use and understanding of the principles of accident investigation are required. The Institute is not a police organisation, nor is it a trade union or political pressure group. Membership Grades There are 5 grades of membership - (i) Student (in full time education), (ii) Affiliate, (iii) Associate, (iv) Member, and (v) Retired. Membership at any level is restricted to individuals. There is no corporate membership. Affiliate membership is open to anyone who has an interest in the field of traffic accident investigation and the Institute will accept direct membership applications to the various grades. Associate and Member status will be granted by the Grades Assessment Panel subject to the meeting of specific criteria, further details of which can be obtained from the Institute’s website www.itai.org. A full Member of the Institute is permitted to use the letters MITAI. Similarly, an Associate is permitted to use the letters AMITAI. Student, Affiliate or Retired members may refer to their membership in any curriculum vitae or the like, but it must be clearly understood that those levels of membership are not to be regarded as any form of qualification. Fees and Subscriptions Currently there is a non-returnable registration fee of £15 on first application for grades of Affiliate, Associate and Member. Those registering as Student members are not charged a fee. There is a £60 administration and assessment fee in respect of application for full Member or Associate membership. (i) Student annual subscription is £20 (ii) Affiliate annual subscription is £70 (iii) Associate annual subscription is £80 (iv) Full Member annual subscription is £90 (v) Retired member annual subscription is £20 The subscription payable on first application is calculated on a quarterly basis. Impact (The Institute’s journal) ‘Impact’ (in hard copy or electronic form) is distributed free of charge to all members three times each year. Non-members are able to subscribe by application to the Institute’s Administration Department, or by making the appropriate payment at the Institute’s on-line shop - (currently £50 p/a). Back issues of ‘Impact’ can also be purchased via the Institute’s Administration Department or on- line shop. Letters to the Editor are welcomed. Opinions expressed in letters and articles within ‘Impact’ do not necessarily reflect those of the Editorial Board or the Institute. The Institute of Traffic Accident Investigators General information concerning Membership Grades,
Read page 4 text
Page 4 ‘Impact’ : Winter 2025 Introduction In a simple measuring exercise, it is seemingly obvious that for best results the measuring device must be placed alongside the object being measured. In order to declare the answer to the age-old question of how long is a piece of string, a tape measure employed to find out would be placed closely alongside said piece of string. Increasingly worse estimates of the length will be obtained if the tape measure is offset from the string, introducing parallax errors, and even more so if the measure is not aligned in the same plane. In each case the accuracy and precision of the measurements rely on the relationship between three components: the object being measured, the tool being used for the measurement, and the viewpoint of the analyst performing the measurement. While conclusions around this simple scenario may seem blatantly obvious and surplus to requirements, consideration of the flaws in such a measurement system are an important foundation for establishing many of the measurements one might seek to obtain from video imagery. A direct translation of this scenario into an analogy relevant to the collision investigation field might be useful at this stage. For this we can consider the movements of a vehicle travelling past a CCTV camera, particularly by comparison of the vehicle’s position relative to a virtual ruler overlay. This may be created from measured increments marked within the scene and visible in the resulting footage. The object is the vehicle, the measuring tool is the virtual ruler, and the viewing position is the camera Abstract A graphical method to determine accurate timing data from the analysis of object movements through video imagery is presented. The aim is to utilise a polynomial function based on measurements taken from two-dimensional video imagery to model the rate of change in object position with respect to time. Calculations for object speeds from video footage are typically based on establishing the distance travelled between two positions within a time period established from the footage itself. Measurements of absolute position across an imaging sensor plane, akin to photogrammetry, are flawed unless at least one additional synchronised camera feed is available, or additional spatial reference data is available. Considering a commonly known, or measurable, object characteristic as a reference for the distance travelled in the established time period is a common technique, typically utilising the wheelbase of a vehicle in question. However, this has known limitations when the path of the object is not parallel to the image sensor, and/or the displacements between images do not coincide with the wheelbase length, which impacts its precision. A method is presented here to produce a polynomial function as a movement model to enhance this approach and to provide precise speed calculations with minimal impact from changes in heading and speed. The results have shown the technique to be robust and accurate and in all analysed instances the calculated speed was no greater than 2.2% from the actual speed. A Graphical Method for Vehicular Speed Analysis from Video Footage Dr Richard Ellwood Beng (Hons) EngD CEng MIET MITAI of pForensic Ltd. Mr Craig Dawson BSc (Hons) MSc MCSFS MITAI of Ai Training Services Ltd. (AiTS) and De Montfort University
Read page 5 text
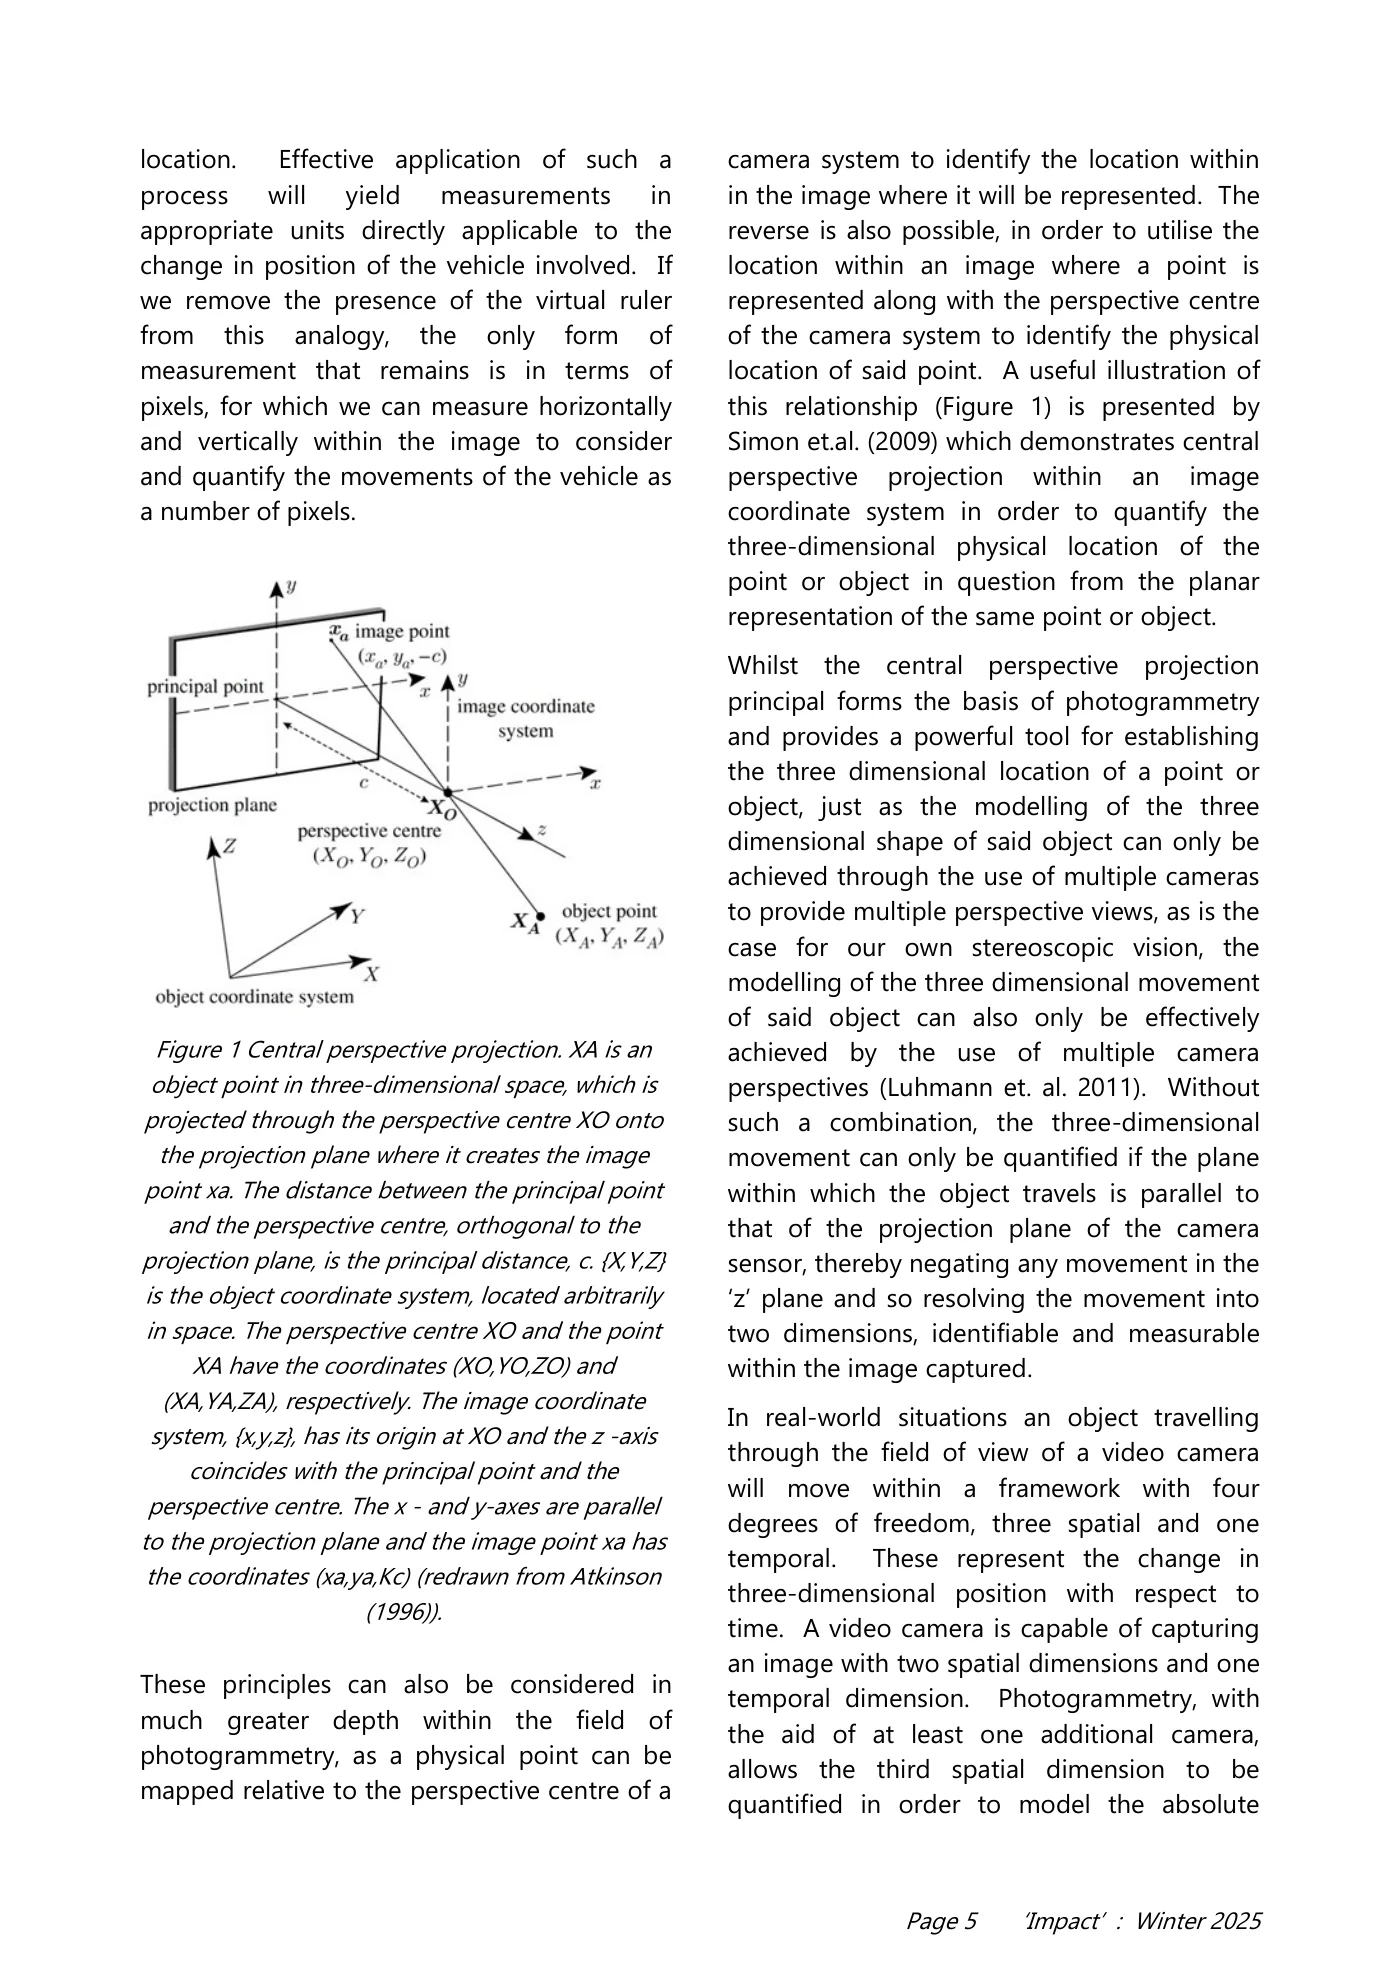
Page 5 ‘Impact’ : Winter 2025 location. Effective application of such a process will yield measurements in appropriate units directly applicable to the change in position of the vehicle involved. If we remove the presence of the virtual ruler from this analogy, the only form of measurement that remains is in terms of pixels, for which we can measure horizontally and vertically within the image to consider and quantify the movements of the vehicle as a number of pixels. These principles can also be considered in much greater depth within the field of photogrammetry, as a physical point can be mapped relative to the perspective centre of a camera system to identify the location within in the image where it will be represented. The reverse is also possible, in order to utilise the location within an image where a point is represented along with the perspective centre of the camera system to identify the physical location of said point. A useful illustration of this relationship (Figure 1) is presented by Simon et.al. (2009) which demonstrates central perspective projection within an image coordinate system in order to quantify the three-dimensional physical location of the point or object in question from the planar representation of the same point or object. Whilst the central perspective projection principal forms the basis of photogrammetry and provides a powerful tool for establishing the three dimensional location of a point or object, just as the modelling of the three dimensional shape of said object can only be achieved through the use of multiple cameras to provide multiple perspective views, as is the case for our own stereoscopic vision, the modelling of the three dimensional movement of said object can also only be effectively achieved by the use of multiple camera perspectives (Luhmann et. al. 2011). Without such a combination, the three-dimensional movement can only be quantified if the plane within which the object travels is parallel to that of the projection plane of the camera sensor, thereby negating any movement in the ‘z’ plane and so resolving the movement into two dimensions, identifiable and measurable within the image captured. In real-world situations an object travelling through the field of view of a video camera will move within a framework with four degrees of freedom, three spatial and one temporal. These represent the change in three-dimensional position with respect to time. A video camera is capable of capturing an image with two spatial dimensions and one temporal dimension. Photogrammetry, with the aid of at least one additional camera, allows the third spatial dimension to be quantified in order to model the absolute Figure 1 Central perspective projection. XA is an object point in three-dimensional space, which is projected through the perspective centre XO onto the projection plane where it creates the image point xa. The distance between the principal point and the perspective centre, orthogonal to the projection plane, is the principal distance, c. {X,Y,Z} is the object coordinate system, located arbitrarily in space. The perspective centre XO and the point XA have the coordinates (XO,YO,ZO) and (XA,YA,ZA), respectively. The image coordinate system, {x,y,z}, has its origin at XO and the z -axis coincides with the principal point and the perspective centre. The x - and y-axes are parallel to the projection plane and the image point xa has the coordinates (xa,ya,Kc) (redrawn from Atkinson (1996)).
Read page 6 text
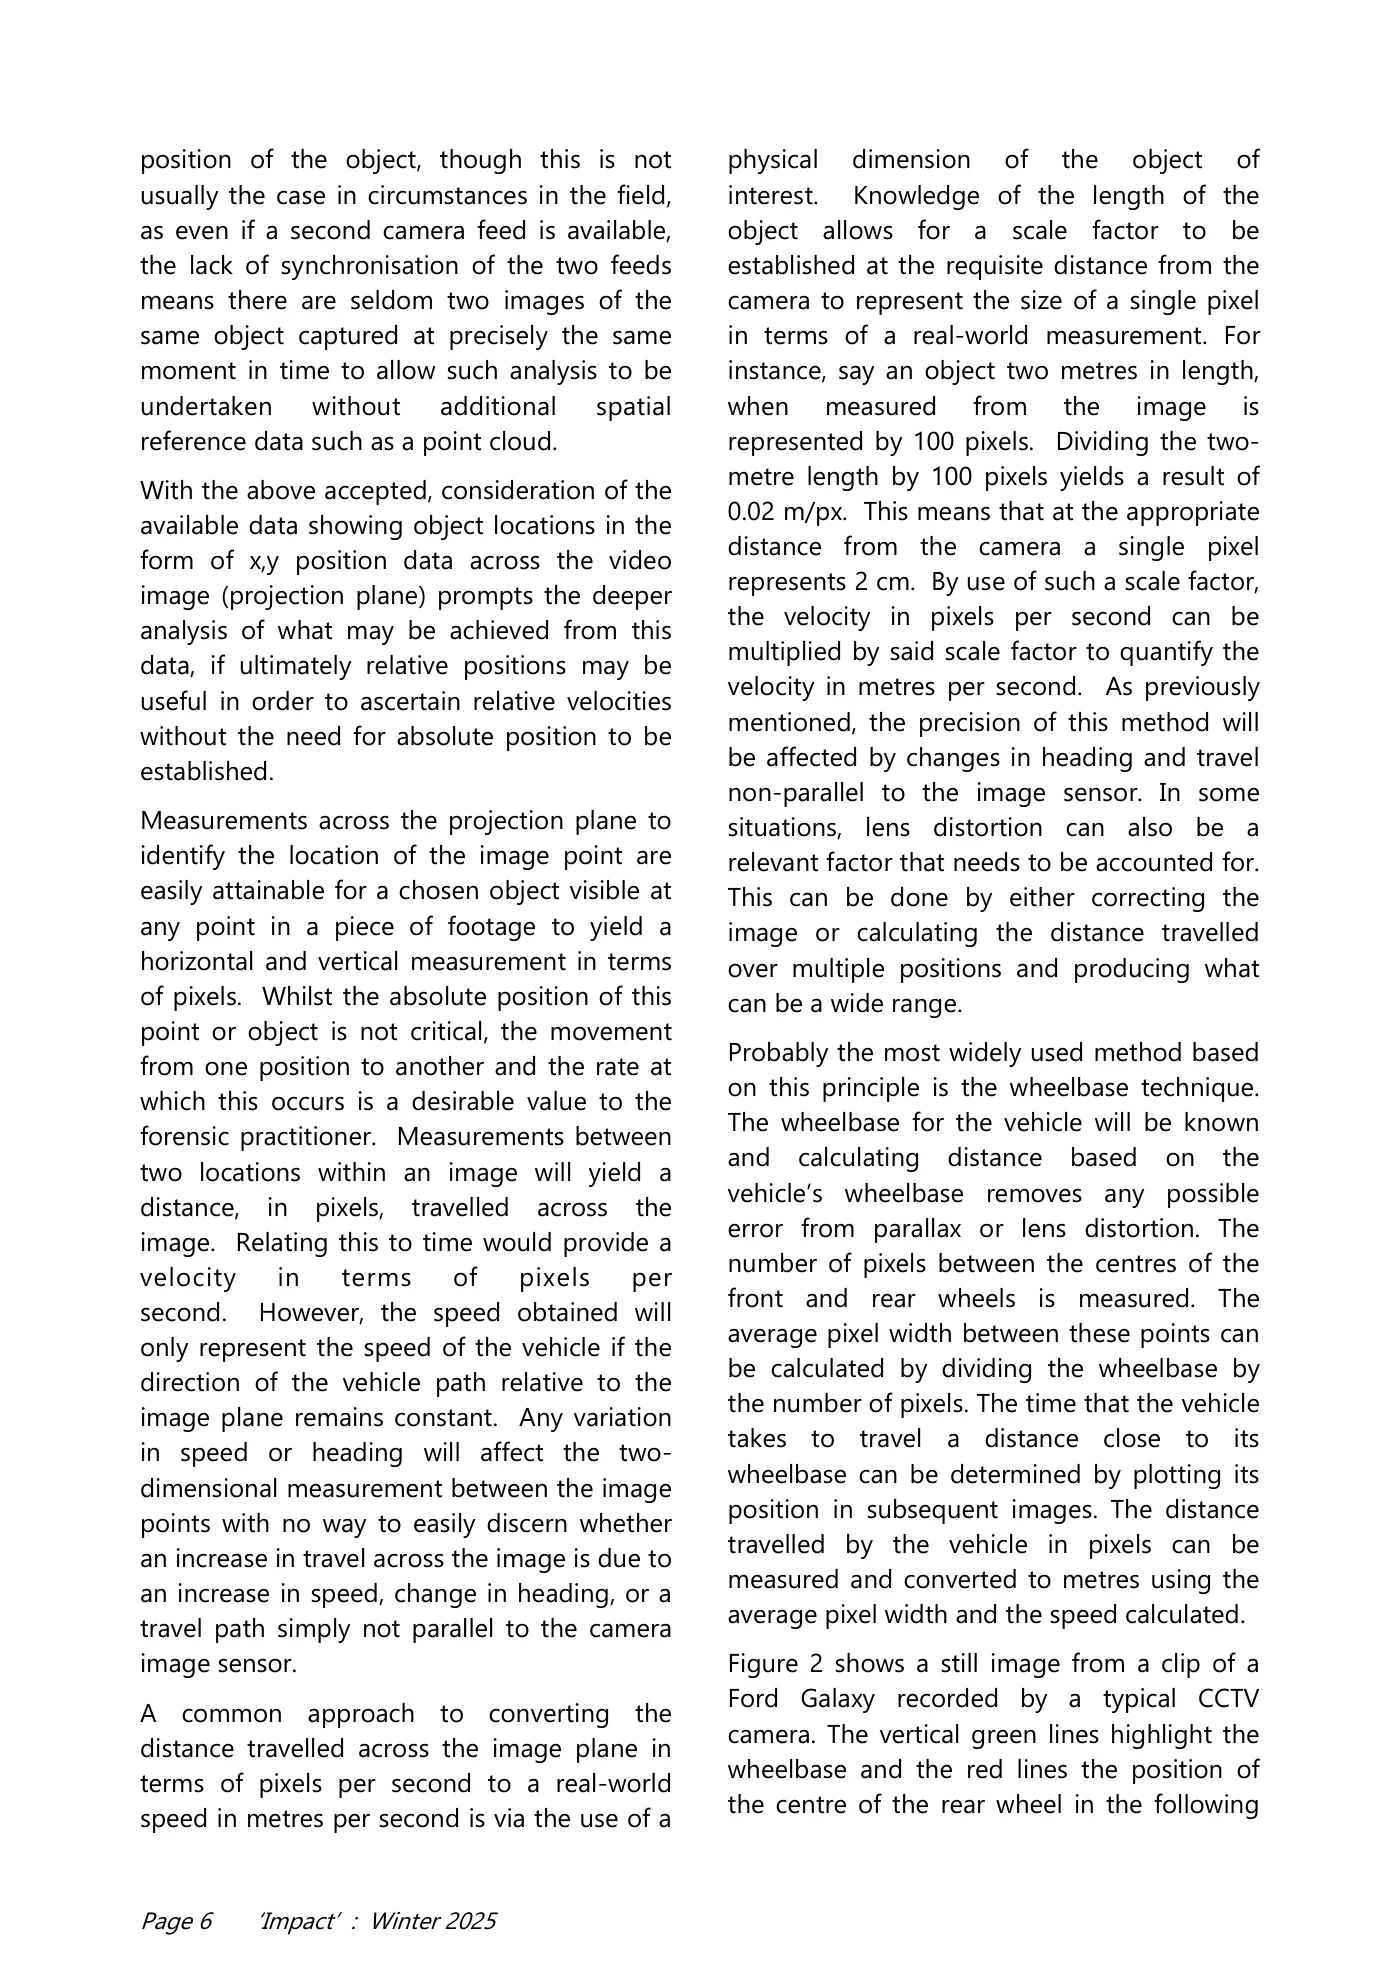
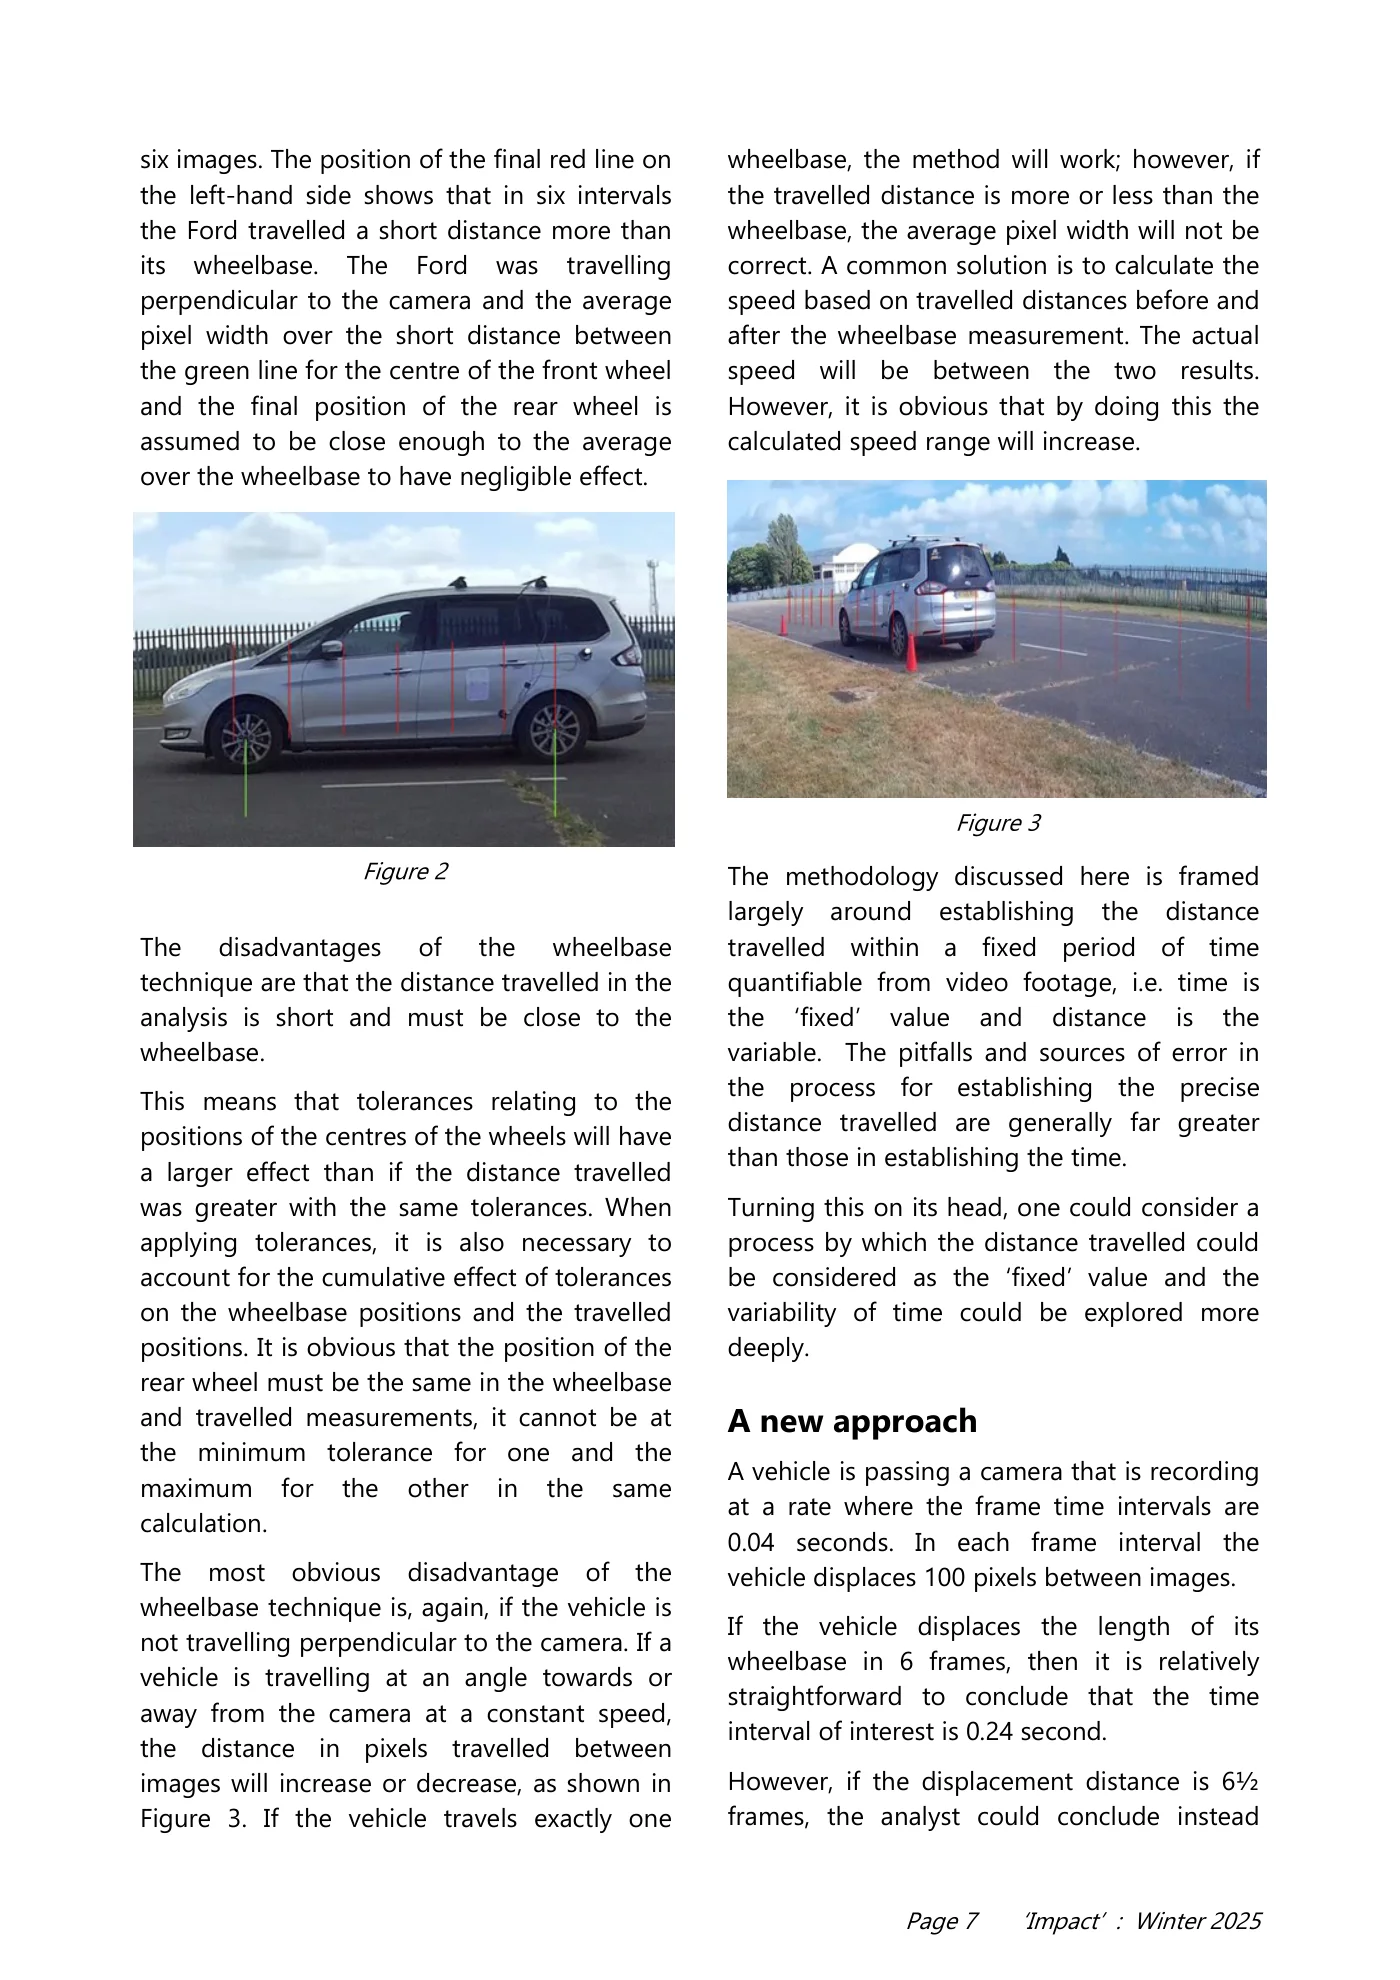
Page 6 ‘Impact’ : Winter 2025 position of the object, though this is not usually the case in circumstances in the field, as even if a second camera feed is available, the lack of synchronisation of the two feeds means there are seldom two images of the same object captured at precisely the same moment in time to allow such analysis to be undertaken without additional spatial reference data such as a point cloud. With the above accepted, consideration of the available data showing object locations in the form of x,y position data across the video image (projection plane) prompts the deeper analysis of what may be achieved from this data, if ultimately relative positions may be useful in order to ascertain relative velocities without the need for absolute position to be established. Measurements across the projection plane to identify the location of the image point are easily attainable for a chosen object visible at any point in a piece of footage to yield a horizontal and vertical measurement in terms of pixels. Whilst the absolute position of this point or object is not critical, the movement from one position to another and the rate at which this occurs is a desirable value to the forensic practitioner. Measurements between two locations within an image will yield a distance, in pixels, travelled across the image. Relating this to time would provide a velocity in terms of pixels per second. However, the speed obtained will only represent the speed of the vehicle if the direction of the vehicle path relative to the image plane remains constant. Any variation in speed or heading will affect the two- dimensional measurement between the image points with no way to easily discern whether an increase in travel across the image is due to an increase in speed, change in heading, or a travel path simply not parallel to the camera image sensor. A common approach to converting the distance travelled across the image plane in terms of pixels per second to a real-world speed in metres per second is via the use of a physical dimension of the object of interest. Knowledge of the length of the object allows for a scale factor to be established at the requisite distance from the camera to represent the size of a single pixel in terms of a real-world measurement. For instance, say an object two metres in length, when measured from the image is represented by 100 pixels. Dividing the two- metre length by 100 pixels yields a result of 0.02 m/px. This means that at the appropriate distance from the camera a single pixel represents 2 cm. By use of such a scale factor, the velocity in pixels per second can be multiplied by said scale factor to quantify the velocity in metres per second. As previously mentioned, the precision of this method will be affected by changes in heading and travel non-parallel to the image sensor. In some situations, lens distortion can also be a relevant factor that needs to be accounted for. This can be done by either correcting the image or calculating the distance travelled over multiple positions and producing what can be a wide range. Probably the most widely used method based on this principle is the wheelbase technique. The wheelbase for the vehicle will be known and calculating distance based on the vehicle’s wheelbase removes any possible error from parallax or lens distortion. The number of pixels between the centres of the front and rear wheels is measured. The average pixel width between these points can be calculated by dividing the wheelbase by the number of pixels. The time that the vehicle takes to travel a distance close to its wheelbase can be determined by plotting its position in subsequent images. The distance travelled by the vehicle in pixels can be measured and converted to metres using the average pixel width and the speed calculated. Figure 2 shows a still image from a clip of a Ford Galaxy recorded by a typical CCTV camera. The vertical green lines highlight the wheelbase and the red lines the position of the centre of the rear wheel in the following
Read page 7 text
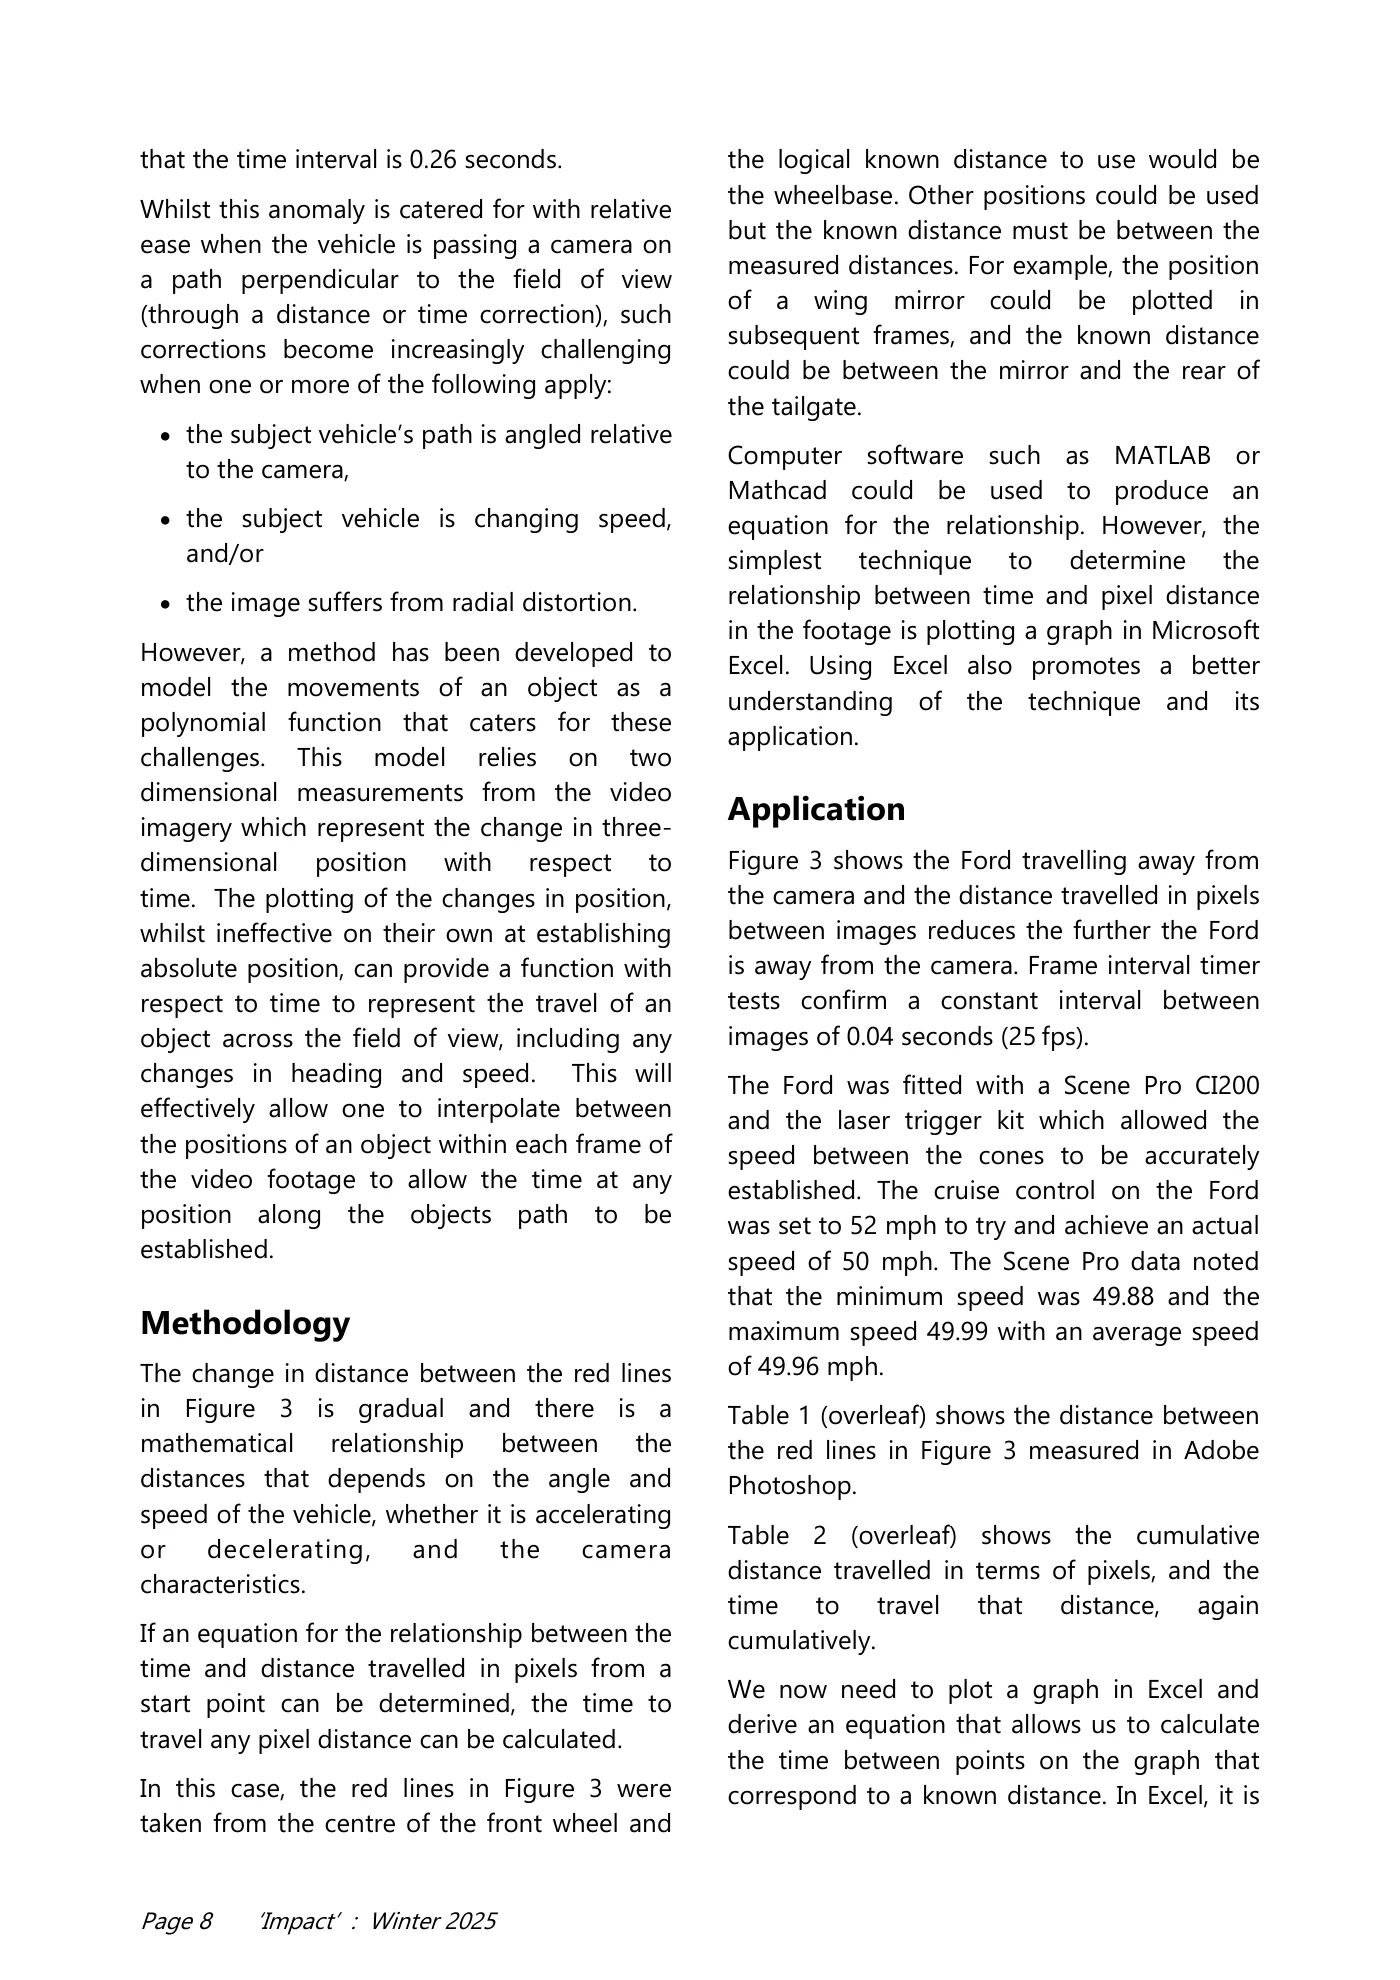
Page 7 ‘Impact’ : Winter 2025 six images. The position of the final red line on the left-hand side shows that in six intervals the Ford travelled a short distance more than its wheelbase. The Ford was travelling perpendicular to the camera and the average pixel width over the short distance between the green line for the centre of the front wheel and the final position of the rear wheel is assumed to be close enough to the average over the wheelbase to have negligible effect. The disadvantages of the wheelbase technique are that the distance travelled in the analysis is short and must be close to the wheelbase. This means that tolerances relating to the positions of the centres of the wheels will have a larger effect than if the distance travelled was greater with the same tolerances. When applying tolerances, it is also necessary to account for the cumulative effect of tolerances on the wheelbase positions and the travelled positions. It is obvious that the position of the rear wheel must be the same in the wheelbase and travelled measurements, it cannot be at the minimum tolerance for one and the maximum for the other in the same calculation. The most obvious disadvantage of the wheelbase technique is, again, if the vehicle is not travelling perpendicular to the camera. If a vehicle is travelling at an angle towards or away from the camera at a constant speed, the distance in pixels travelled between images will increase or decrease, as shown in Figure 3. If the vehicle travels exactly one wheelbase, the method will work; however, if the travelled distance is more or less than the wheelbase, the average pixel width will not be correct. A common solution is to calculate the speed based on travelled distances before and after the wheelbase measurement. The actual speed will be between the two results. However, it is obvious that by doing this the calculated speed range will increase. The methodology discussed here is framed largely around establishing the distance travelled within a fixed period of time quantifiable from video footage, i.e. time is the ‘fixed’ value and distance is the variable. The pitfalls and sources of error in the process for establishing the precise distance travelled are generally far greater than those in establishing the time. Turning this on its head, one could consider a process by which the distance travelled could be considered as the ‘fixed’ value and the variability of time could be explored more deeply. A new approach A vehicle is passing a camera that is recording at a rate where the frame time intervals are 0.04 seconds. In each frame interval the vehicle displaces 100 pixels between images. If the vehicle displaces the length of its wheelbase in 6 frames, then it is relatively straightforward to conclude that the time interval of interest is 0.24 second. However, if the displacement distance is 6½ frames, the analyst could conclude instead Figure 2 Figure 3
Read page 8 text
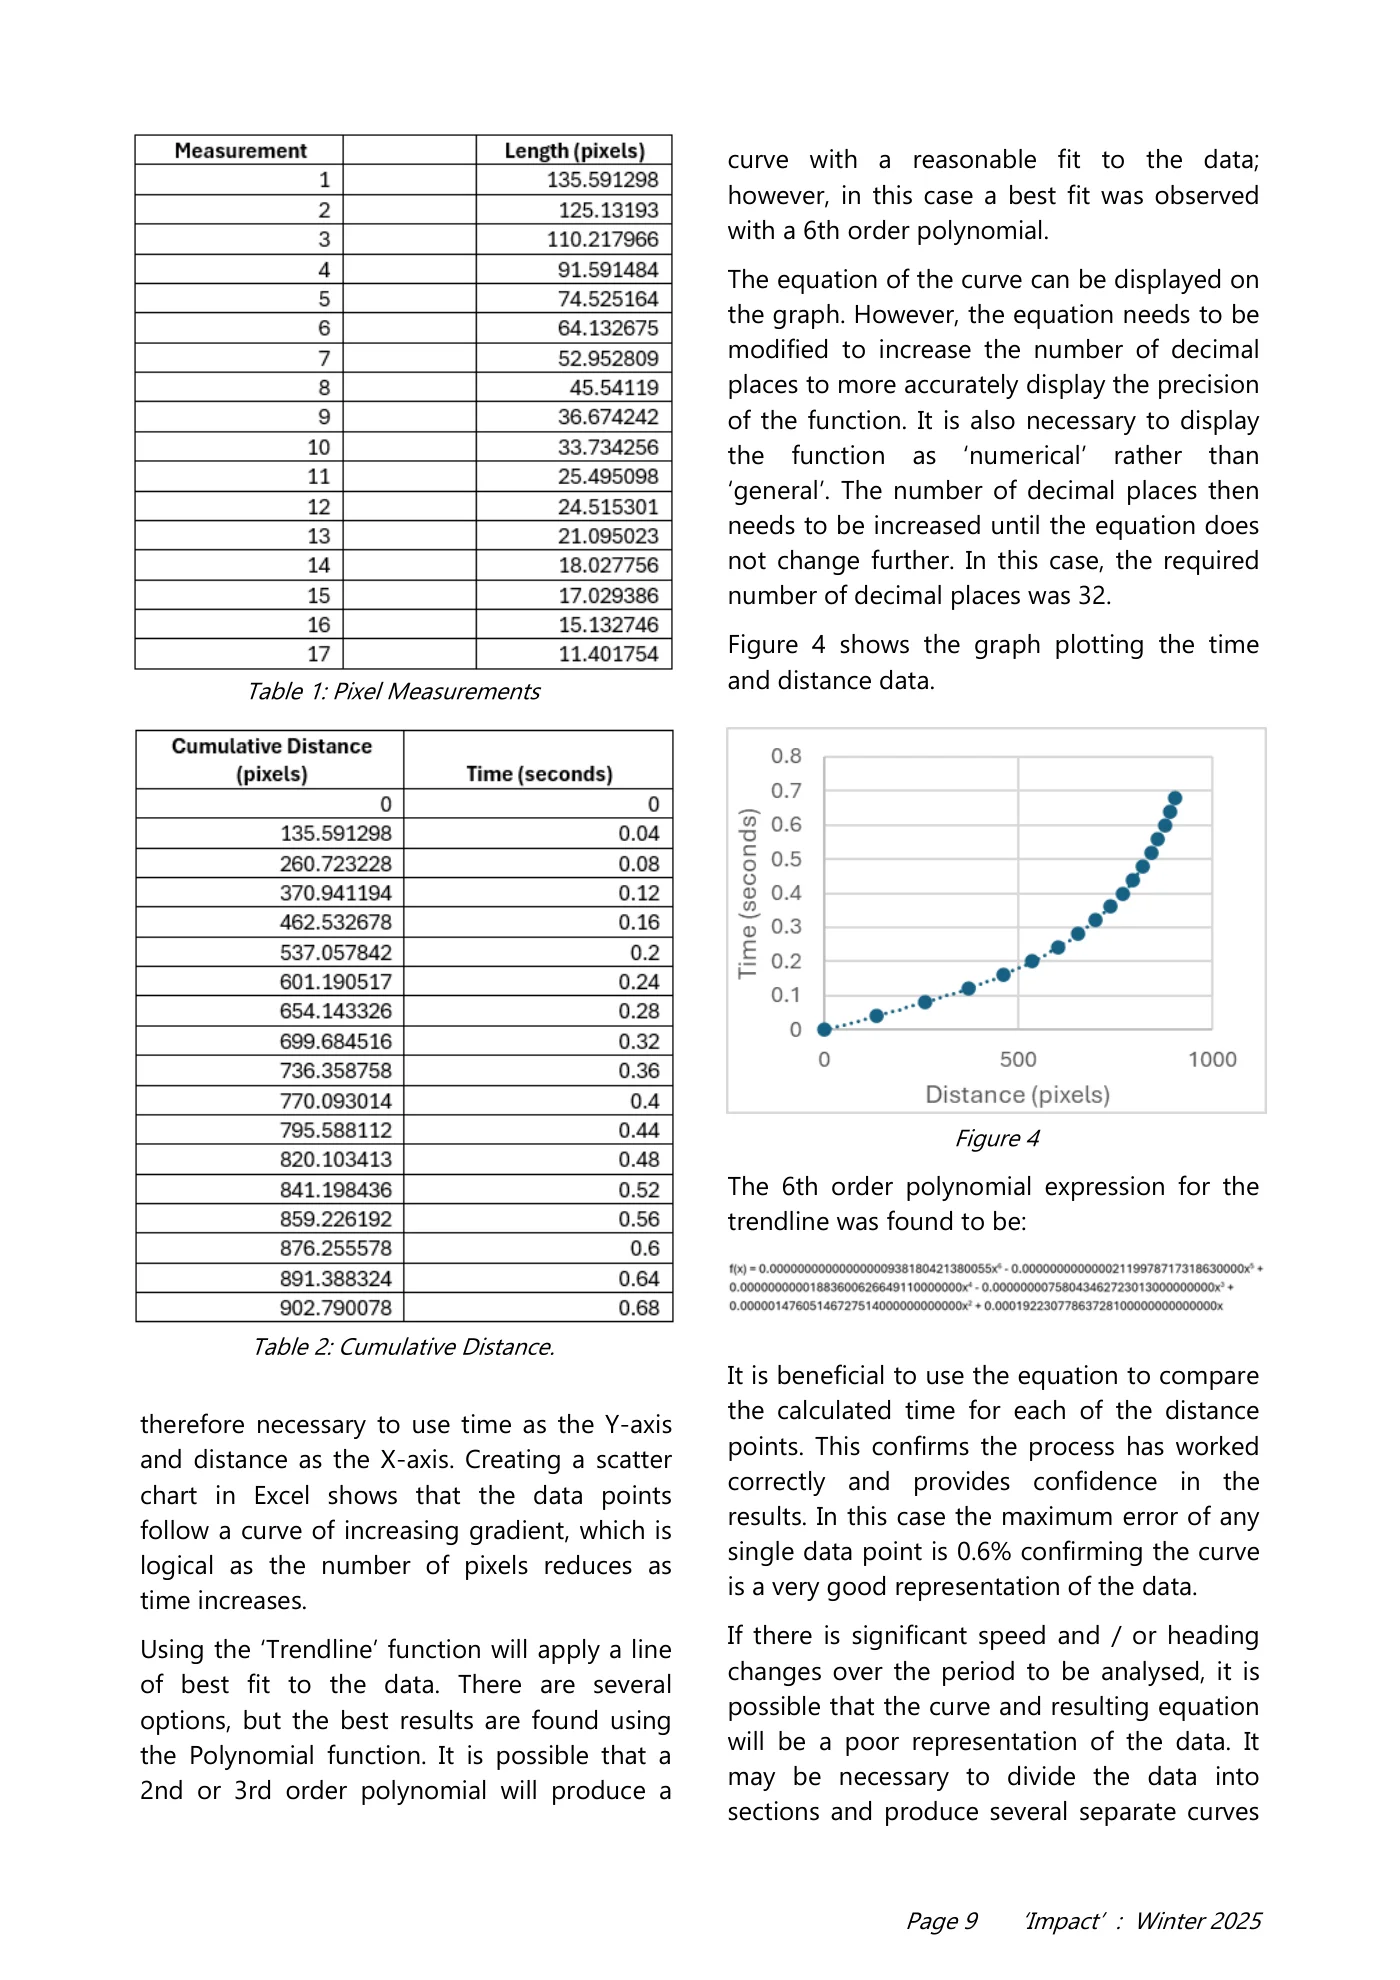
Page 8 ‘Impact’ : Winter 2025 that the time interval is 0.26 seconds. Whilst this anomaly is catered for with relative ease when the vehicle is passing a camera on a path perpendicular to the field of view (through a distance or time correction), such corrections become increasingly challenging when one or more of the following apply: • the subject vehicle’s path is angled relative to the camera, • the subject vehicle is changing speed, and/or • the image suffers from radial distortion. However, a method has been developed to model the movements of an object as a polynomial function that caters for these challenges. This model relies on two dimensional measurements from the video imagery which represent the change in three- dimensional position with respect to time. The plotting of the changes in position, whilst ineffective on their own at establishing absolute position, can provide a function with respect to time to represent the travel of an object across the field of view, including any changes in heading and speed. This will effectively allow one to interpolate between the positions of an object within each frame of the video footage to allow the time at any position along the objects path to be established. Methodology The change in distance between the red lines in Figure 3 is gradual and there is a mathematical relationship between the distances that depends on the angle and speed of the vehicle, whether it is accelerating or decelerating, and the camera characteristics. If an equation for the relationship between the time and distance travelled in pixels from a start point can be determined, the time to travel any pixel distance can be calculated. In this case, the red lines in Figure 3 were taken from the centre of the front wheel and the logical known distance to use would be the wheelbase. Other positions could be used but the known distance must be between the measured distances. For example, the position of a wing mirror could be plotted in subsequent frames, and the known distance could be between the mirror and the rear of the tailgate. Computer software such as MATLAB or Mathcad could be used to produce an equation for the relationship. However, the simplest technique to determine the relationship between time and pixel distance in the footage is plotting a graph in Microsoft Excel. Using Excel also promotes a better understanding of the technique and its application. Application Figure 3 shows the Ford travelling away from the camera and the distance travelled in pixels between images reduces the further the Ford is away from the camera. Frame interval timer tests confirm a constant interval between images of 0.04 seconds (25 fps). The Ford was fitted with a Scene Pro CI200 and the laser trigger kit which allowed the speed between the cones to be accurately established. The cruise control on the Ford was set to 52 mph to try and achieve an actual speed of 50 mph. The Scene Pro data noted that the minimum speed was 49.88 and the maximum speed 49.99 with an average speed of 49.96 mph. Table 1 (overleaf) shows the distance between the red lines in Figure 3 measured in Adobe Photoshop. Table 2 (overleaf) shows the cumulative distance travelled in terms of pixels, and the time to travel that distance, again cumulatively. We now need to plot a graph in Excel and derive an equation that allows us to calculate the time between points on the graph that correspond to a known distance. In Excel, it is
Read page 9 text
Page 9 ‘Impact’ : Winter 2025 therefore necessary to use time as the Y-axis and distance as the X-axis. Creating a scatter chart in Excel shows that the data points follow a curve of increasing gradient, which is logical as the number of pixels reduces as time increases. Using the ‘Trendline’ function will apply a line of best fit to the data. There are several options, but the best results are found using the Polynomial function. It is possible that a 2nd or 3rd order polynomial will produce a curve with a reasonable fit to the data; however, in this case a best fit was observed with a 6th order polynomial. The equation of the curve can be displayed on the graph. However, the equation needs to be modified to increase the number of decimal places to more accurately display the precision of the function. It is also necessary to display the function as ‘numerical’ rather than ‘general’. The number of decimal places then needs to be increased until the equation does not change further. In this case, the required number of decimal places was 32. Figure 4 shows the graph plotting the time and distance data. The 6th order polynomial expression for the trendline was found to be: It is beneficial to use the equation to compare the calculated time for each of the distance points. This confirms the process has worked correctly and provides confidence in the results. In this case the maximum error of any single data point is 0.6% confirming the curve is a very good representation of the data. If there is significant speed and / or heading changes over the period to be analysed, it is possible that the curve and resulting equation will be a poor representation of the data. It may be necessary to divide the data into sections and produce several separate curves Table 1: Pixel Measurements Table 2: Cumulative Distance. Figure 4
Read page 10 text
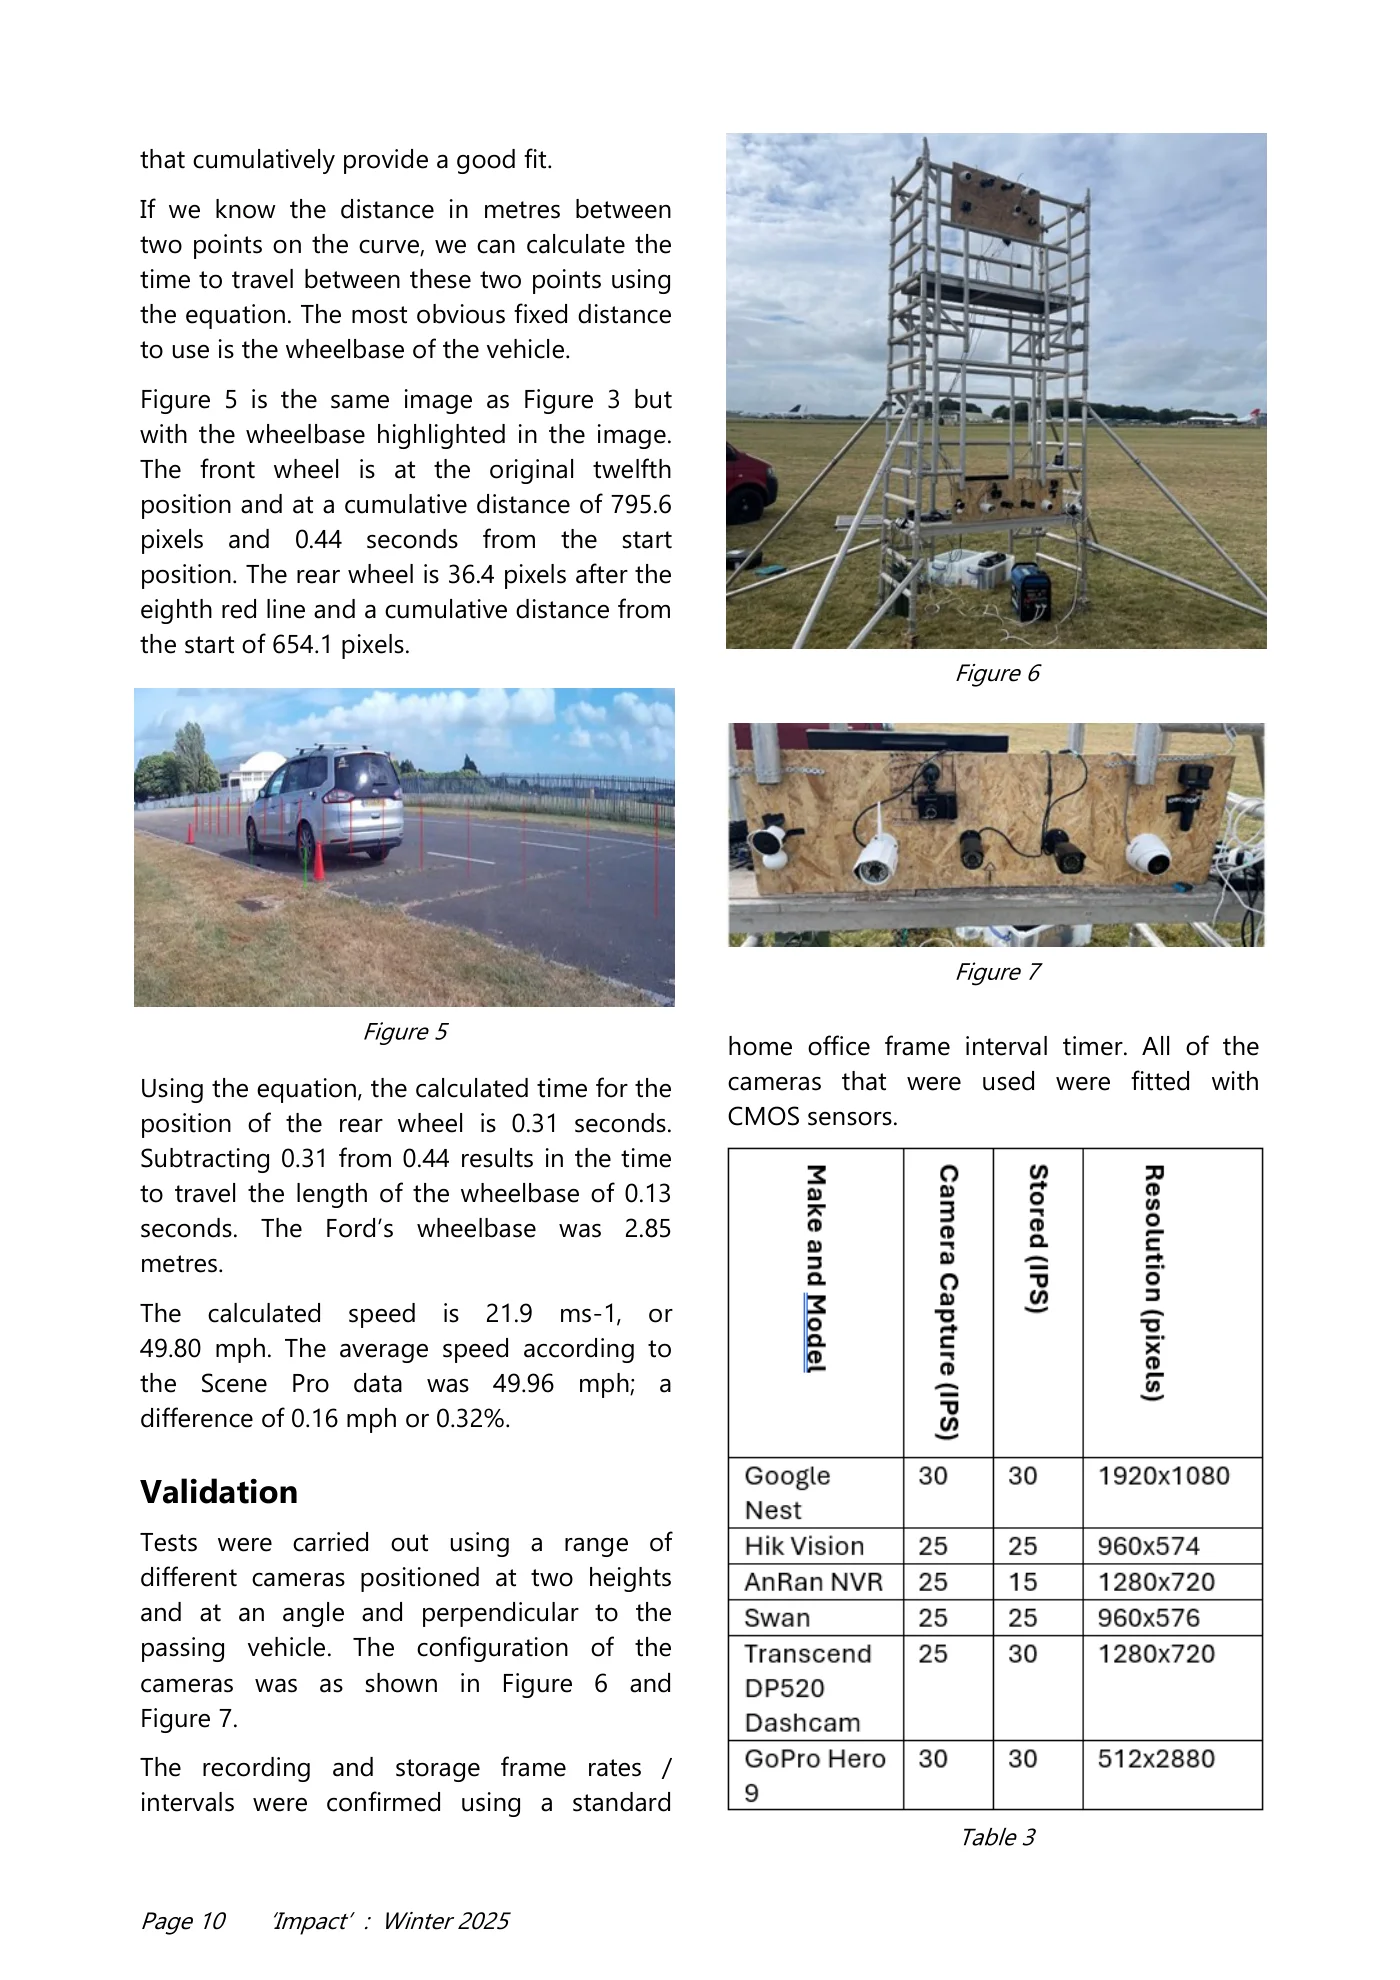
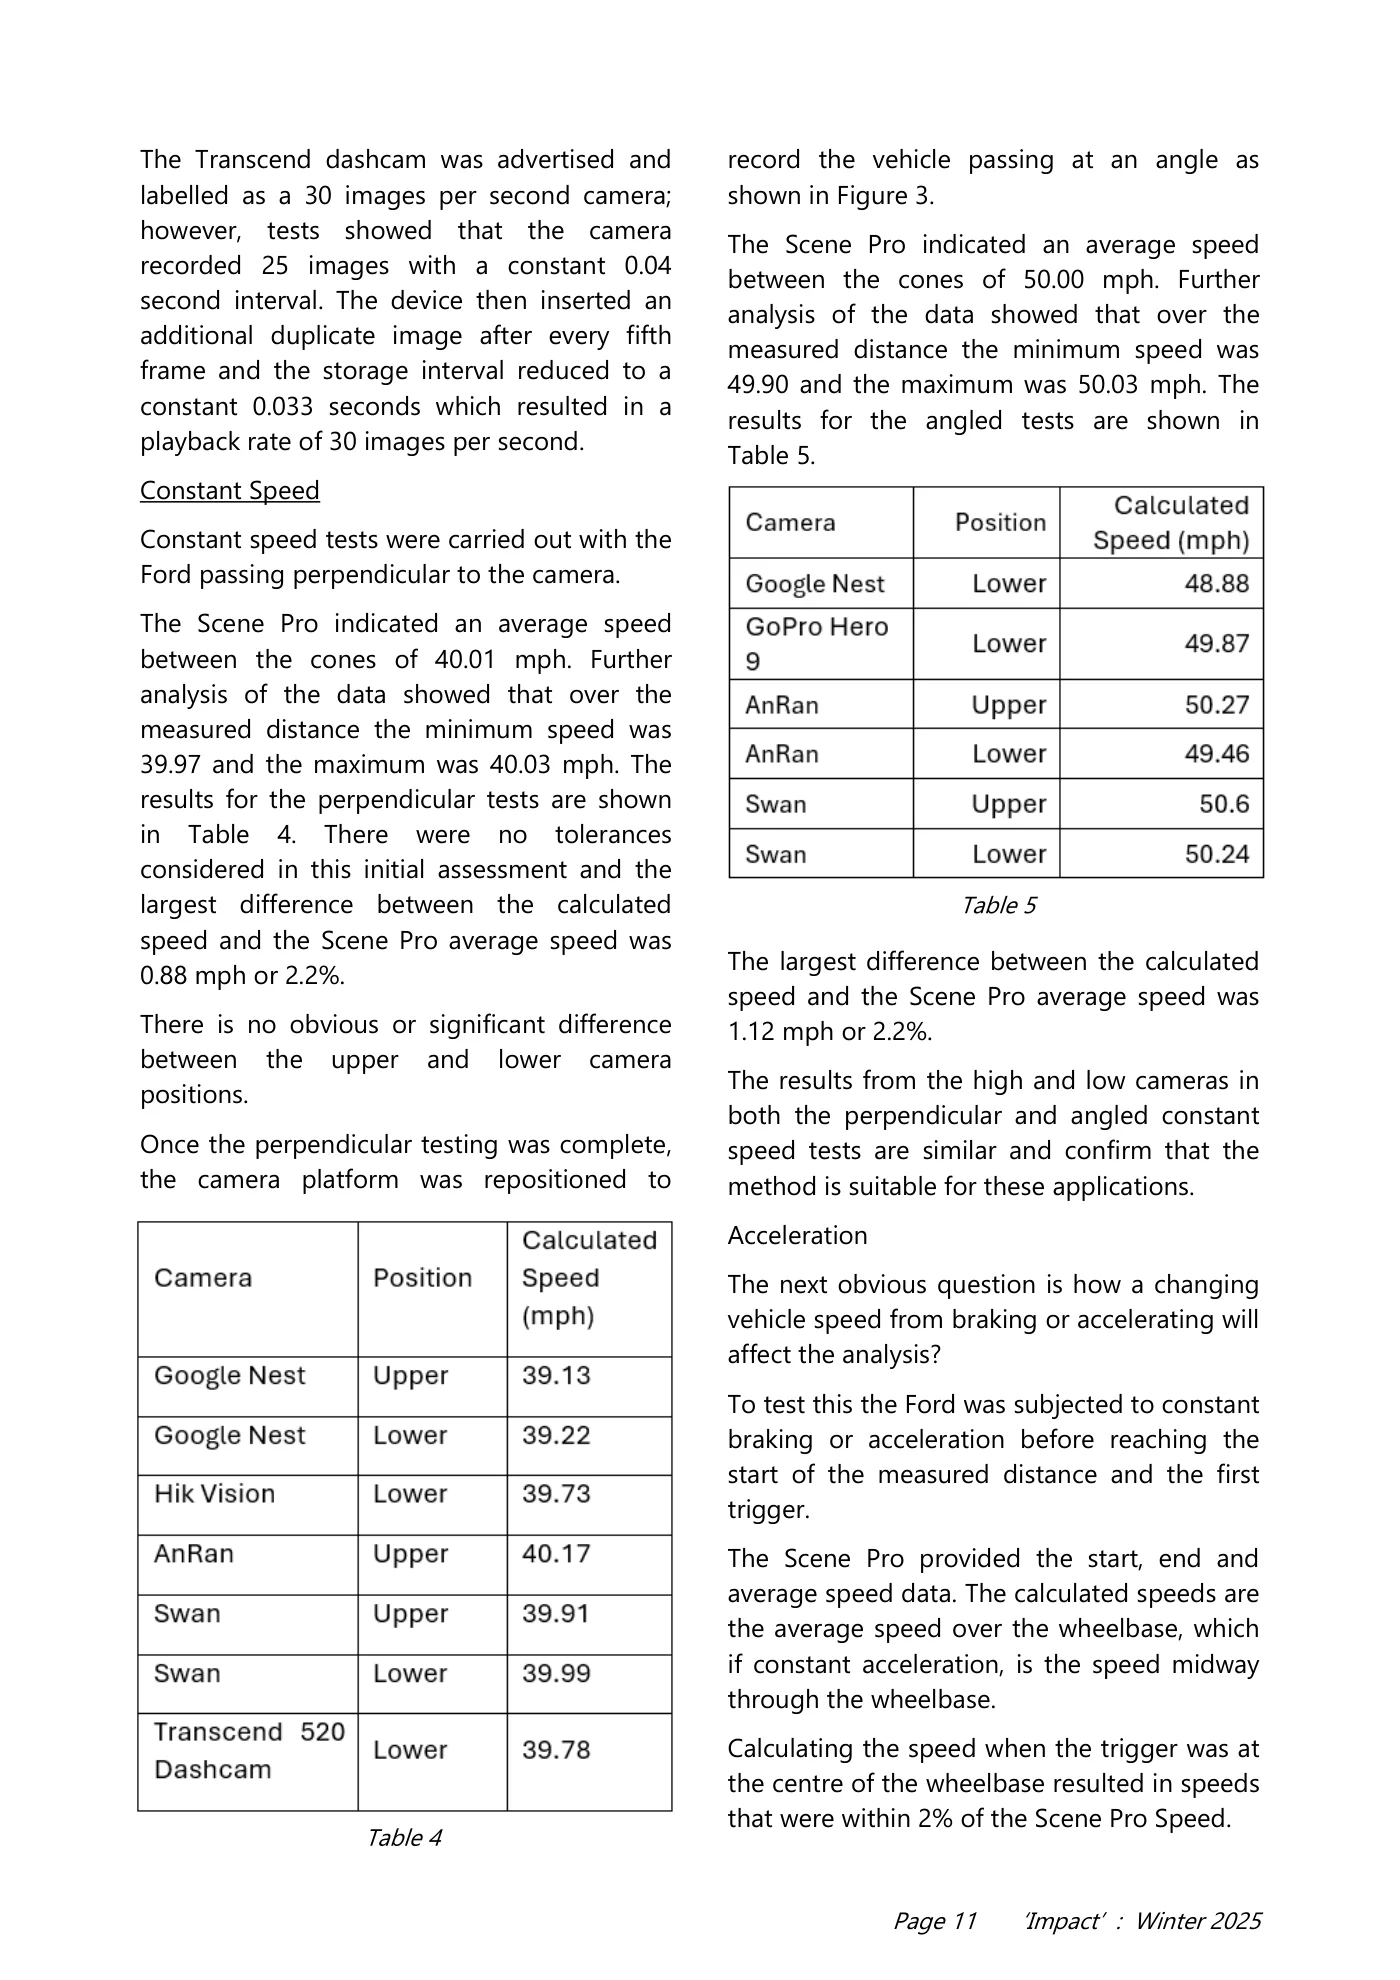
Page 10 ‘Impact’ : Winter 2025 that cumulatively provide a good fit. If we know the distance in metres between two points on the curve, we can calculate the time to travel between these two points using the equation. The most obvious fixed distance to use is the wheelbase of the vehicle. Figure 5 is the same image as Figure 3 but with the wheelbase highlighted in the image. The front wheel is at the original twelfth position and at a cumulative distance of 795.6 pixels and 0.44 seconds from the start position. The rear wheel is 36.4 pixels after the eighth red line and a cumulative distance from the start of 654.1 pixels. Using the equation, the calculated time for the position of the rear wheel is 0.31 seconds. Subtracting 0.31 from 0.44 results in the time to travel the length of the wheelbase of 0.13 seconds. The Ford’s wheelbase was 2.85 metres. The calculated speed is 21.9 ms-1, or 49.80 mph. The average speed according to the Scene Pro data was 49.96 mph; a difference of 0.16 mph or 0.32%. Validation Tests were carried out using a range of different cameras positioned at two heights and at an angle and perpendicular to the passing vehicle. The configuration of the cameras was as shown in Figure 6 and Figure 7. The recording and storage frame rates / intervals were confirmed using a standard home office frame interval timer. All of the cameras that were used were fitted with CMOS sensors. Figure 5 Figure 6 Figure 7 Table 3
Read page 11 text
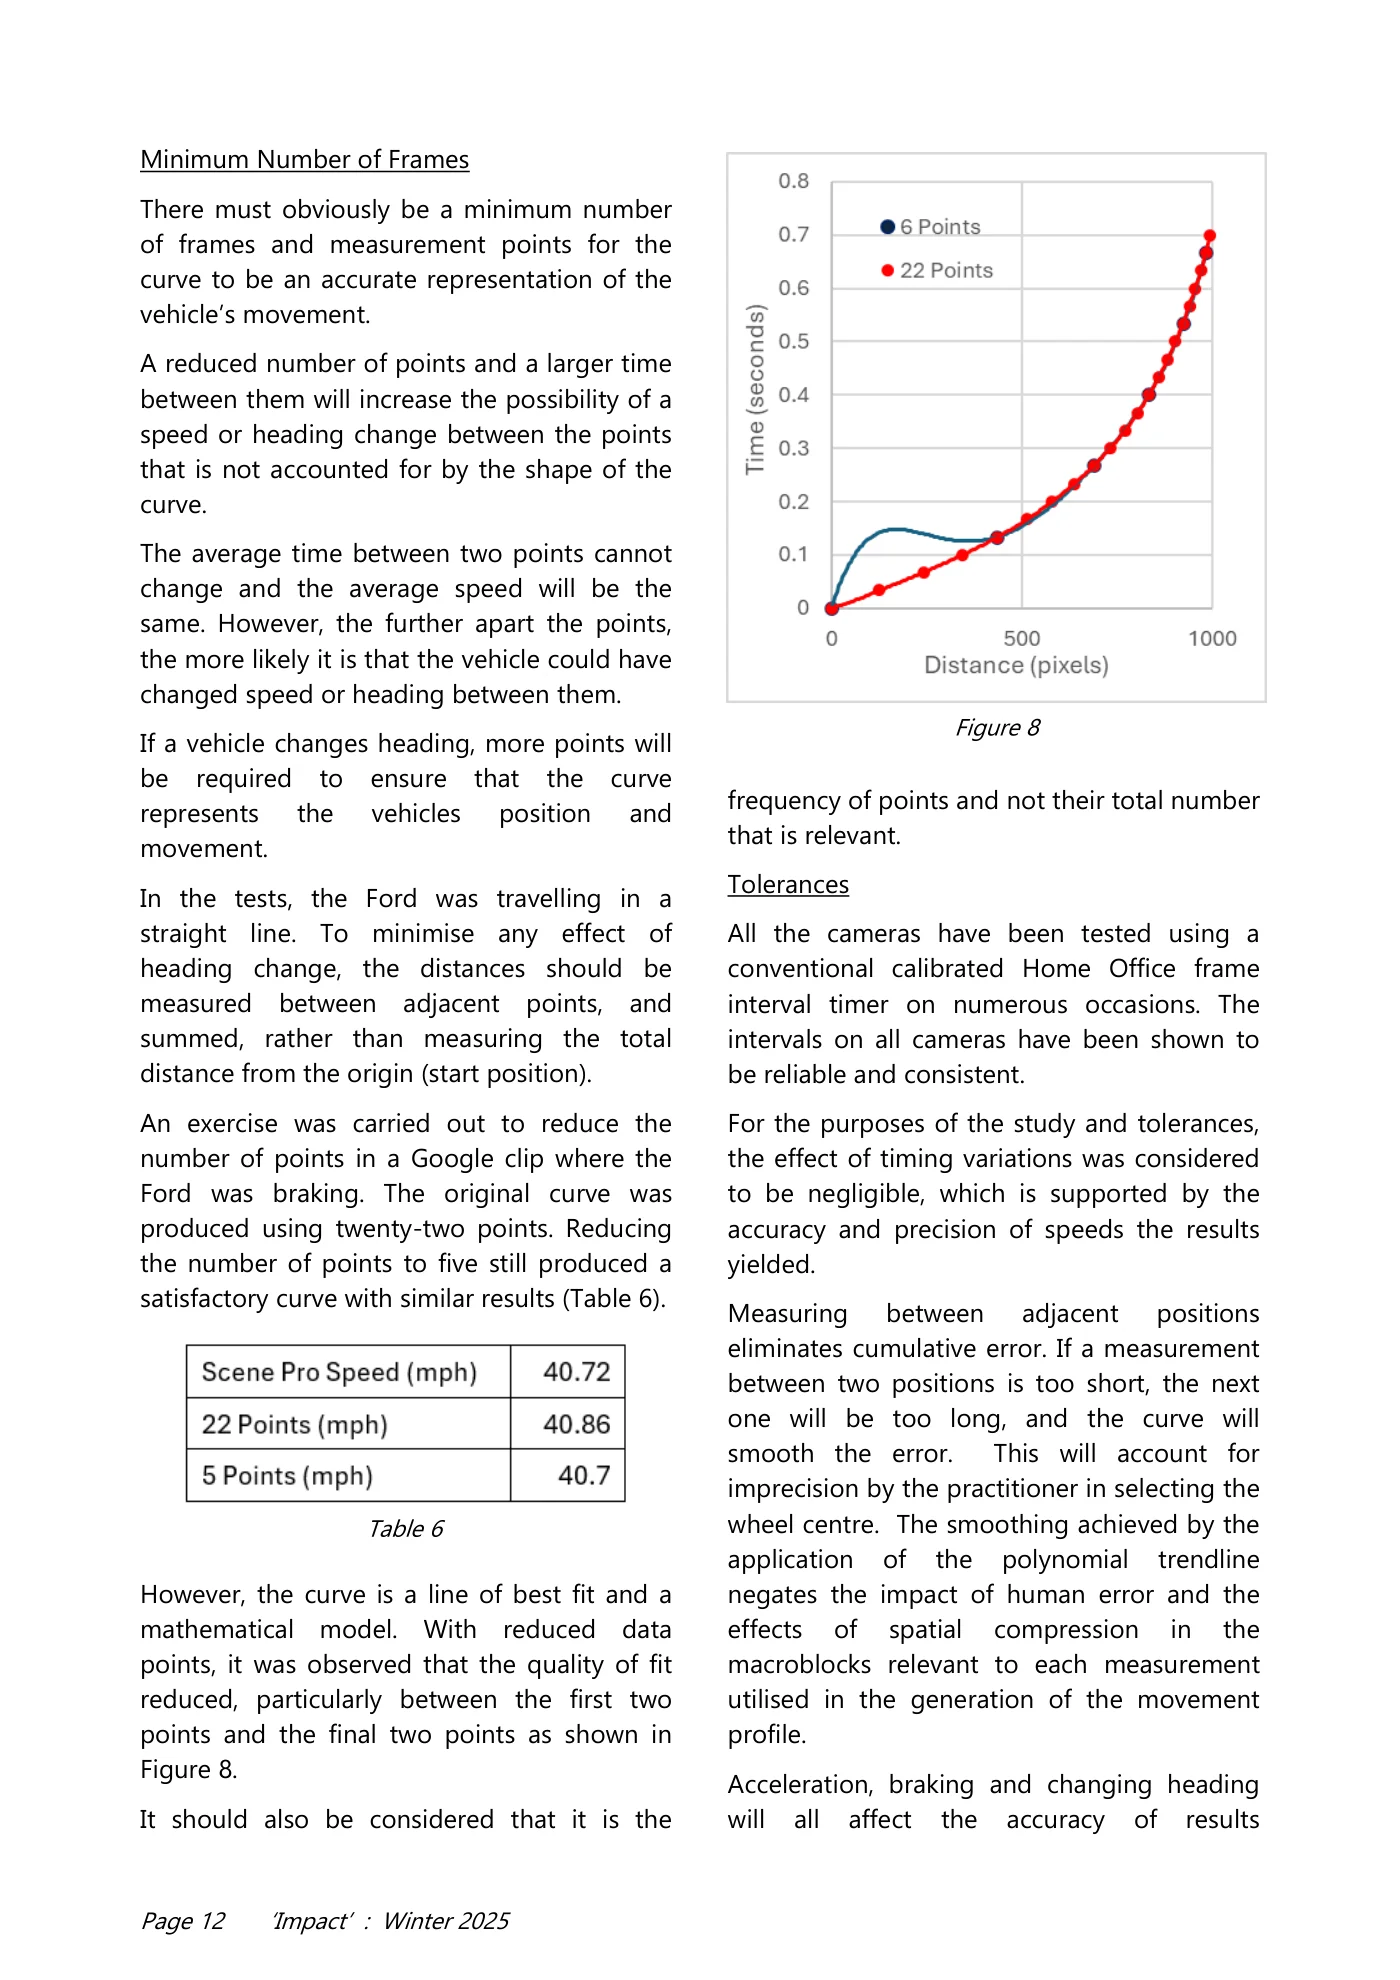
Page 11 ‘Impact’ : Winter 2025 The Transcend dashcam was advertised and labelled as a 30 images per second camera; however, tests showed that the camera recorded 25 images with a constant 0.04 second interval. The device then inserted an additional duplicate image after every fifth frame and the storage interval reduced to a constant 0.033 seconds which resulted in a playback rate of 30 images per second. Constant Speed Constant speed tests were carried out with the Ford passing perpendicular to the camera. The Scene Pro indicated an average speed between the cones of 40.01 mph. Further analysis of the data showed that over the measured distance the minimum speed was 39.97 and the maximum was 40.03 mph. The results for the perpendicular tests are shown in Table 4. There were no tolerances considered in this initial assessment and the largest difference between the calculated speed and the Scene Pro average speed was 0.88 mph or 2.2%. There is no obvious or significant difference between the upper and lower camera positions. Once the perpendicular testing was complete, the camera platform was repositioned to record the vehicle passing at an angle as shown in Figure 3. The Scene Pro indicated an average speed between the cones of 50.00 mph. Further analysis of the data showed that over the measured distance the minimum speed was 49.90 and the maximum was 50.03 mph. The results for the angled tests are shown in Table 5. The largest difference between the calculated speed and the Scene Pro average speed was 1.12 mph or 2.2%. The results from the high and low cameras in both the perpendicular and angled constant speed tests are similar and confirm that the method is suitable for these applications. Acceleration The next obvious question is how a changing vehicle speed from braking or accelerating will affect the analysis? To test this the Ford was subjected to constant braking or acceleration before reaching the start of the measured distance and the first trigger. The Scene Pro provided the start, end and average speed data. The calculated speeds are the average speed over the wheelbase, which if constant acceleration, is the speed midway through the wheelbase. Calculating the speed when the trigger was at the centre of the wheelbase resulted in speeds that were within 2% of the Scene Pro Speed. Table 4 Table 5
Read page 12 text
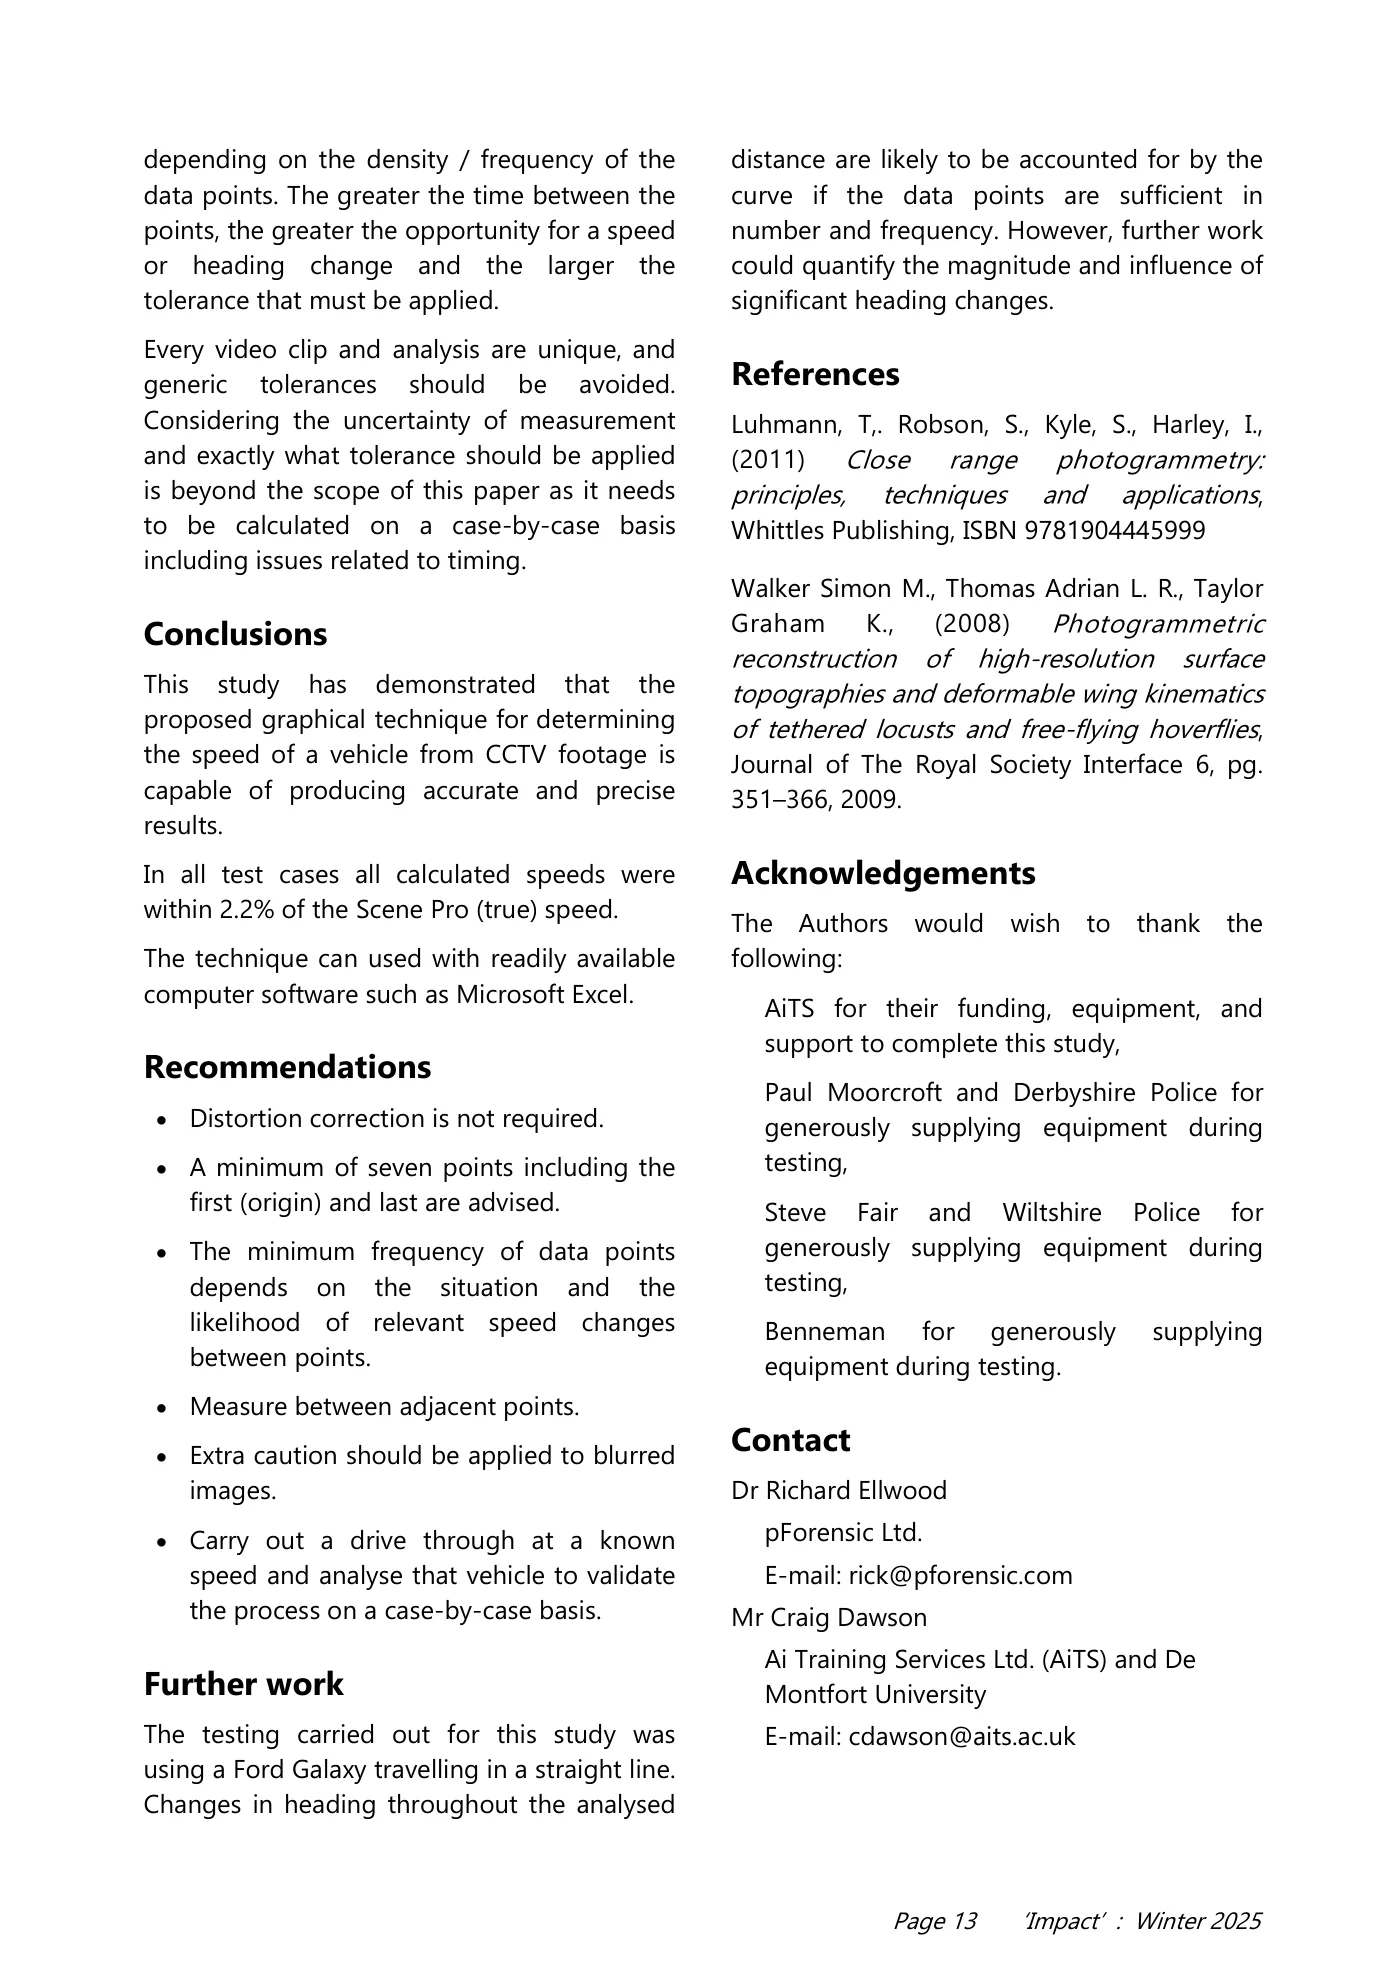
Page 12 ‘Impact’ : Winter 2025 Minimum Number of Frames There must obviously be a minimum number of frames and measurement points for the curve to be an accurate representation of the vehicle’s movement. A reduced number of points and a larger time between them will increase the possibility of a speed or heading change between the points that is not accounted for by the shape of the curve. The average time between two points cannot change and the average speed will be the same. However, the further apart the points, the more likely it is that the vehicle could have changed speed or heading between them. If a vehicle changes heading, more points will be required to ensure that the curve represents the vehicles position and movement. In the tests, the Ford was travelling in a straight line. To minimise any effect of heading change, the distances should be measured between adjacent points, and summed, rather than measuring the total distance from the origin (start position). An exercise was carried out to reduce the number of points in a Google clip where the Ford was braking. The original curve was produced using twenty-two points. Reducing the number of points to five still produced a satisfactory curve with similar results (Table 6). However, the curve is a line of best fit and a mathematical model. With reduced data points, it was observed that the quality of fit reduced, particularly between the first two points and the final two points as shown in Figure 8. It should also be considered that it is the frequency of points and not their total number that is relevant. Tolerances All the cameras have been tested using a conventional calibrated Home Office frame interval timer on numerous occasions. The intervals on all cameras have been shown to be reliable and consistent. For the purposes of the study and tolerances, the effect of timing variations was considered to be negligible, which is supported by the accuracy and precision of speeds the results yielded. Measuring between adjacent positions eliminates cumulative error. If a measurement between two positions is too short, the next one will be too long, and the curve will smooth the error. This will account for imprecision by the practitioner in selecting the wheel centre. The smoothing achieved by the application of the polynomial trendline negates the impact of human error and the effects of spatial compression in the macroblocks relevant to each measurement utilised in the generation of the movement profile. Acceleration, braking and changing heading will all affect the accuracy of results Table 6 Figure 8
Read page 13 text
Page 13 ‘Impact’ : Winter 2025 depending on the density / frequency of the data points. The greater the time between the points, the greater the opportunity for a speed or heading change and the larger the tolerance that must be applied. Every video clip and analysis are unique, and generic tolerances should be avoided. Considering the uncertainty of measurement and exactly what tolerance should be applied is beyond the scope of this paper as it needs to be calculated on a case-by-case basis including issues related to timing. Conclusions This study has demonstrated that the proposed graphical technique for determining the speed of a vehicle from CCTV footage is capable of producing accurate and precise results. In all test cases all calculated speeds were within 2.2% of the Scene Pro (true) speed. The technique can used with readily available computer software such as Microsoft Excel. Recommendations • Distortion correction is not required. • A minimum of seven points including the first (origin) and last are advised. • The minimum frequency of data points depends on the situation and the likelihood of relevant speed changes between points. • Measure between adjacent points. • Extra caution should be applied to blurred images. • Carry out a drive through at a known speed and analyse that vehicle to validate the process on a case-by-case basis. Further work The testing carried out for this study was using a Ford Galaxy travelling in a straight line. Changes in heading throughout the analysed distance are likely to be accounted for by the curve if the data points are sufficient in number and frequency. However, further work could quantify the magnitude and influence of significant heading changes. References Luhmann, T,. Robson, S., Kyle, S., Harley, I., (2011) Close range photogrammetry: principles, techniques and applications, Whittles Publishing, ISBN 9781904445999 Walker Simon M., Thomas Adrian L. R., Taylor Graham K., (2008) Photogrammetric reconstruction of high-resolution surface topographies and deformable wing kinematics of tethered locusts and free-flying hoverflies, Journal of The Royal Society Interface 6, pg. 351–366, 2009. Acknowledgements The Authors would wish to thank the following: AiTS for their funding, equipment, and support to complete this study, Paul Moorcroft and Derbyshire Police for generously supplying equipment during testing, Steve Fair and Wiltshire Police for generously supplying equipment during testing, Benneman for generously supplying equipment during testing. Contact Dr Richard Ellwood pForensic Ltd. E-mail: rick@pforensic.com Mr Craig Dawson Ai Training Services Ltd. (AiTS) and De Montfort University E-mail: cdawson@aits.ac.uk
Read page 14 text
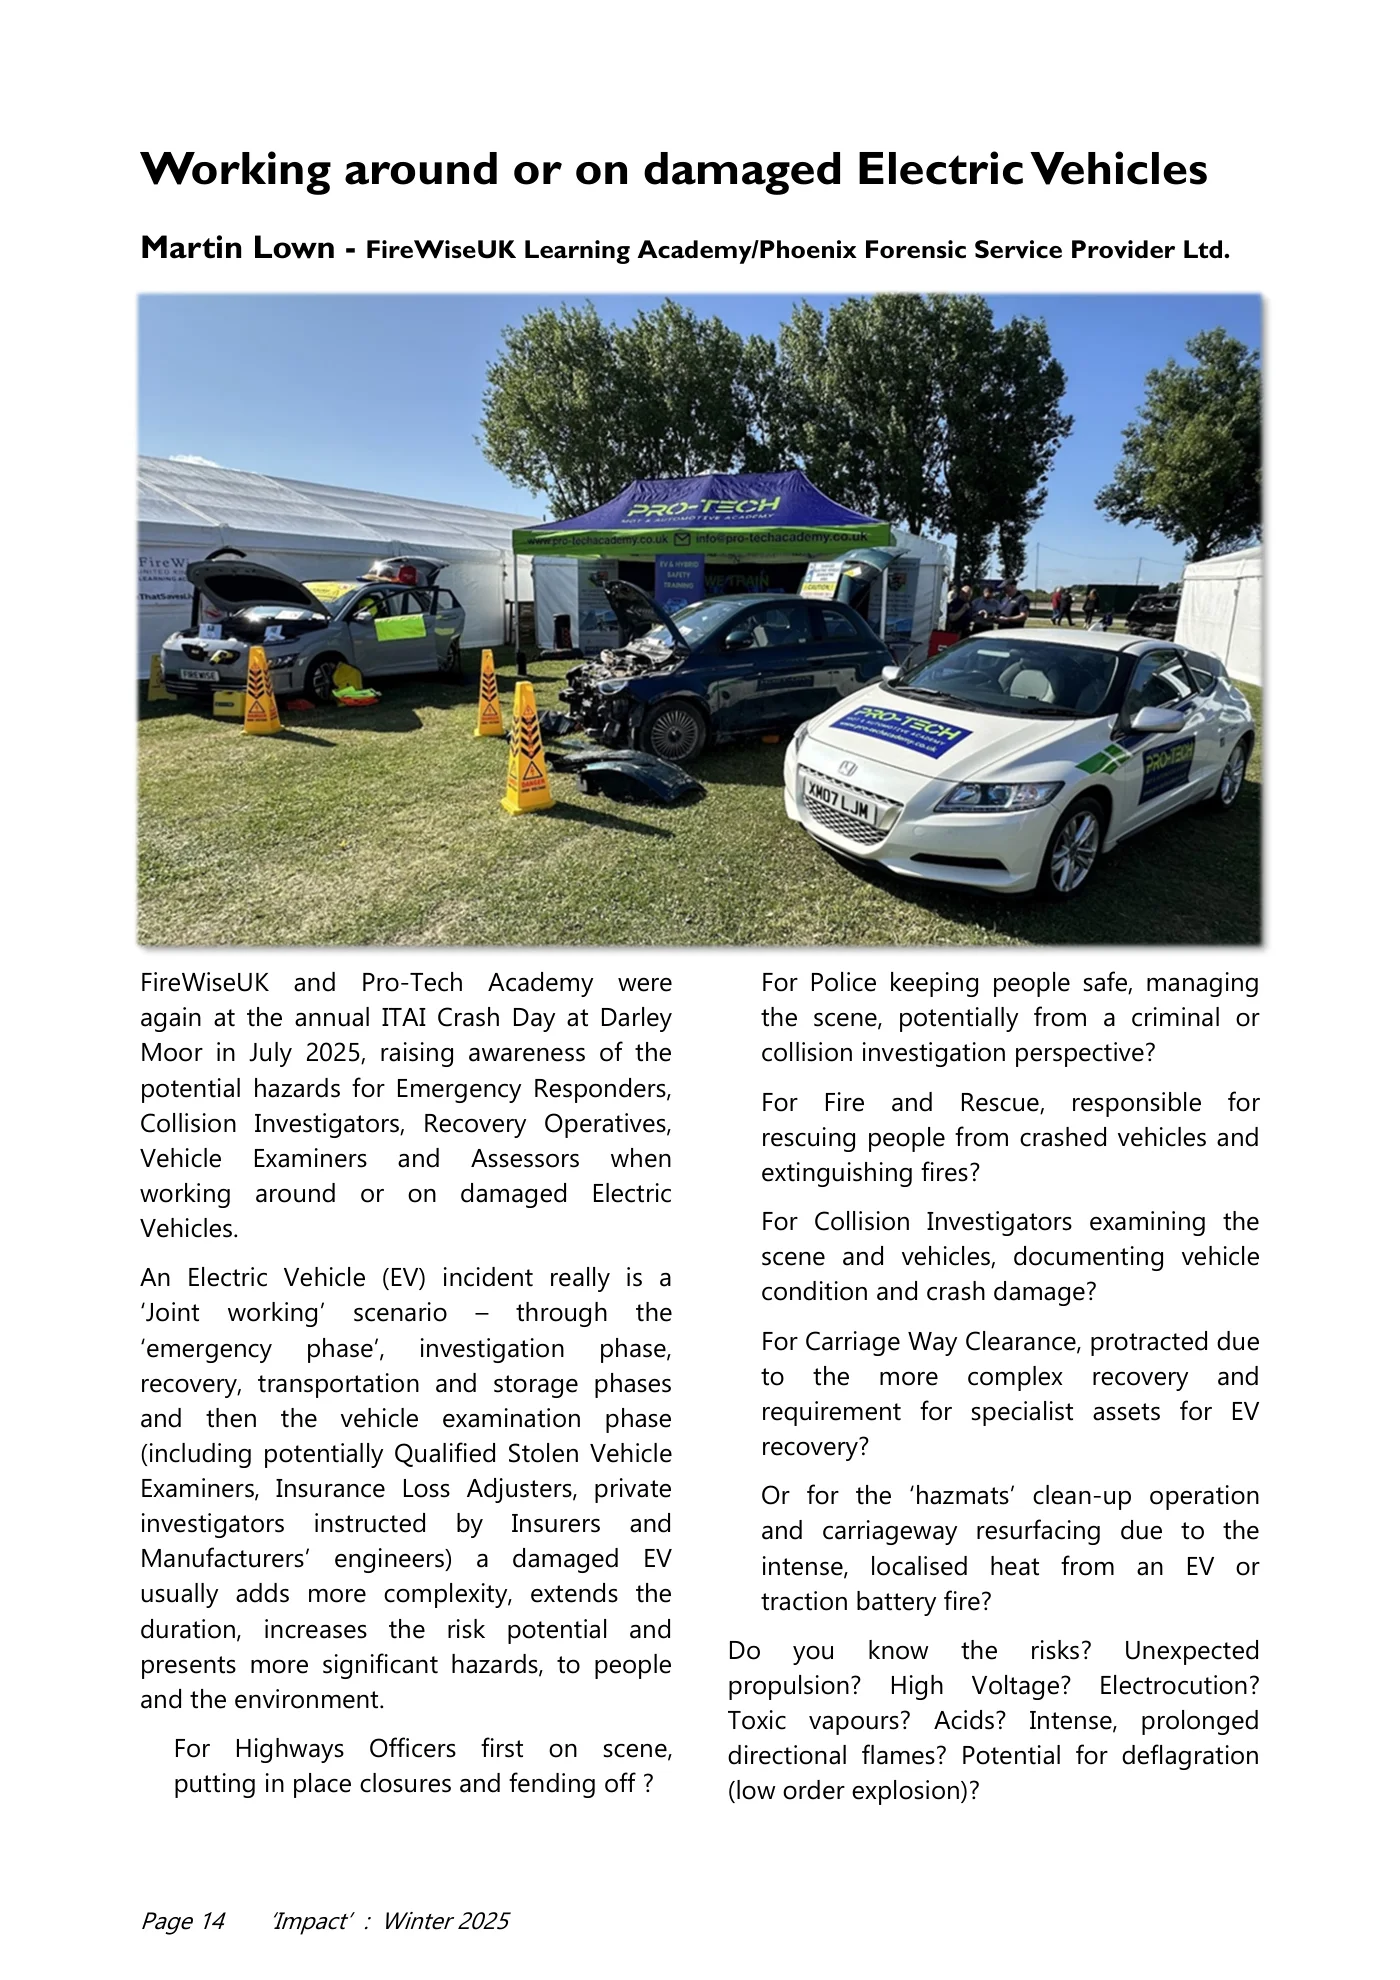
Page 14 ‘Impact’ : Winter 2025 Working around or on damaged Electric Vehicles Martin Lown - FireWiseUK Learning Academy/Phoenix Forensic Service Provider Ltd. FireWiseUK and Pro-Tech Academy were again at the annual ITAI Crash Day at Darley Moor in July 2025, raising awareness of the potential hazards for Emergency Responders, Collision Investigators, Recovery Operatives, Vehicle Examiners and Assessors when working around or on damaged Electric Vehicles. An Electric Vehicle (EV) incident really is a ‘Joint working’ scenario – through the ‘emergency phase’, investigation phase, recovery, transportation and storage phases and then the vehicle examination phase (including potentially Qualified Stolen Vehicle Examiners, Insurance Loss Adjusters, private investigators instructed by Insurers and Manufacturers’ engineers) a damaged EV usually adds more complexity, extends the duration, increases the risk potential and presents more significant hazards, to people and the environment. For Highways Officers first on scene, putting in place closures and fending off ? For Police keeping people safe, managing the scene, potentially from a criminal or collision investigation perspective? For Fire and Rescue, responsible for rescuing people from crashed vehicles and extinguishing fires? For Collision Investigators examining the scene and vehicles, documenting vehicle condition and crash damage? For Carriage Way Clearance, protracted due to the more complex recovery and requirement for specialist assets for EV recovery? Or for the ‘hazmats’ clean-up operation and carriageway resurfacing due to the intense, localised heat from an EV or traction battery fire? Do you know the risks? Unexpected propulsion? High Voltage? Electrocution? Toxic vapours? Acids? Intense, prolonged directional flames? Potential for deflagration (low order explosion)?
Read page 15 text
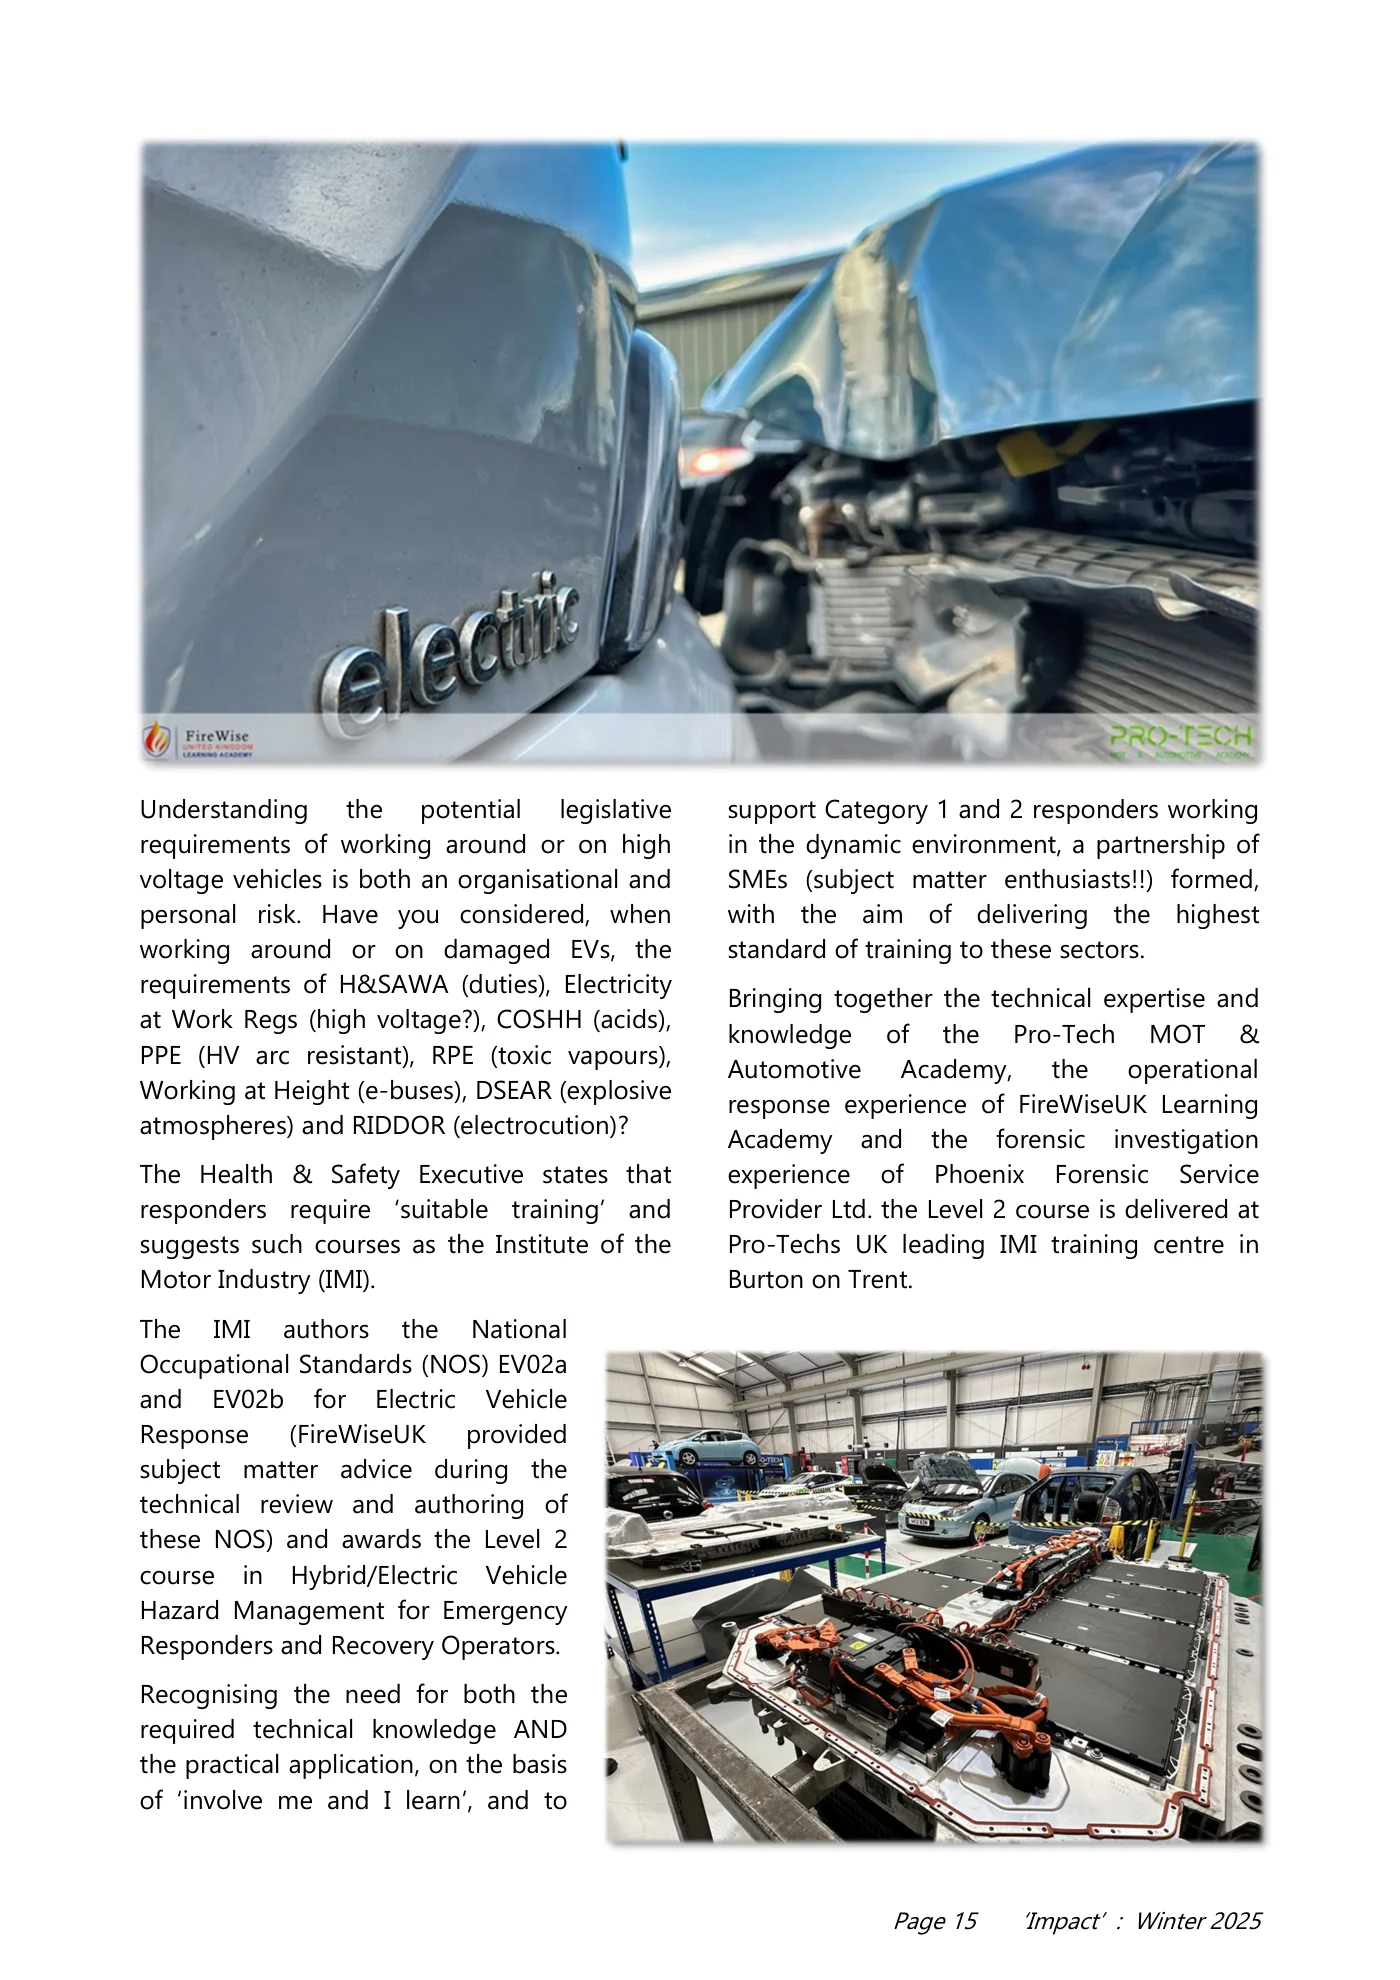
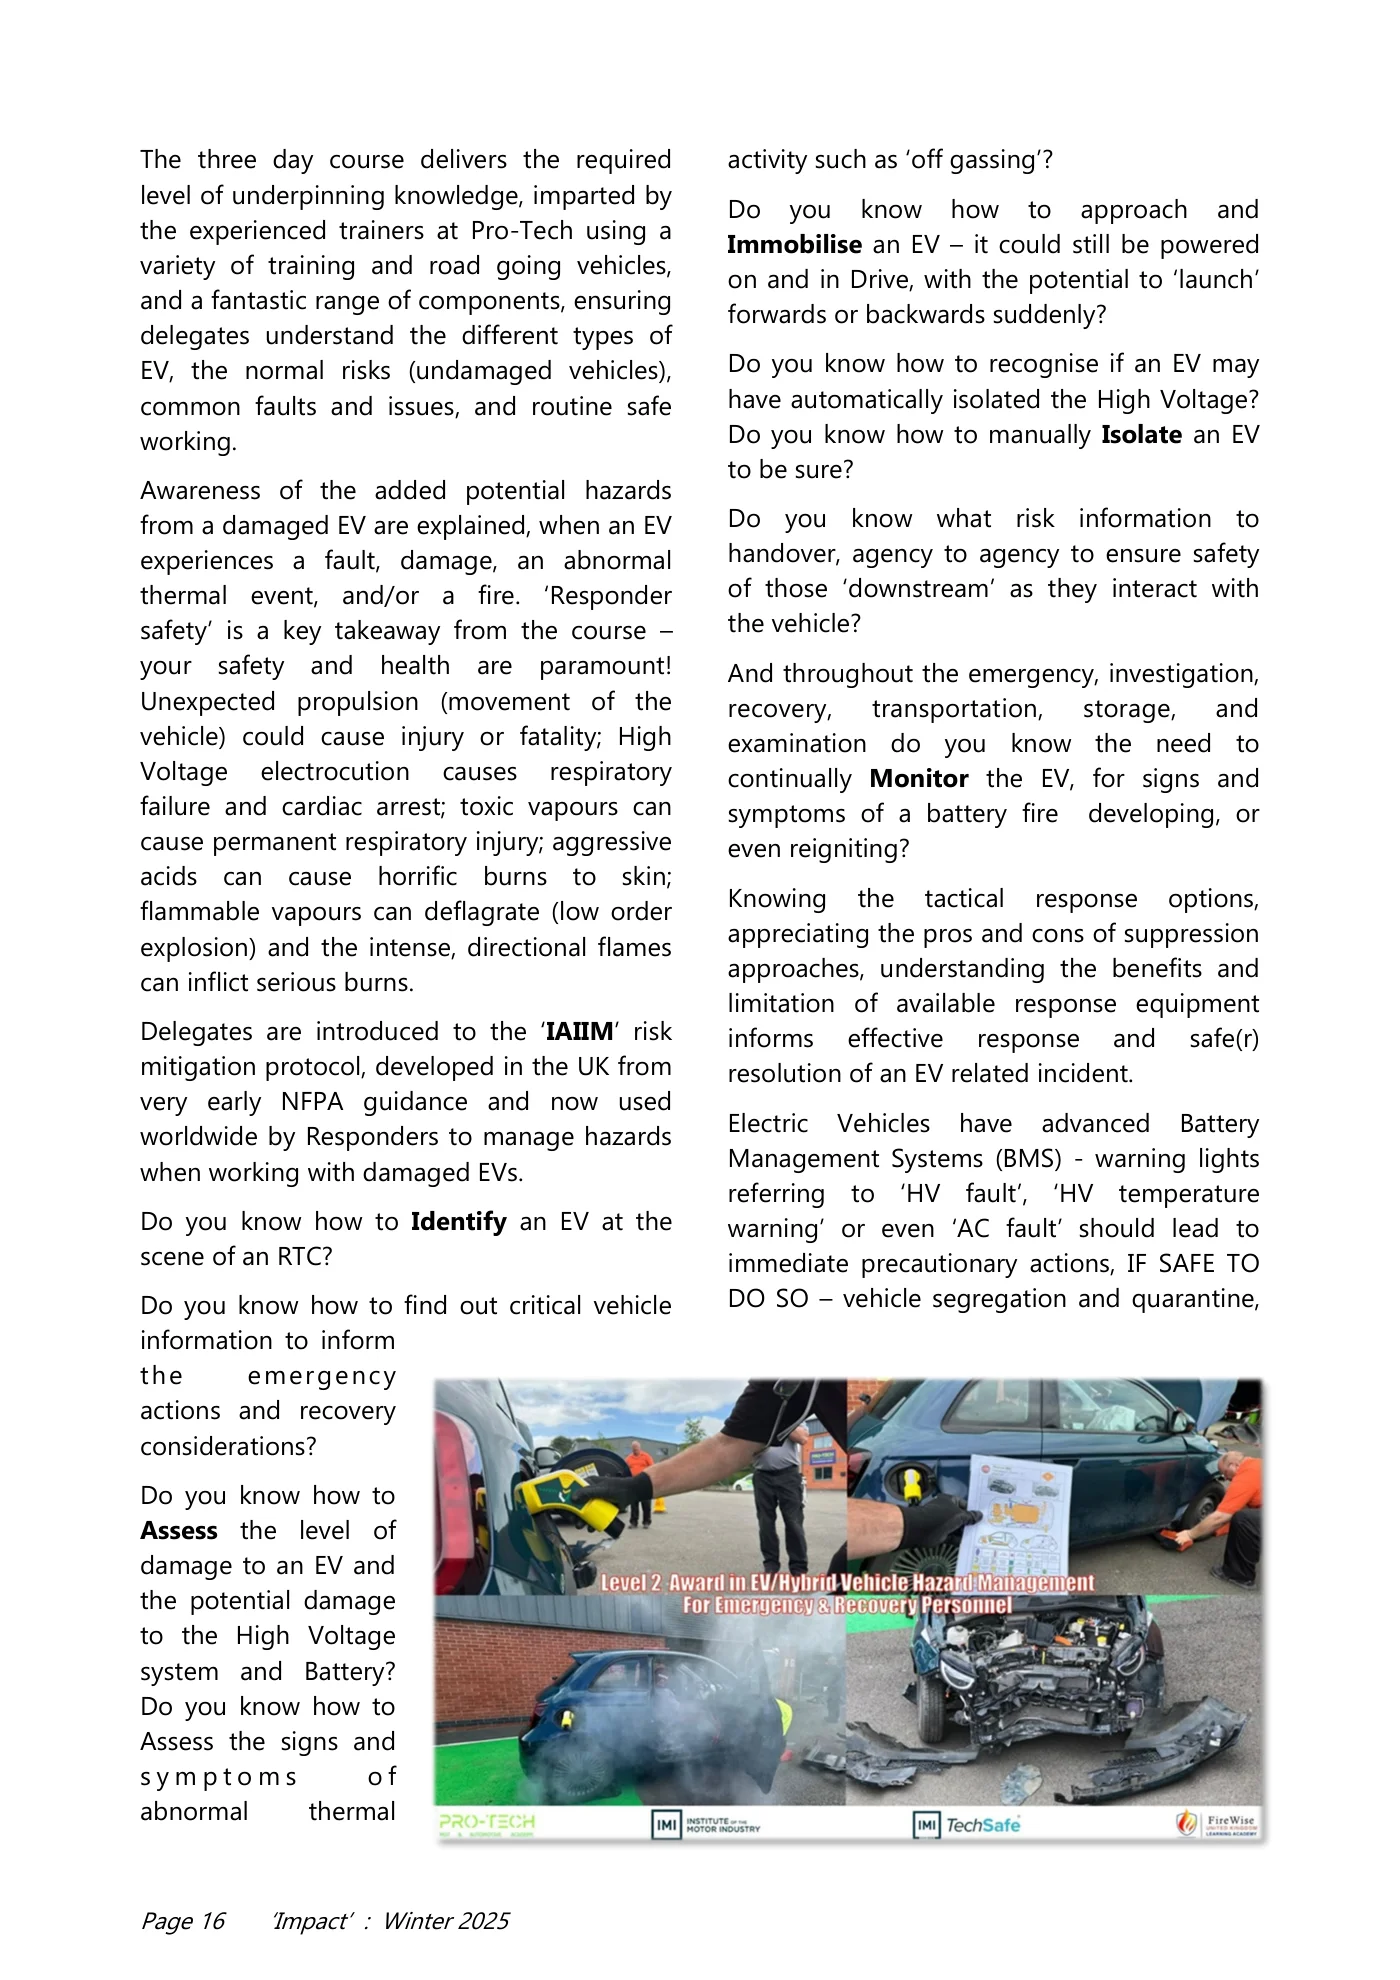
Page 15 ‘Impact’ : Winter 2025 Understanding the potential legislative requirements of working around or on high voltage vehicles is both an organisational and personal risk. Have you considered, when working around or on damaged EVs, the requirements of H&SAWA (duties), Electricity at Work Regs (high voltage?), COSHH (acids), PPE (HV arc resistant), RPE (toxic vapours), Working at Height (e-buses), DSEAR (explosive atmospheres) and RIDDOR (electrocution)? The Health & Safety Executive states that responders require ‘suitable training’ and suggests such courses as the Institute of the Motor Industry (IMI). The IMI authors the National Occupational Standards (NOS) EV02a and EV02b for Electric Vehicle Response (FireWiseUK provided subject matter advice during the technical review and authoring of these NOS) and awards the Level 2 course in Hybrid/Electric Vehicle Hazard Management for Emergency Responders and Recovery Operators. Recognising the need for both the required technical knowledge AND the practical application, on the basis of ‘involve me and I learn’, and to support Category 1 and 2 responders working in the dynamic environment, a partnership of SMEs (subject matter enthusiasts!!) formed, with the aim of delivering the highest standard of training to these sectors. Bringing together the technical expertise and knowledge of the Pro-Tech MOT & Automotive Academy, the operational response experience of FireWiseUK Learning Academy and the forensic investigation experience of Phoenix Forensic Service Provider Ltd. the Level 2 course is delivered at Pro-Techs UK leading IMI training centre in Burton on Trent.
Read page 16 text
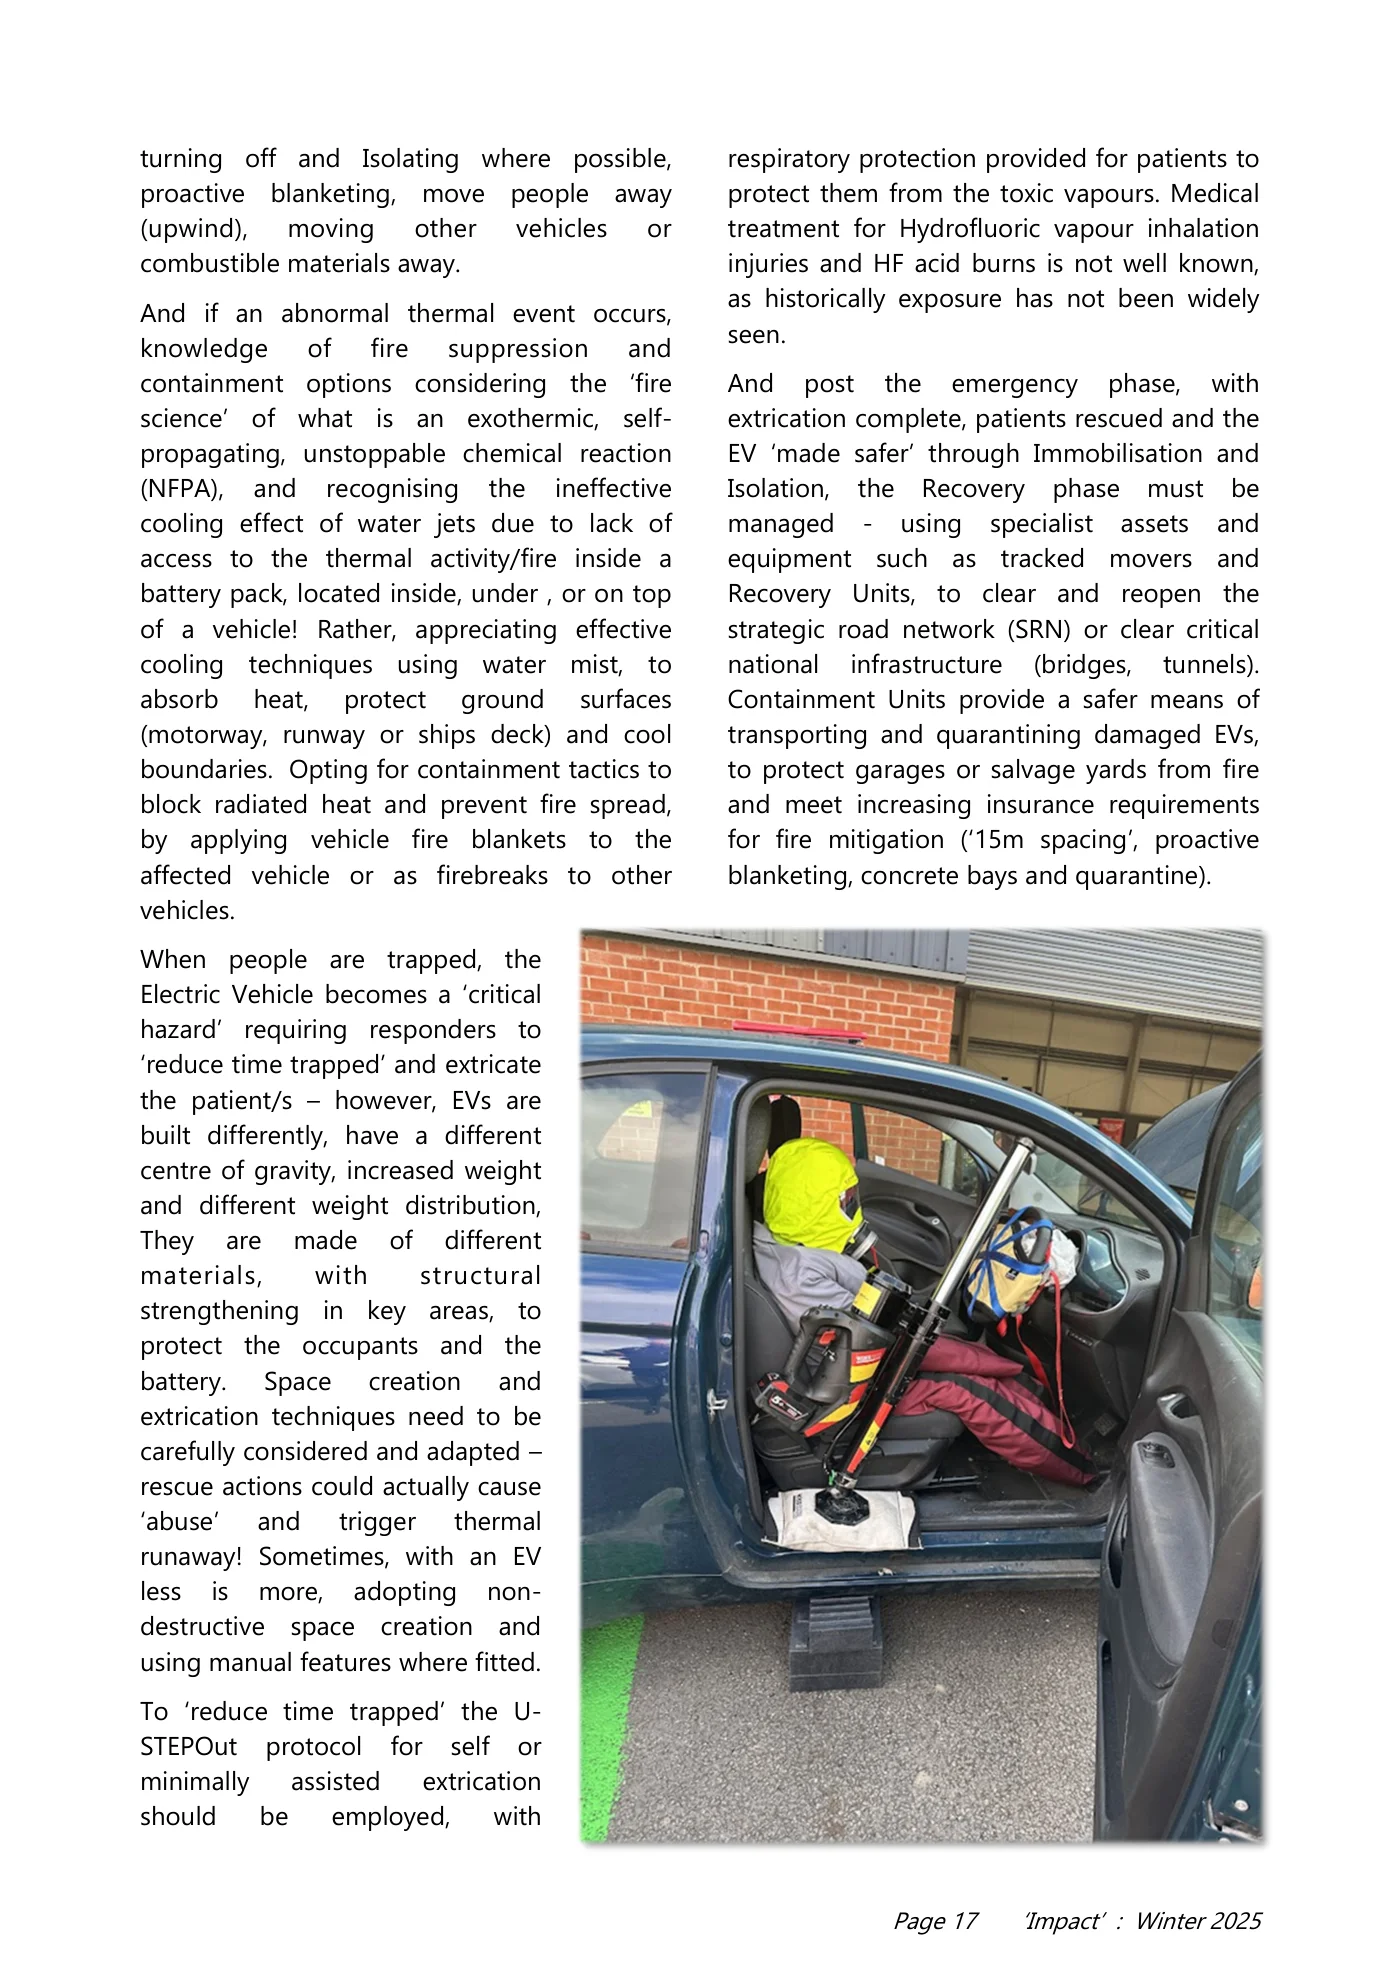
Page 16 ‘Impact’ : Winter 2025 The three day course delivers the required level of underpinning knowledge, imparted by the experienced trainers at Pro-Tech using a variety of training and road going vehicles, and a fantastic range of components, ensuring delegates understand the different types of EV, the normal risks (undamaged vehicles), common faults and issues, and routine safe working. Awareness of the added potential hazards from a damaged EV are explained, when an EV experiences a fault, damage, an abnormal thermal event, and/or a fire. ‘Responder safety’ is a key takeaway from the course – your safety and health are paramount! Unexpected propulsion (movement of the vehicle) could cause injury or fatality; High Voltage electrocution causes respiratory failure and cardiac arrest; toxic vapours can cause permanent respiratory injury; aggressive acids can cause horrific burns to skin; flammable vapours can deflagrate (low order explosion) and the intense, directional flames can inflict serious burns. Delegates are introduced to the ‘IAIIM’ risk mitigation protocol, developed in the UK from very early NFPA guidance and now used worldwide by Responders to manage hazards when working with damaged EVs. Do you know how to Identify an EV at the scene of an RTC? Do you know how to find out critical vehicle information to inform the emergency actions and recovery considerations? Do you know how to Assess the level of damage to an EV and the potential damage to the High Voltage system and Battery? Do you know how to Assess the signs and s y m p t o m s o f abnormal thermal activity such as ‘off gassing’? Do you know how to approach and Immobilise an EV – it could still be powered on and in Drive, with the potential to ‘launch’ forwards or backwards suddenly? Do you know how to recognise if an EV may have automatically isolated the High Voltage? Do you know how to manually Isolate an EV to be sure? Do you know what risk information to handover, agency to agency to ensure safety of those ‘downstream’ as they interact with the vehicle? And throughout the emergency, investigation, recovery, transportation, storage, and examination do you know the need to continually Monitor the EV, for signs and symptoms of a battery fire developing, or even reigniting? Knowing the tactical response options, appreciating the pros and cons of suppression approaches, understanding the benefits and limitation of available response equipment informs effective response and safe(r) resolution of an EV related incident. Electric Vehicles have advanced Battery Management Systems (BMS) - warning lights referring to ‘HV fault’, ‘HV temperature warning’ or even ‘AC fault’ should lead to immediate precautionary actions, IF SAFE TO DO SO – vehicle segregation and quarantine,
Read page 17 text
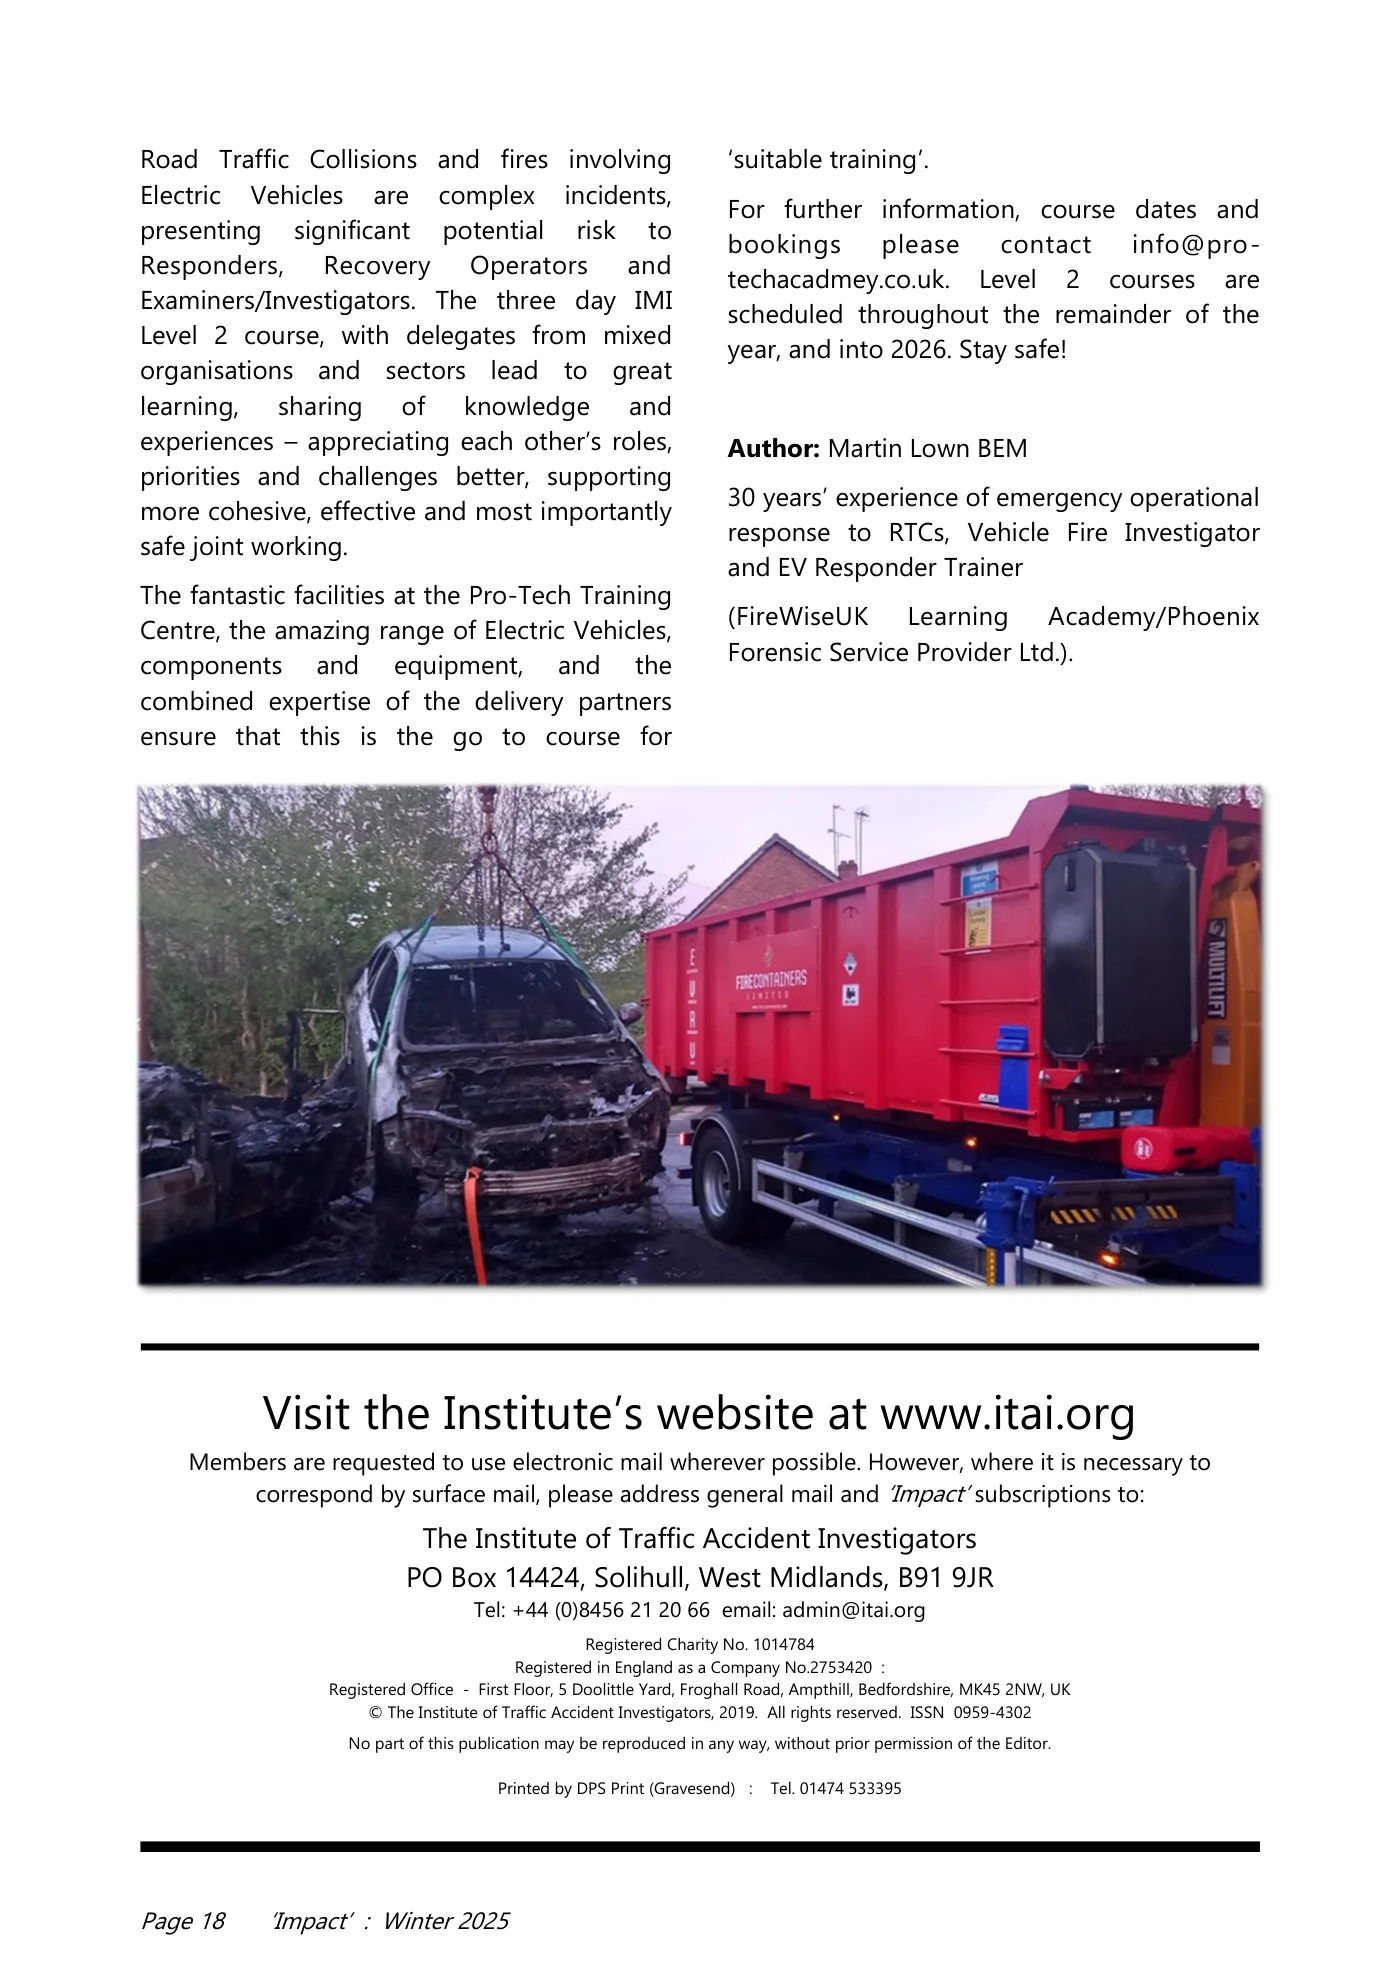
Page 17 ‘Impact’ : Winter 2025 turning off and Isolating where possible, proactive blanketing, move people away (upwind), moving other vehicles or combustible materials away. And if an abnormal thermal event occurs, knowledge of fire suppression and containment options considering the ‘fire science’ of what is an exothermic, self- propagating, unstoppable chemical reaction (NFPA), and recognising the ineffective cooling effect of water jets due to lack of access to the thermal activity/fire inside a battery pack, located inside, under , or on top of a vehicle! Rather, appreciating effective cooling techniques using water mist, to absorb heat, protect ground surfaces (motorway, runway or ships deck) and cool boundaries. Opting for containment tactics to block radiated heat and prevent fire spread, by applying vehicle fire blankets to the affected vehicle or as firebreaks to other vehicles. When people are trapped, the Electric Vehicle becomes a ‘critical hazard’ requiring responders to ‘reduce time trapped’ and extricate the patient/s – however, EVs are built differently, have a different centre of gravity, increased weight and different weight distribution, They are made of different materials, with structural strengthening in key areas, to protect the occupants and the battery. Space creation and extrication techniques need to be carefully considered and adapted – rescue actions could actually cause ‘abuse’ and trigger thermal runaway! Sometimes, with an EV less is more, adopting non- destructive space creation and using manual features where fitted. To ‘reduce time trapped’ the U- STEPOut protocol for self or minimally assisted extrication should be employed, with respiratory protection provided for patients to protect them from the toxic vapours. Medical treatment for Hydrofluoric vapour inhalation injuries and HF acid burns is not well known, as historically exposure has not been widely seen. And post the emergency phase, with extrication complete, patients rescued and the EV ‘made safer’ through Immobilisation and Isolation, the Recovery phase must be managed - using specialist assets and equipment such as tracked movers and Recovery Units, to clear and reopen the strategic road network (SRN) or clear critical national infrastructure (bridges, tunnels). Containment Units provide a safer means of transporting and quarantining damaged EVs, to protect garages or salvage yards from fire and meet increasing insurance requirements for fire mitigation (‘15m spacing’, proactive blanketing, concrete bays and quarantine).
Read page 18 text
Page 18 ‘Impact’ : Winter 2025 Road Traffic Collisions and fires involving Electric Vehicles are complex incidents, presenting significant potential risk to Responders, Recovery Operators and Examiners/Investigators. The three day IMI Level 2 course, with delegates from mixed organisations and sectors lead to great learning, sharing of knowledge and experiences – appreciating each other’s roles, priorities and challenges better, supporting more cohesive, effective and most importantly safe joint working. The fantastic facilities at the Pro-Tech Training Centre, the amazing range of Electric Vehicles, components and equipment, and the combined expertise of the delivery partners ensure that this is the go to course for ‘suitable training’. For further information, course dates and bookings please contact info@pro- techacadmey.co.uk. Level 2 courses are scheduled throughout the remainder of the year, and into 2026. Stay safe! Author: Martin Lown BEM 30 years’ experience of emergency operational response to RTCs, Vehicle Fire Investigator and EV Responder Trainer (FireWiseUK Learning Academy/Phoenix Forensic Service Provider Ltd.). Visit the Institute’s website at www.itai.org Members are requested to use electronic mail wherever possible. However, where it is necessary to correspond by surface mail, please address general mail and ‘Impact’ subscriptions to: The Institute of Traffic Accident Investigators PO Box 14424, Solihull, West Midlands, B91 9JR Tel: +44 (0)8456 21 20 66 email: admin@itai.org Registered Charity No. 1014784 Registered in England as a Company No.2753420 : Registered Office - First Floor, 5 Doolittle Yard, Froghall Road, Ampthill, Bedfordshire, MK45 2NW, UK © The Institute of Traffic Accident Investigators, 2019. All rights reserved. ISSN 0959-4302 No part of this publication may be reproduced in any way, without prior permission of the Editor. Printed by DPS Print (Gravesend) : Tel. 01474 533395

Read page 19 text
Page 19 ‘Impact’ : Winter 2025 Are you a Charted Engineer? If not, Why NOT? ITAI is a Professional Affiliate of the Engineering Council and as such we have developed a route to professional engineering registration for our members, so why not apply to become an Engineering Technician, an Incorporated Engineer or a Charted Engineer. There are 2 avenues to becoming registered: Qualification and/or Experience. The majority of our members, as well as having accident/collision investigation qualifications, also have a vast experience including training in ancillary subjects – to name a few: tyre / vehicle examination, CCTV and incident data analysis, PC-Crash, and so on. Putting all this together you will realise how experienced and qualified you are – so what are you waiting for? Full details are available in our members section on our website: www.itai.org Are you already a Charted Engineer? If so, you can have your registration transferred, FREE of charge to ITAI – all we need is a copy of your registration certificate – send it to: General Secretary at—gensec@itai.org
Read page 20 text
Page 20 ‘Impact’ : Winter 2025 EDR Data and Legal Background Event Data Recorder (EDR) systems, also known as vehicle "black boxes", are devices installed in vehicles that automatically record technical driving data and incident details in the event of a crash. Their primary function is to store key information about vehicle and driver behaviour before, during, and after a collision. This data may include vehicle speed, brake and accelerator pedal status, steering wheel angle, engine RPM, seatbelt usage, airbag deployment, and other values essential for traffic accident reconstruction. Legislation concerning EDR varies by region. In the United States, since 2012, new vehicles equipped with EDRs must comply with specifications outlined in 49 CFR Part 563. This regulation defines minimum requirements for data types, retention time, and access methods. In the European Union, the EDR function is being introduced under Regulation (EU) 2019/2144 on vehicle general safety, becoming mandatory for new M1 and N1 type -approved vehicles from July 2024. EDR data is frequently used in forensic practice, court proceedings, insurance claims, and traffic safety research. Its use is subject to data protection laws and vehicle owner rights. In many jurisdictions, access to the data requires the vehicle owner’s consent or a legal warrant. Therefore, when handling EDR data, it is crucial to respect proper evidence handling procedures, maintain chain of custody, and rely on professional interpretation of results. Bosch CDR: The Traditional Standard The Bosch Crash Data Retrieval system was developed in collaboration with Vetronix (later acquired by Bosch) and has been established since the early 2000s as the reference tool for retrieving data from airbag control modules (ACMs). It provides access to raw hexadecimal data, which is software-decoded into technical outputs—typically in tabular formats and pre- crash behaviour summaries. The system consists of a CDR Interface Module (CAN Plus, CDR 900), licensed Abstract This article presents a comprehensive comparison of Event Data Recorder (EDR) tools used in forensic vehicle crash analysis. It focuses on the Bosch CDR system, OEM diagnostic platforms such as Mercedes-Benz XENTRY and Hyundai/Kia GIT tool, and the mobile CrashScan EDR Kit by Collision Sciences. Through case studies involving (among others) Lexus, Mercedes-Benz, Land Rover, and Hyundai vehicles, the report evaluates each system’s compatibility, data accessibility, forensic usability, and legal defensibility. Particular emphasis is placed on CrashScan’s broader brand support, contextual reporting, and suitability for independent experts. The results highlight the practical value of field-ready tools like CrashScan in scenarios where traditional OEM or Bosch systems are restricted or unsupported. Field-Compatible Event Data Recorder Analysis: Comparative Evaluation of Bosch CDR, OEM Platforms (XENTRY, GIT Tool), and CrashScan for Forensic Use Ing. Peter Vertal, Ph.D. Institute of Forensic Engineering, University of Zilina,
Read page 21 text
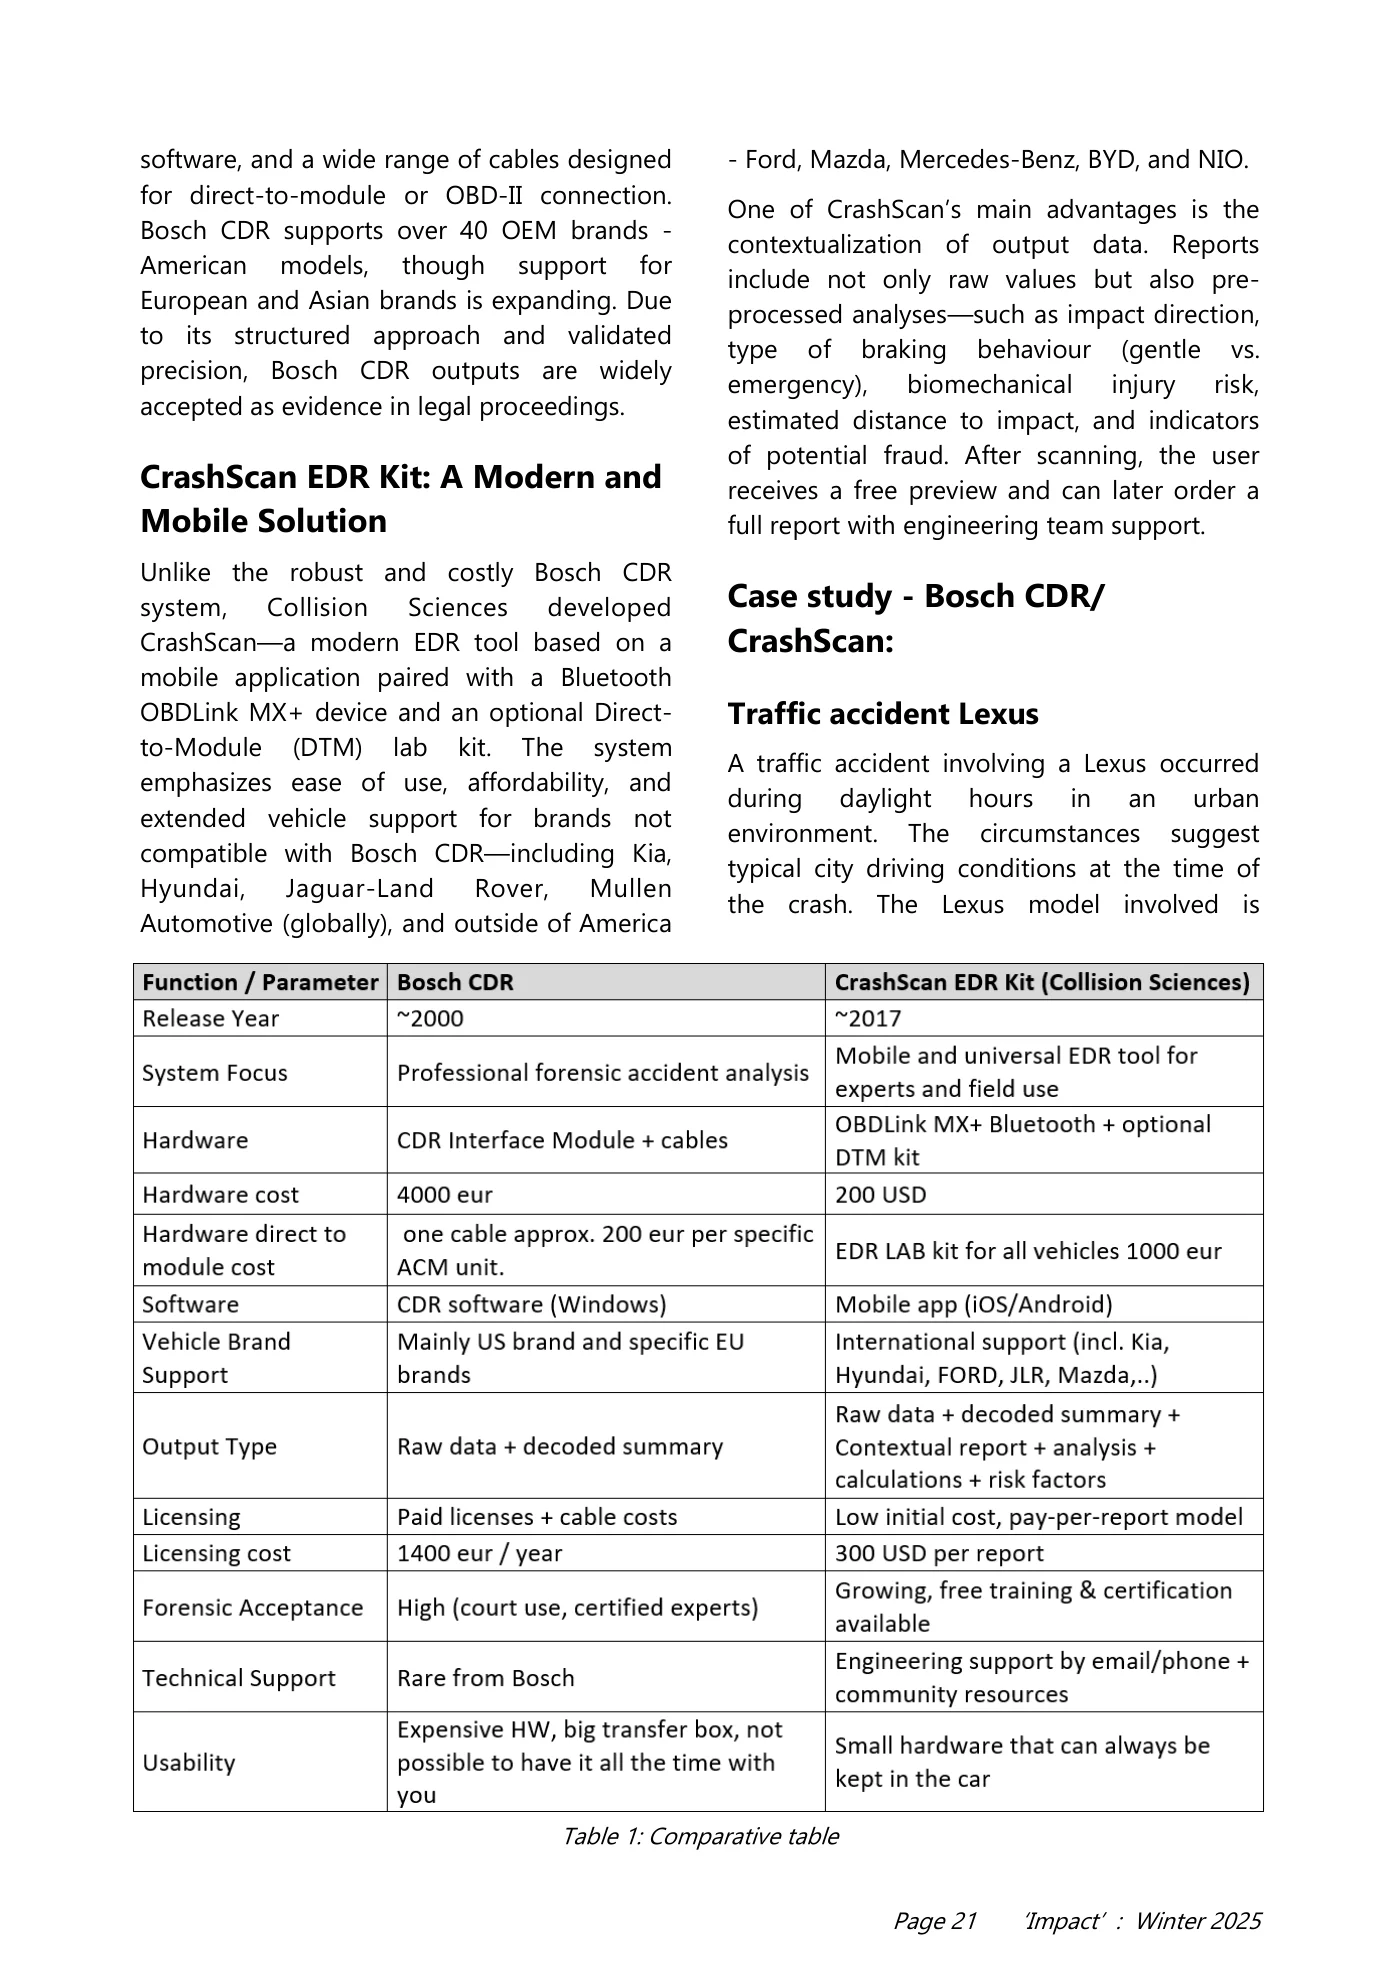
Page 21 ‘Impact’ : Winter 2025 software, and a wide range of cables designed for direct-to-module or OBD-II connection. Bosch CDR supports over 40 OEM brands - American models, though support for European and Asian brands is expanding. Due to its structured approach and validated precision, Bosch CDR outputs are widely accepted as evidence in legal proceedings. CrashScan EDR Kit: A Modern and Mobile Solution Unlike the robust and costly Bosch CDR system, Collision Sciences developed CrashScan—a modern EDR tool based on a mobile application paired with a Bluetooth OBDLink MX+ device and an optional Direct- to-Module (DTM) lab kit. The system emphasizes ease of use, affordability, and extended vehicle support for brands not compatible with Bosch CDR—including Kia, Hyundai, Jaguar-Land Rover, Mullen Automotive (globally), and outside of America - Ford, Mazda, Mercedes-Benz, BYD, and NIO. One of CrashScan’s main advantages is the contextualization of output data. Reports include not only raw values but also pre- processed analyses—such as impact direction, type of braking behaviour (gentle vs. emergency), biomechanical injury risk, estimated distance to impact, and indicators of potential fraud. After scanning, the user receives a free preview and can later order a full report with engineering team support. Case study - Bosch CDR/ CrashScan: Traffic accident Lexus A traffic accident involving a Lexus occurred during daylight hours in an urban environment. The circumstances suggest typical city driving conditions at the time of the crash. The Lexus model involved is Table 1: Comparative table
Read page 22 text
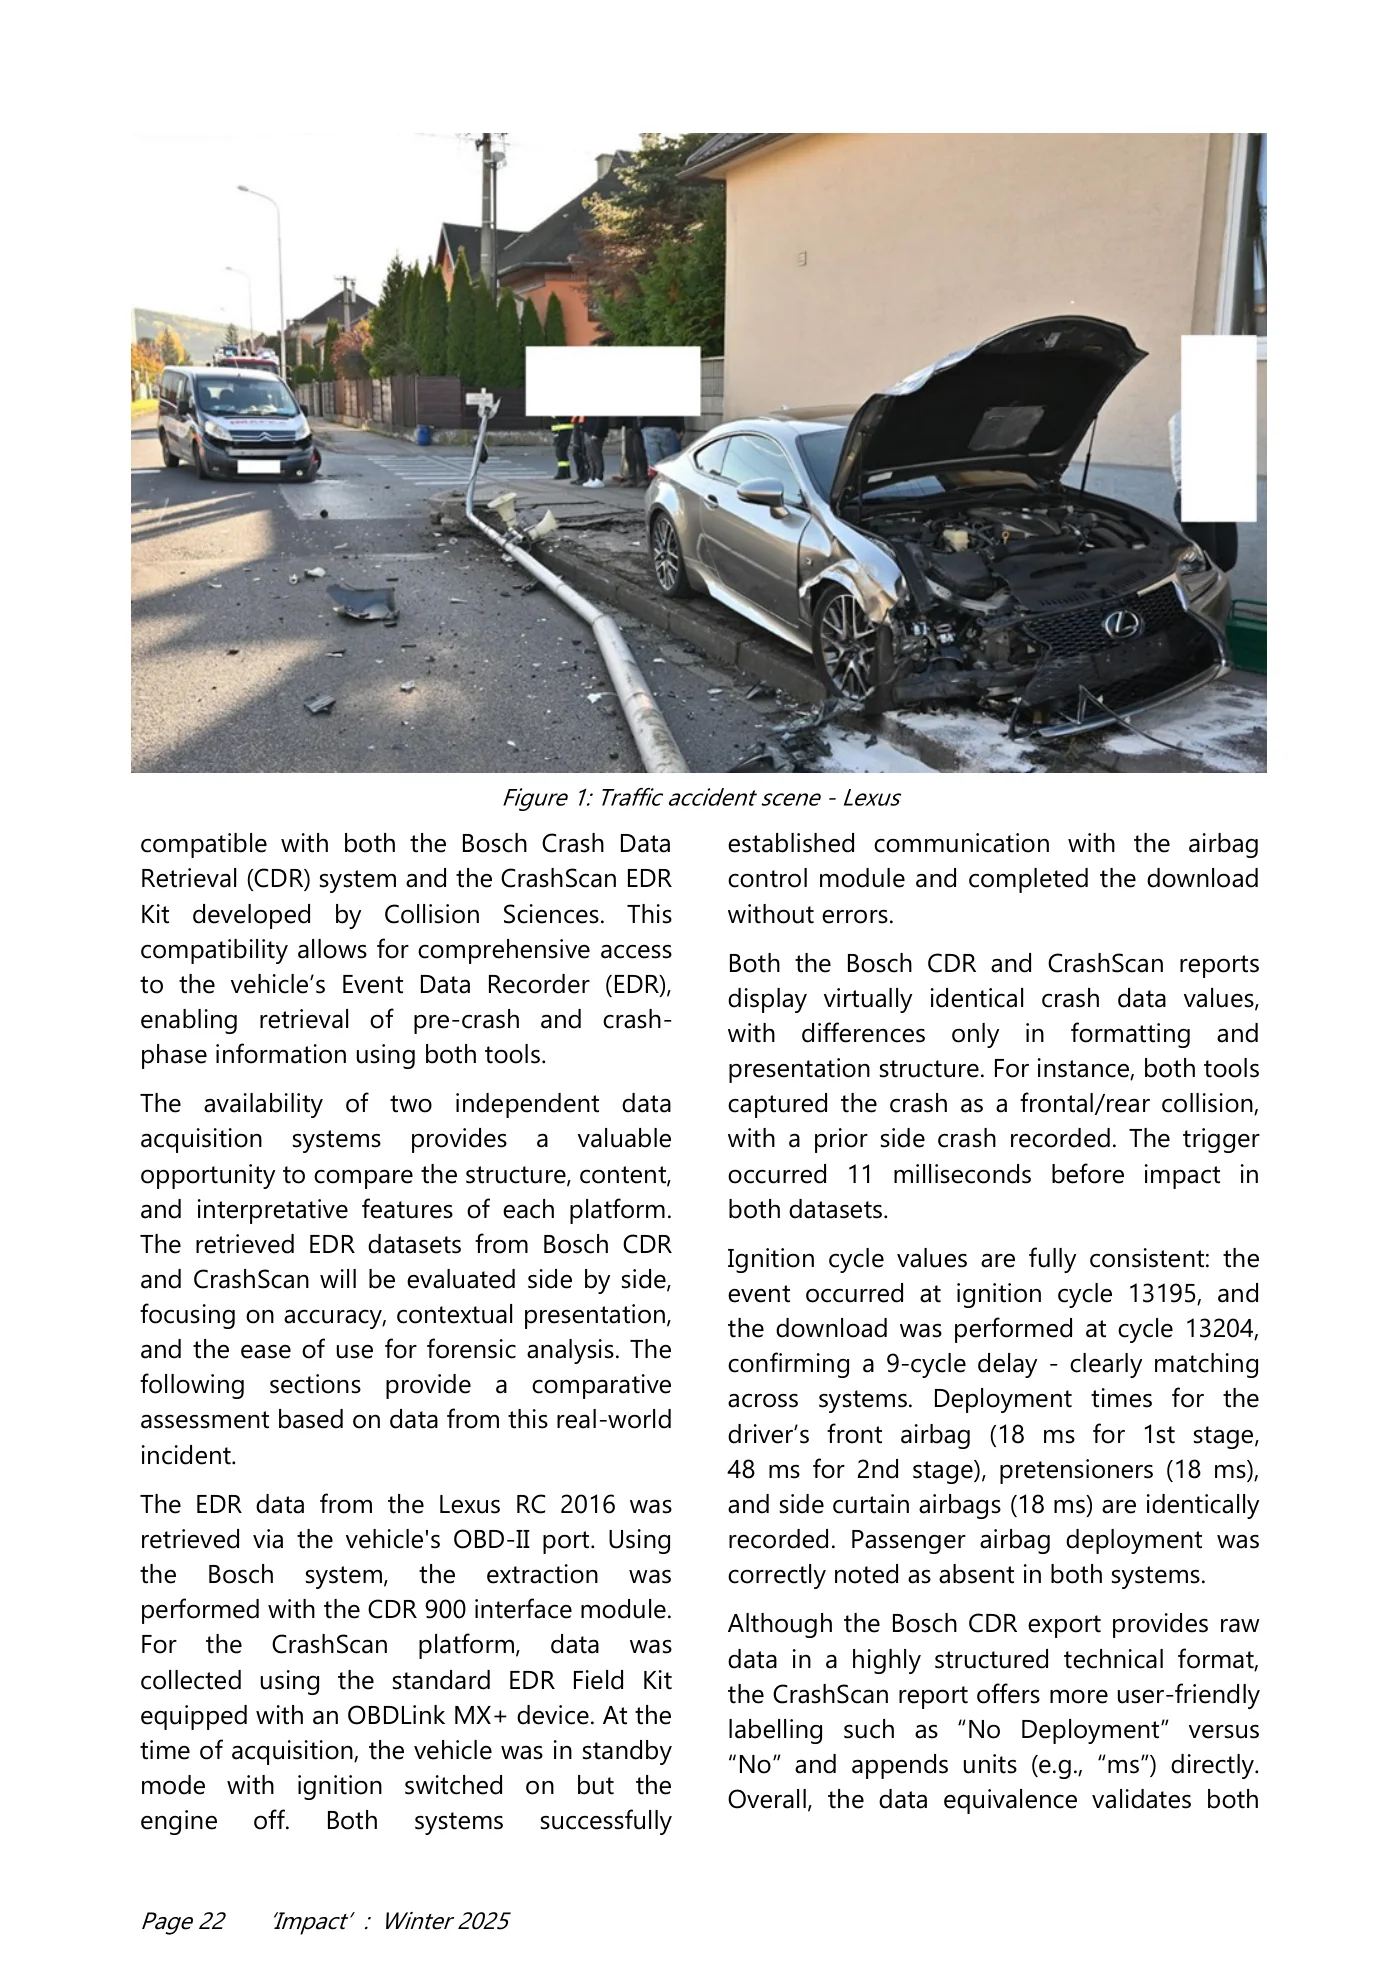
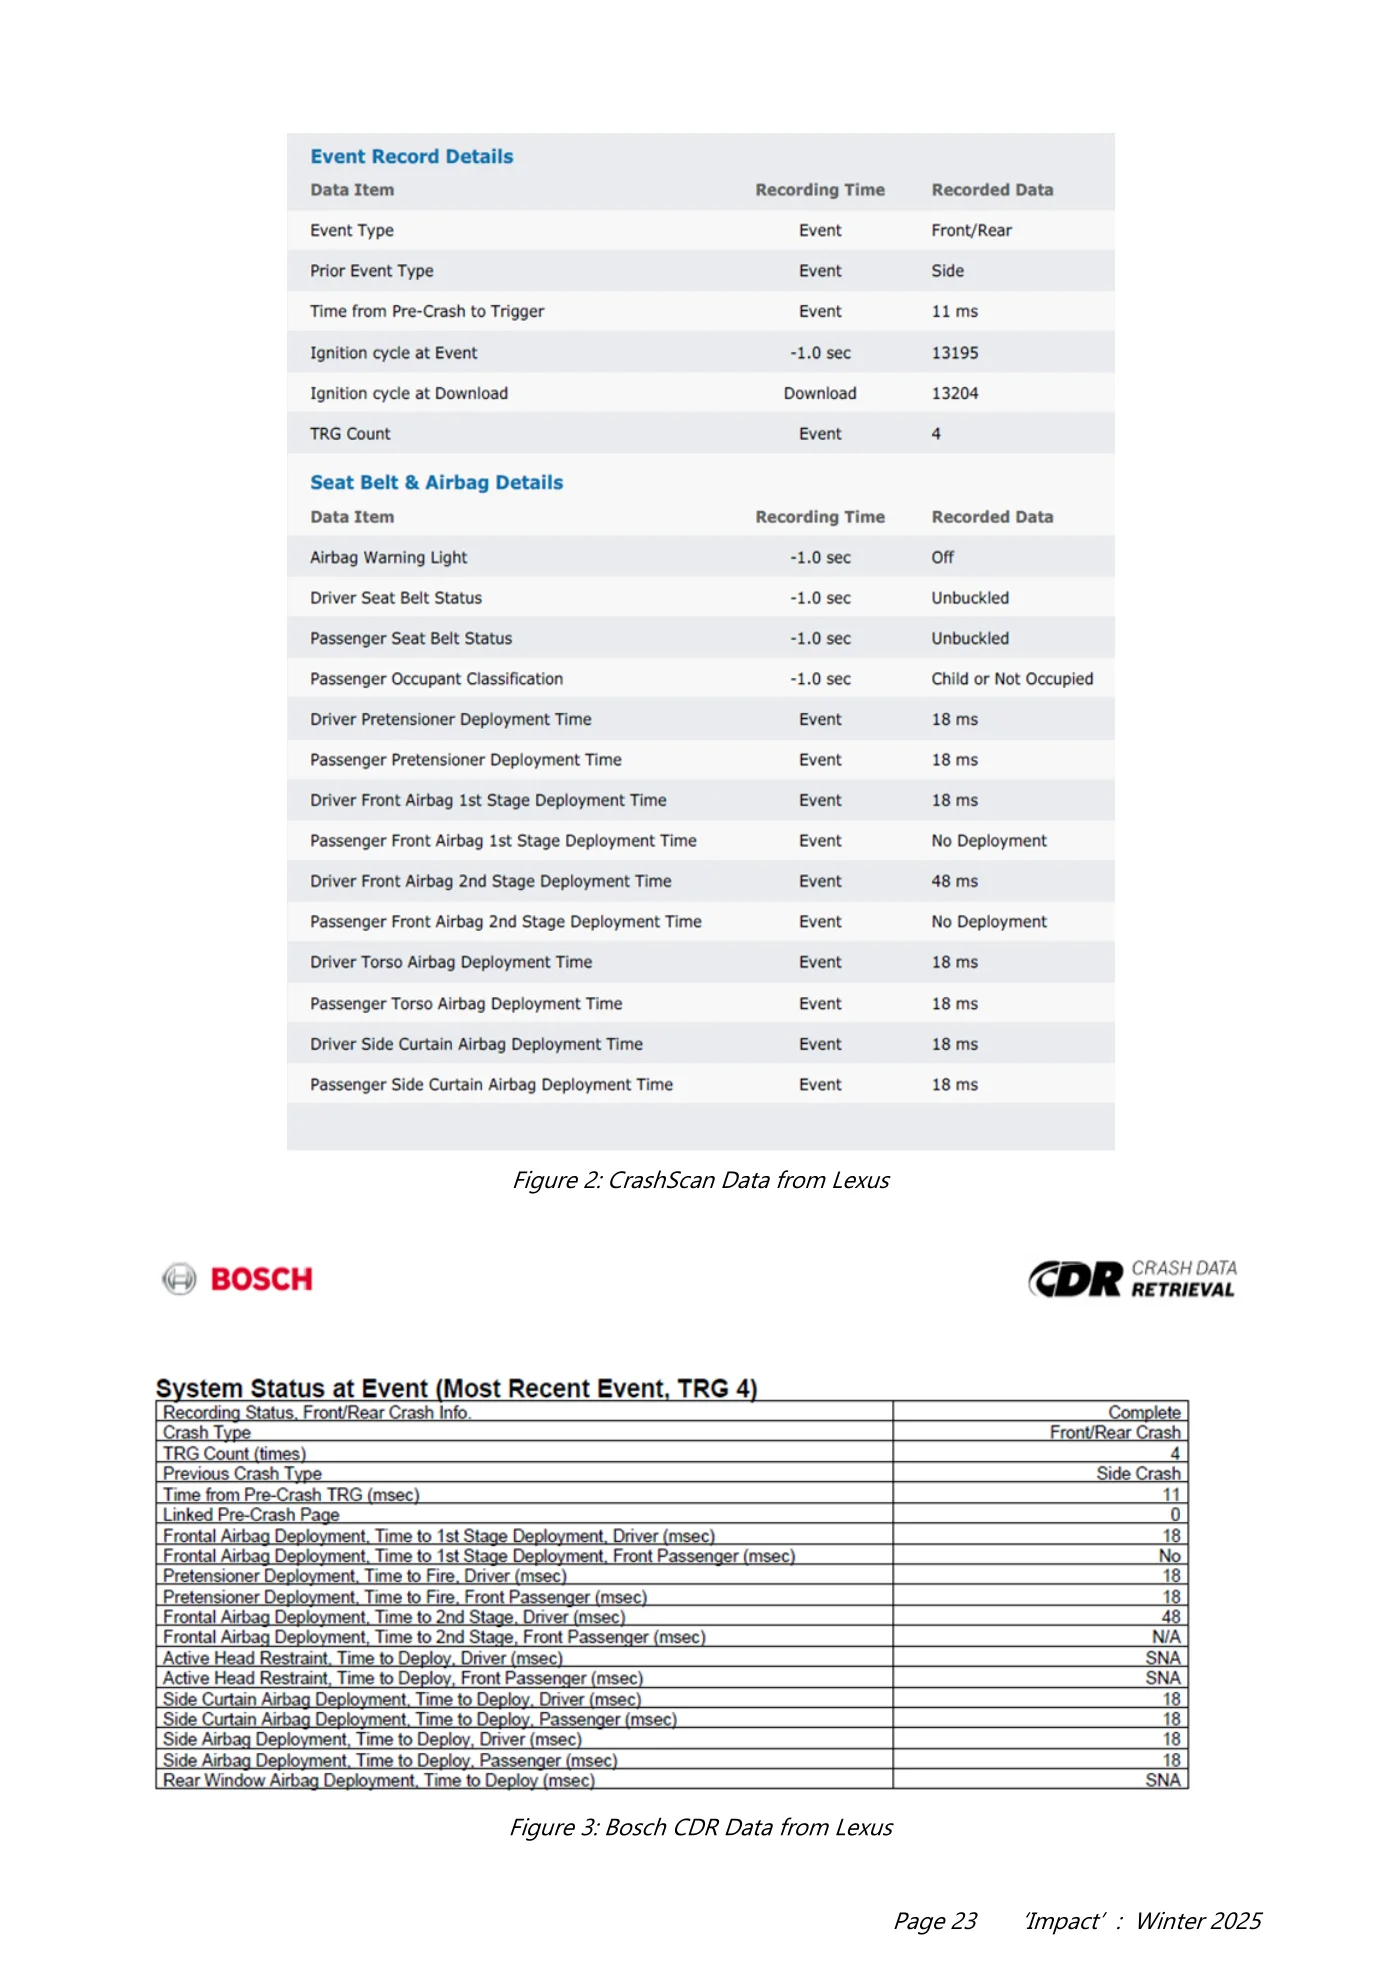
Page 22 ‘Impact’ : Winter 2025 compatible with both the Bosch Crash Data Retrieval (CDR) system and the CrashScan EDR Kit developed by Collision Sciences. This compatibility allows for comprehensive access to the vehicle’s Event Data Recorder (EDR), enabling retrieval of pre-crash and crash- phase information using both tools. The availability of two independent data acquisition systems provides a valuable opportunity to compare the structure, content, and interpretative features of each platform. The retrieved EDR datasets from Bosch CDR and CrashScan will be evaluated side by side, focusing on accuracy, contextual presentation, and the ease of use for forensic analysis. The following sections provide a comparative assessment based on data from this real-world incident. The EDR data from the Lexus RC 2016 was retrieved via the vehicle's OBD-II port. Using the Bosch system, the extraction was performed with the CDR 900 interface module. For the CrashScan platform, data was collected using the standard EDR Field Kit equipped with an OBDLink MX+ device. At the time of acquisition, the vehicle was in standby mode with ignition switched on but the engine off. Both systems successfully established communication with the airbag control module and completed the download without errors. Both the Bosch CDR and CrashScan reports display virtually identical crash data values, with differences only in formatting and presentation structure. For instance, both tools captured the crash as a frontal/rear collision, with a prior side crash recorded. The trigger occurred 11 milliseconds before impact in both datasets. Ignition cycle values are fully consistent: the event occurred at ignition cycle 13195, and the download was performed at cycle 13204, confirming a 9-cycle delay - clearly matching across systems. Deployment times for the driver’s front airbag (18 ms for 1st stage, 48 ms for 2nd stage), pretensioners (18 ms), and side curtain airbags (18 ms) are identically recorded. Passenger airbag deployment was correctly noted as absent in both systems. Although the Bosch CDR export provides raw data in a highly structured technical format, the CrashScan report offers more user-friendly labelling such as “No Deployment” versus “No” and appends units (e.g., “ms”) directly. Overall, the data equivalence validates both Figure 1: Traffic accident scene - Lexus
Read page 23 text
Page 23 ‘Impact’ : Winter 2025 Figure 2: CrashScan Data from Lexus Figure 3: Bosch CDR Data from Lexus
Read page 24 text
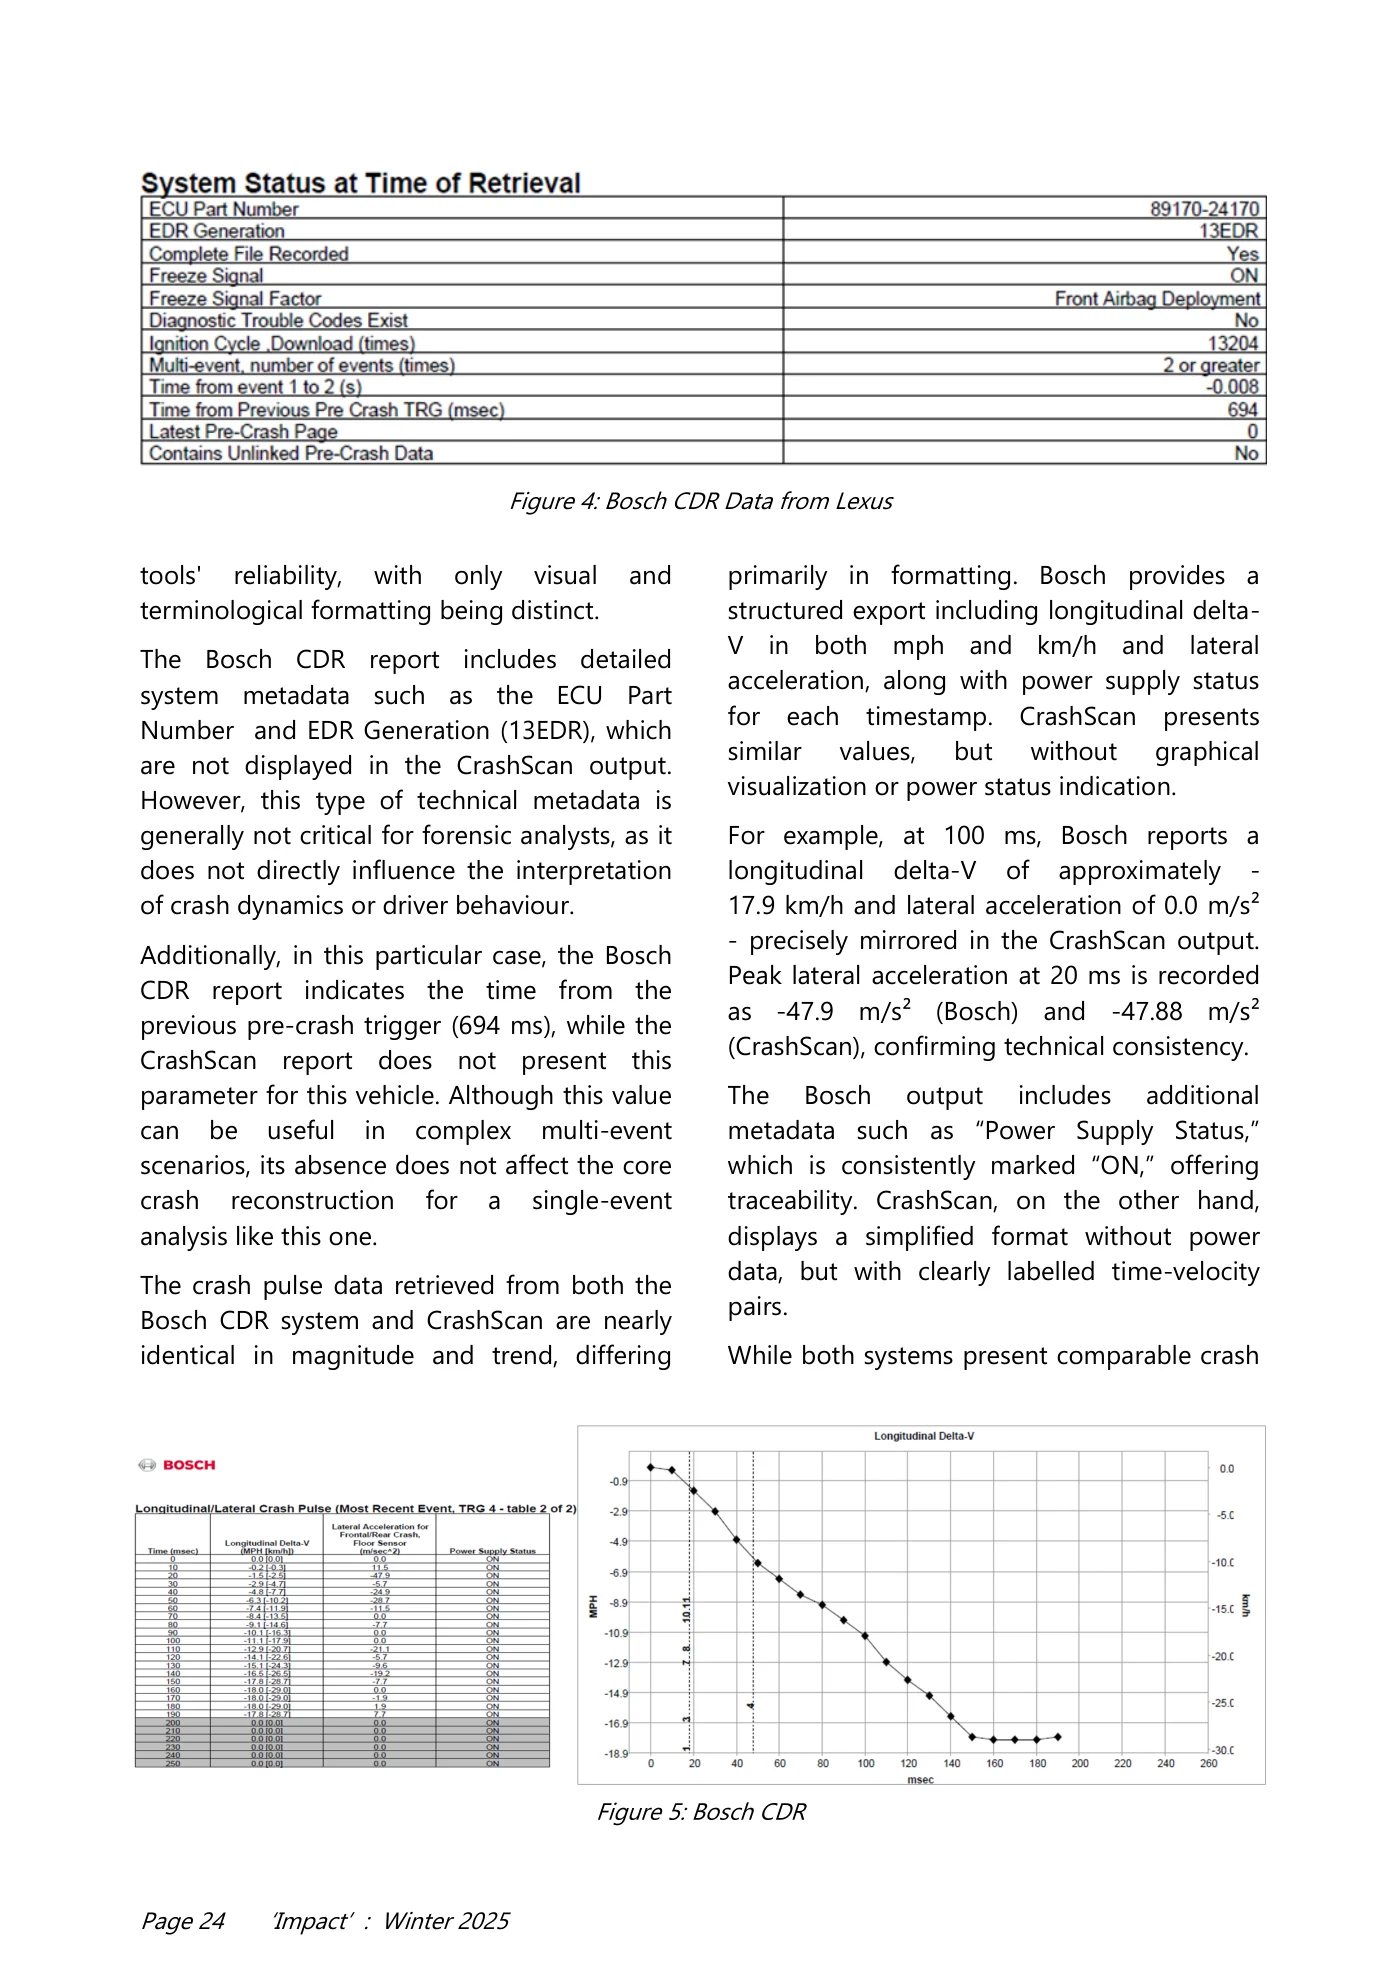
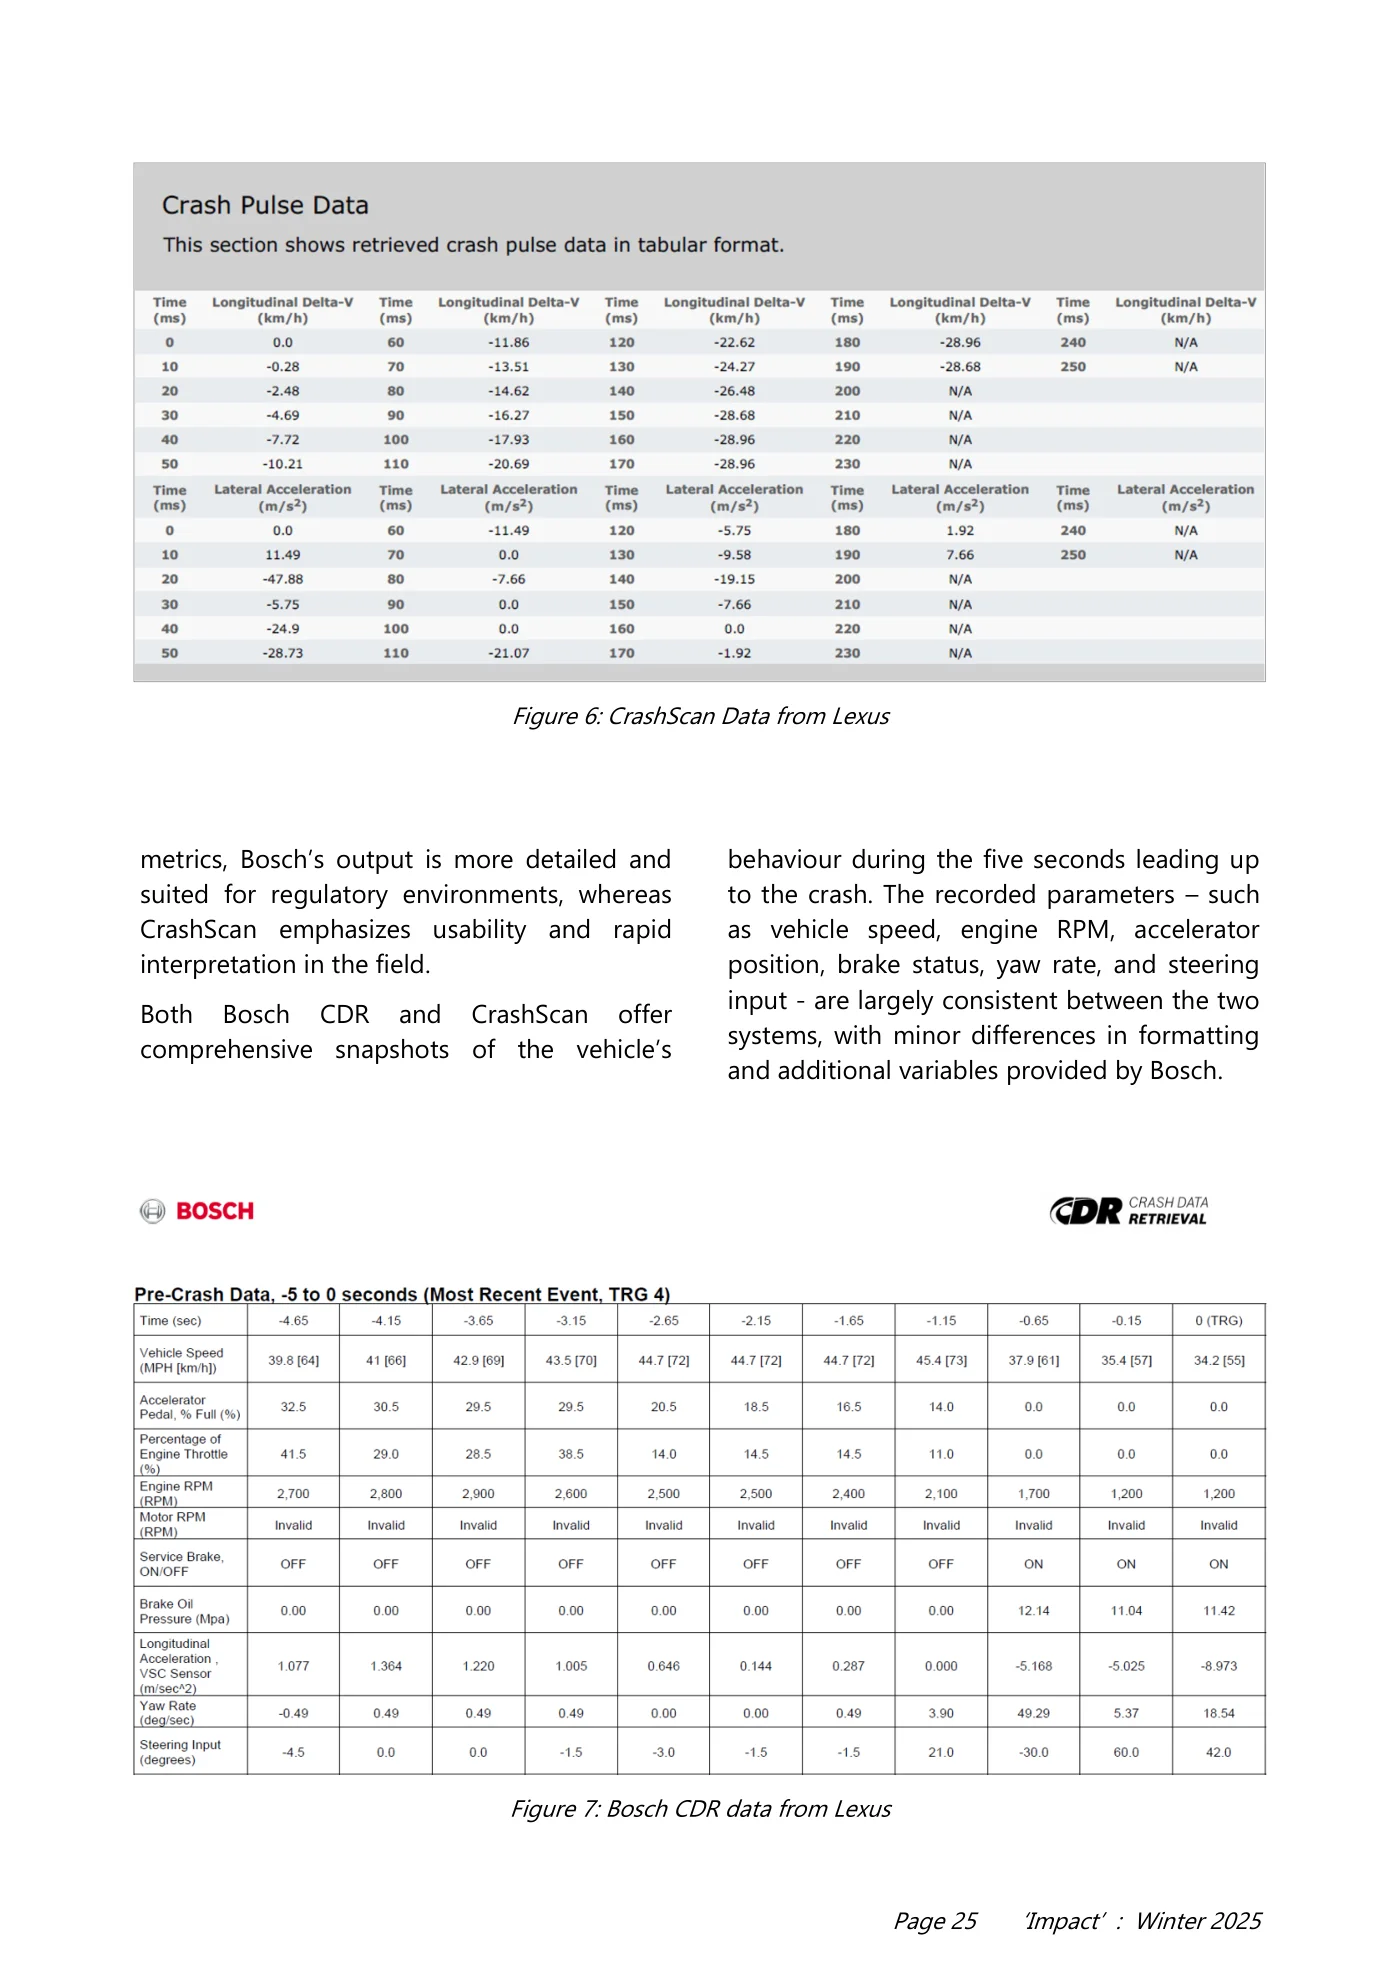
Page 24 ‘Impact’ : Winter 2025 tools' reliability, with only visual and terminological formatting being distinct. The Bosch CDR report includes detailed system metadata such as the ECU Part Number and EDR Generation (13EDR), which are not displayed in the CrashScan output. However, this type of technical metadata is generally not critical for forensic analysts, as it does not directly influence the interpretation of crash dynamics or driver behaviour. Additionally, in this particular case, the Bosch CDR report indicates the time from the previous pre-crash trigger (694 ms), while the CrashScan report does not present this parameter for this vehicle. Although this value can be useful in complex multi-event scenarios, its absence does not affect the core crash reconstruction for a single-event analysis like this one. The crash pulse data retrieved from both the Bosch CDR system and CrashScan are nearly identical in magnitude and trend, differing primarily in formatting. Bosch provides a structured export including longitudinal delta- V in both mph and km/h and lateral acceleration, along with power supply status for each timestamp. CrashScan presents similar values, but without graphical visualization or power status indication. For example, at 100 ms, Bosch reports a longitudinal delta-V of approximately - 17.9 km/h and lateral acceleration of 0.0 m/s² - precisely mirrored in the CrashScan output. Peak lateral acceleration at 20 ms is recorded as -47.9 m/s² (Bosch) and -47.88 m/s² (CrashScan), confirming technical consistency. The Bosch output includes additional metadata such as “Power Supply Status,” which is consistently marked “ON,” offering traceability. CrashScan, on the other hand, displays a simplified format without power data, but with clearly labelled time-velocity pairs. While both systems present comparable crash Figure 4: Bosch CDR Data from Lexus Figure 5: Bosch CDR
Read page 25 text
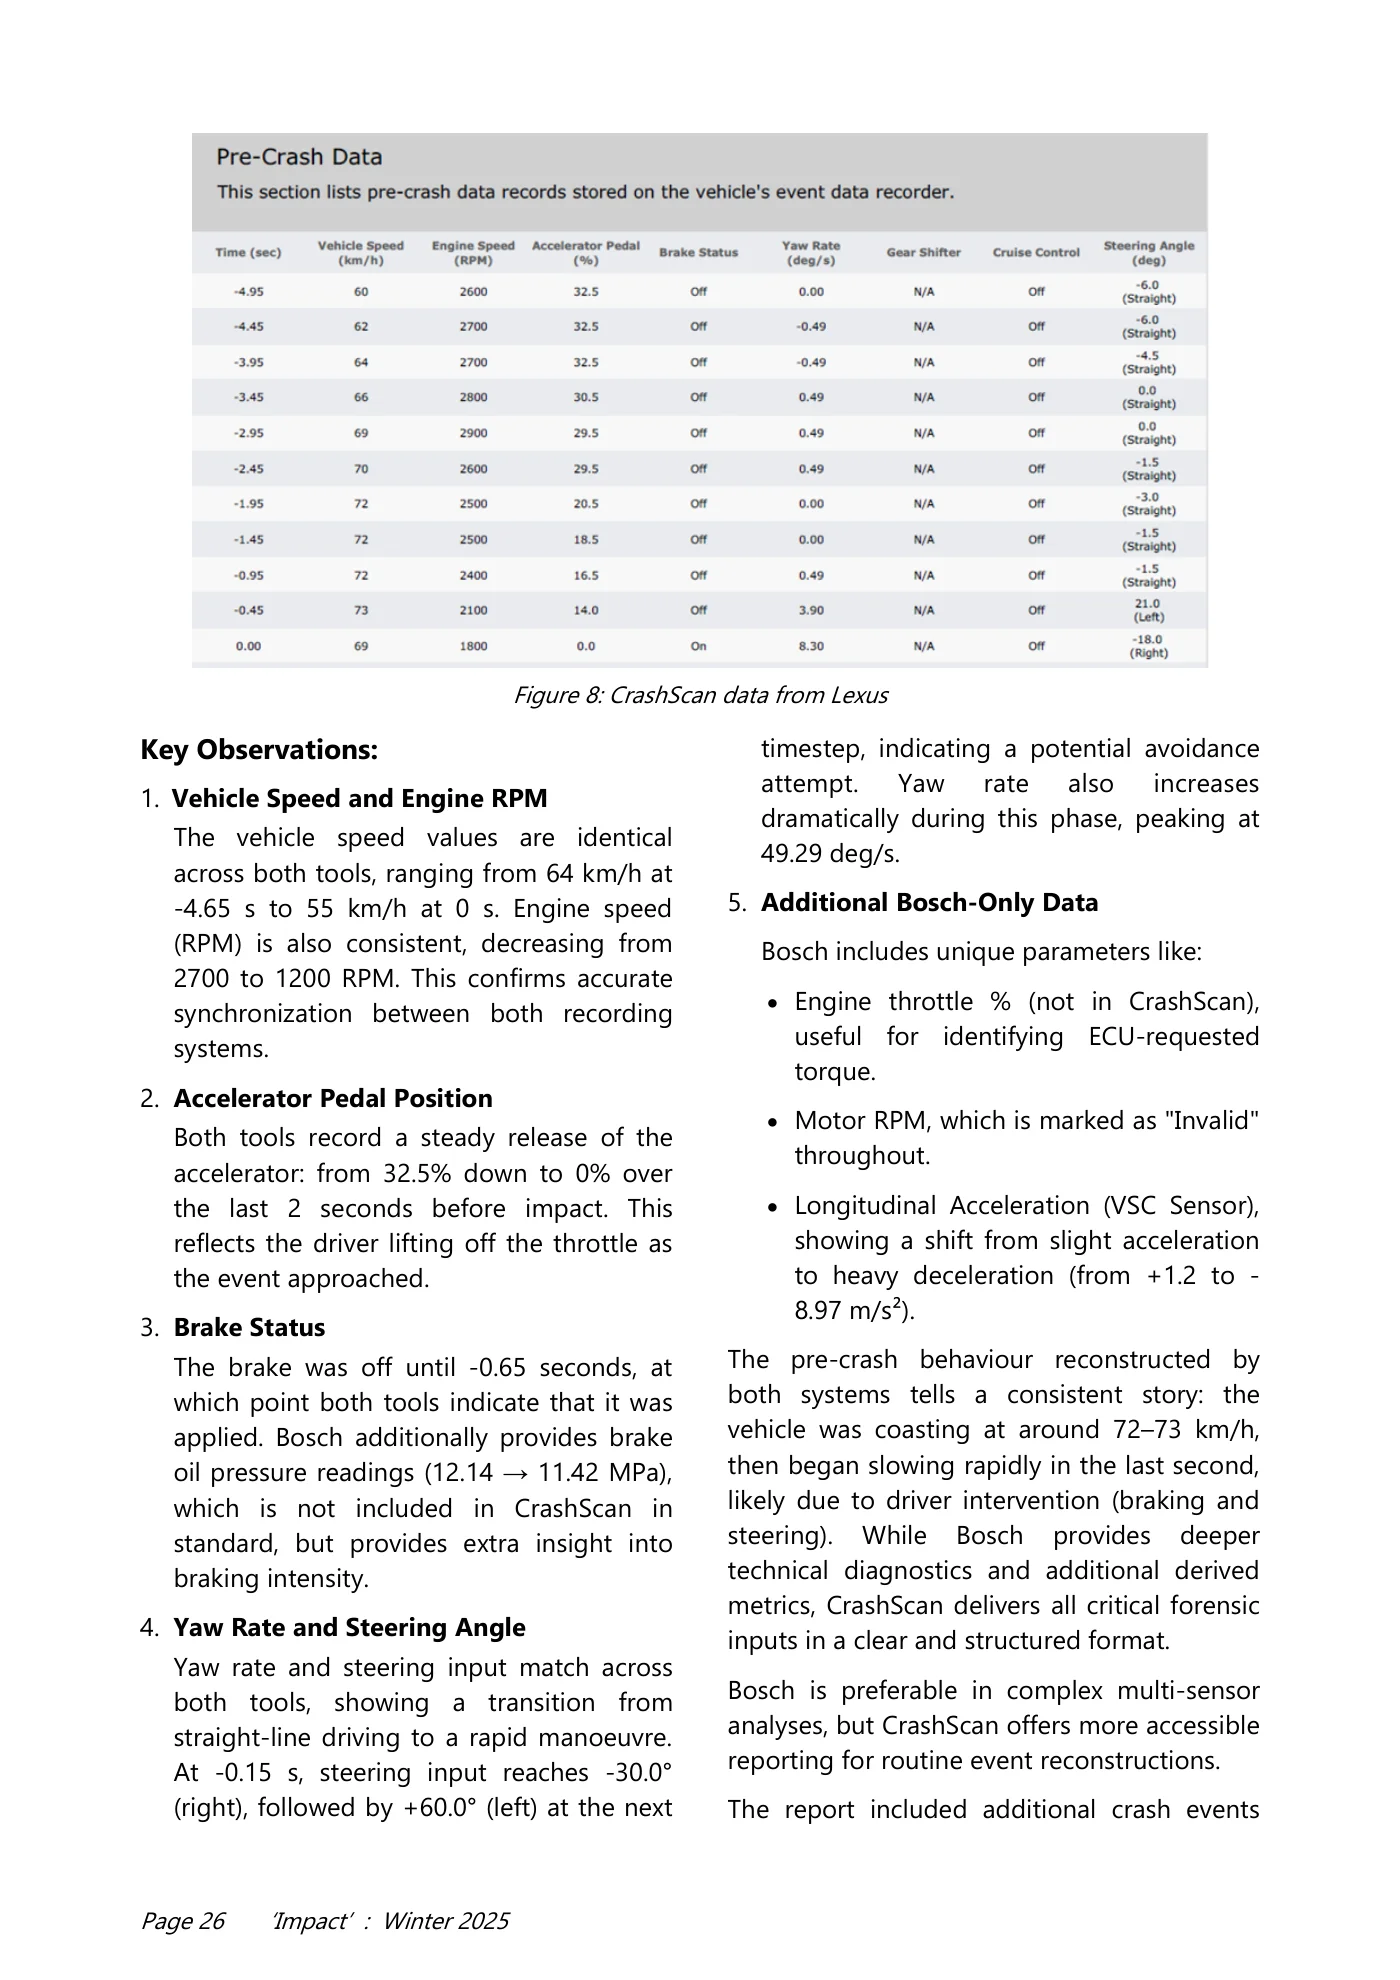
Page 25 ‘Impact’ : Winter 2025 metrics, Bosch’s output is more detailed and suited for regulatory environments, whereas CrashScan emphasizes usability and rapid interpretation in the field. Both Bosch CDR and CrashScan offer comprehensive snapshots of the vehicle’s behaviour during the five seconds leading up to the crash. The recorded parameters – such as vehicle speed, engine RPM, accelerator position, brake status, yaw rate, and steering input - are largely consistent between the two systems, with minor differences in formatting and additional variables provided by Bosch. Figure 6: CrashScan Data from Lexus Figure 7: Bosch CDR data from Lexus
Read page 26 text
Page 26 ‘Impact’ : Winter 2025 Key Observations: 1. Vehicle Speed and Engine RPM The vehicle speed values are identical across both tools, ranging from 64 km/h at -4.65 s to 55 km/h at 0 s. Engine speed (RPM) is also consistent, decreasing from 2700 to 1200 RPM. This confirms accurate synchronization between both recording systems. 2. Accelerator Pedal Position Both tools record a steady release of the accelerator: from 32.5% down to 0% over the last 2 seconds before impact. This reflects the driver lifting off the throttle as the event approached. 3. Brake Status The brake was off until -0.65 seconds, at which point both tools indicate that it was applied. Bosch additionally provides brake oil pressure readings (12.14 → 11.42 MPa), which is not included in CrashScan in standard, but provides extra insight into braking intensity. 4. Yaw Rate and Steering Angle Yaw rate and steering input match across both tools, showing a transition from straight-line driving to a rapid manoeuvre. At -0.15 s, steering input reaches -30.0° (right), followed by +60.0° (left) at the next timestep, indicating a potential avoidance attempt. Yaw rate also increases dramatically during this phase, peaking at 49.29 deg/s. 5. Additional Bosch-Only Data Bosch includes unique parameters like: • Engine throttle % (not in CrashScan), useful for identifying ECU-requested torque. • Motor RPM, which is marked as "Invalid" throughout. • Longitudinal Acceleration (VSC Sensor), showing a shift from slight acceleration to heavy deceleration (from +1.2 to - 8.97 m/s²). The pre-crash behaviour reconstructed by both systems tells a consistent story: the vehicle was coasting at around 72–73 km/h, then began slowing rapidly in the last second, likely due to driver intervention (braking and steering). While Bosch provides deeper technical diagnostics and additional derived metrics, CrashScan delivers all critical forensic inputs in a clear and structured format. Bosch is preferable in complex multi-sensor analyses, but CrashScan offers more accessible reporting for routine event reconstructions. The report included additional crash events Figure 8: CrashScan data from Lexus
Read page 27 text
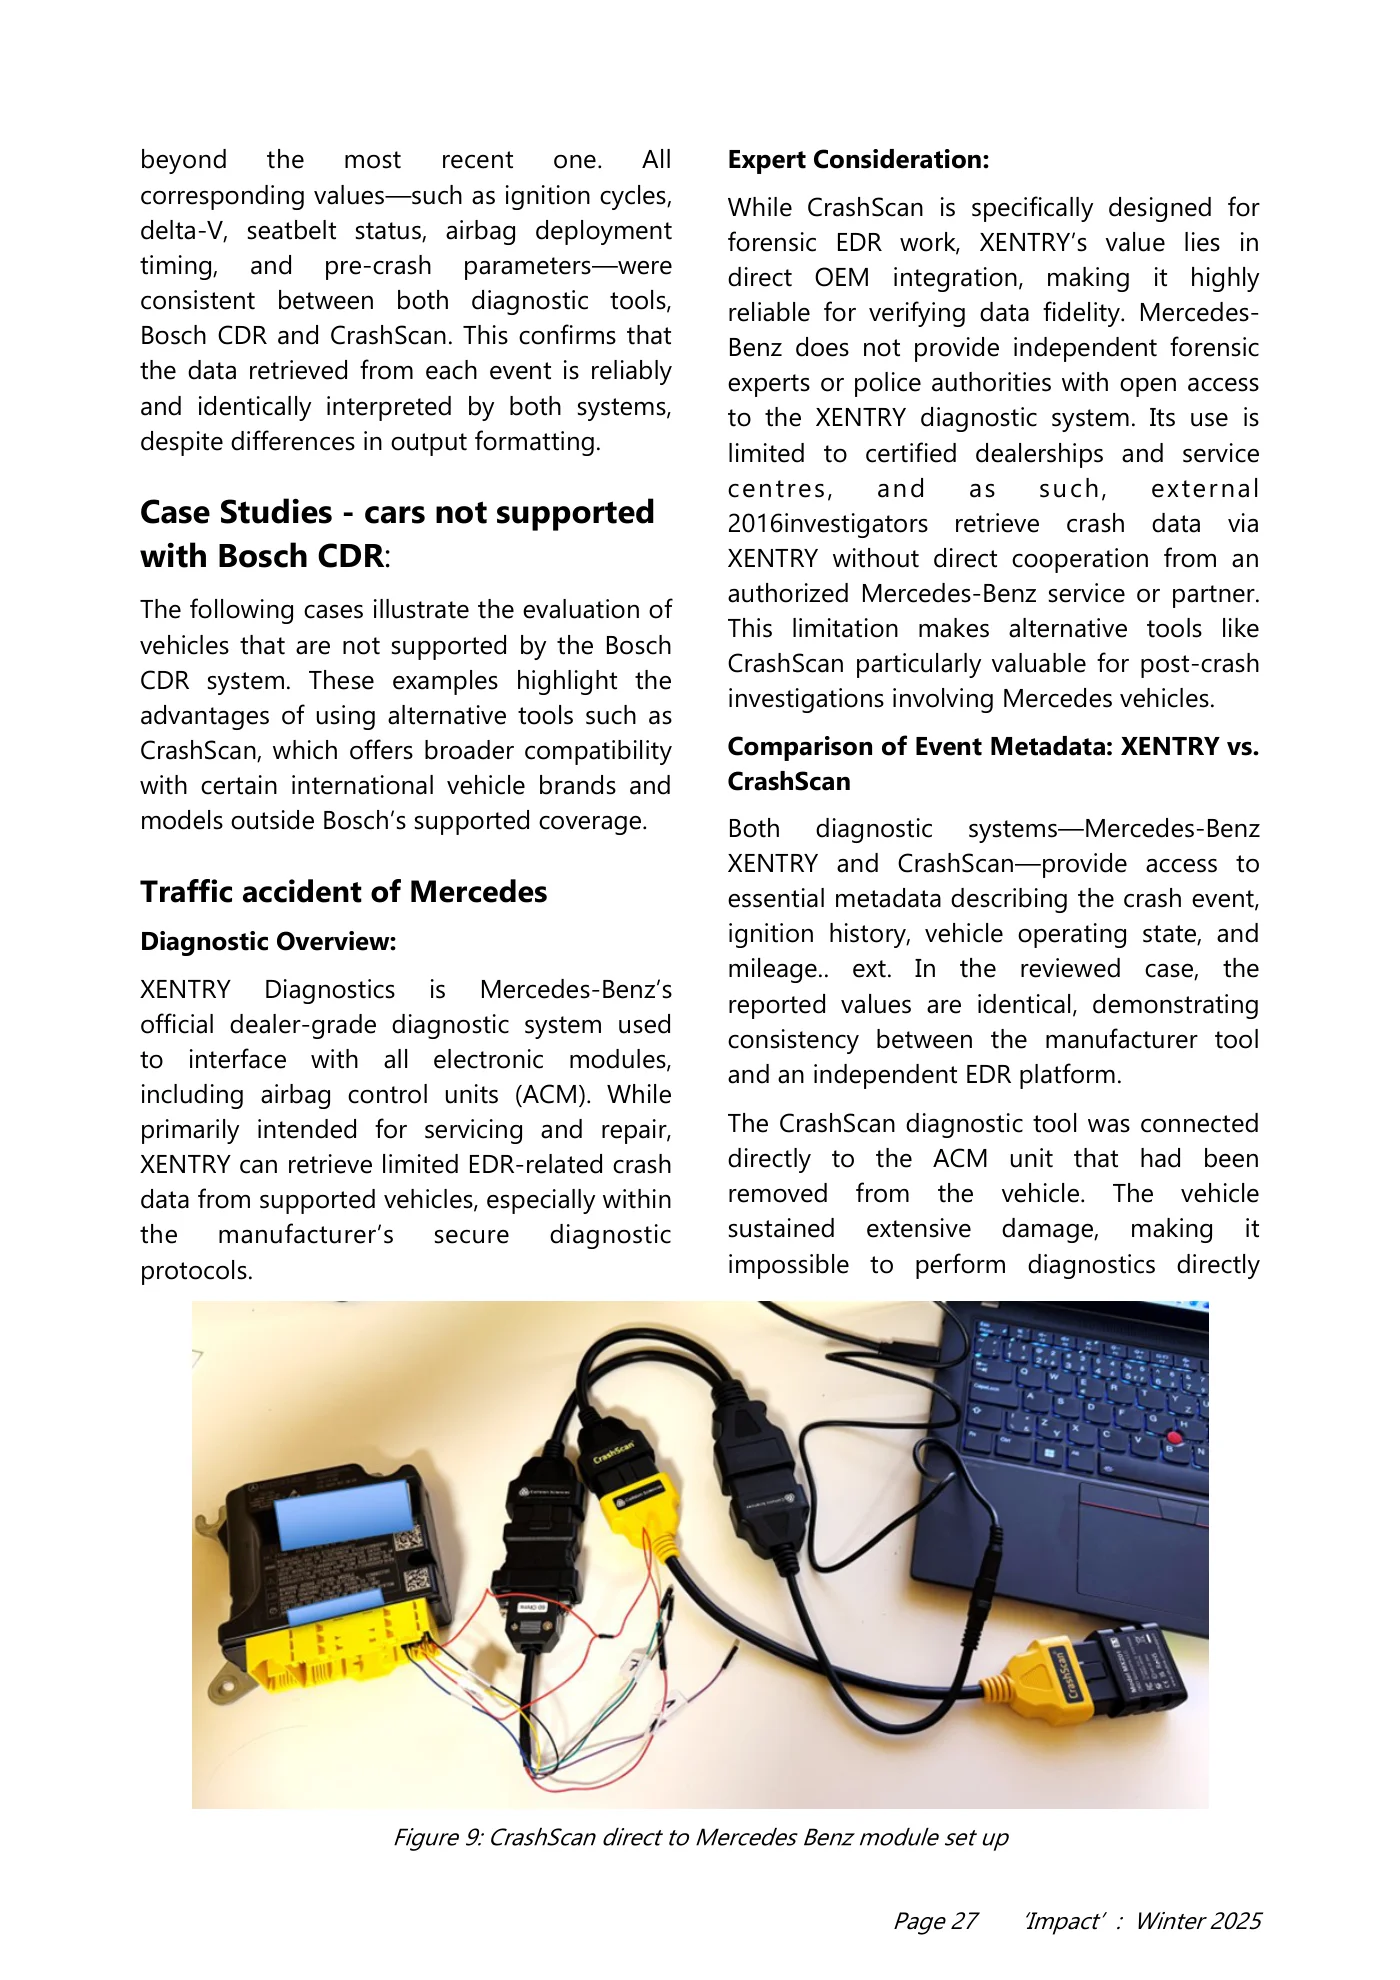
Page 27 ‘Impact’ : Winter 2025 beyond the most recent one. All corresponding values—such as ignition cycles, delta-V, seatbelt status, airbag deployment timing, and pre-crash parameters—were consistent between both diagnostic tools, Bosch CDR and CrashScan. This confirms that the data retrieved from each event is reliably and identically interpreted by both systems, despite differences in output formatting. Case Studies - cars not supported with Bosch CDR: The following cases illustrate the evaluation of vehicles that are not supported by the Bosch CDR system. These examples highlight the advantages of using alternative tools such as CrashScan, which offers broader compatibility with certain international vehicle brands and models outside Bosch’s supported coverage. Traffic accident of Mercedes Diagnostic Overview: XENTRY Diagnostics is Mercedes-Benz’s official dealer-grade diagnostic system used to interface with all electronic modules, including airbag control units (ACM). While primarily intended for servicing and repair, XENTRY can retrieve limited EDR-related crash data from supported vehicles, especially within the manufacturer’s secure diagnostic protocols. Expert Consideration: While CrashScan is specifically designed for forensic EDR work, XENTRY’s value lies in direct OEM integration, making it highly reliable for verifying data fidelity. Mercedes- Benz does not provide independent forensic experts or police authorities with open access to the XENTRY diagnostic system. Its use is limited to certified dealerships and service centres, and as such, external 2016investigators retrieve crash data via XENTRY without direct cooperation from an authorized Mercedes-Benz service or partner. This limitation makes alternative tools like CrashScan particularly valuable for post-crash investigations involving Mercedes vehicles. Comparison of Event Metadata: XENTRY vs. CrashScan Both diagnostic systems—Mercedes-Benz XENTRY and CrashScan—provide access to essential metadata describing the crash event, ignition history, vehicle operating state, and mileage.. ext. In the reviewed case, the reported values are identical, demonstrating consistency between the manufacturer tool and an independent EDR platform. The CrashScan diagnostic tool was connected directly to the ACM unit that had been removed from the vehicle. The vehicle sustained extensive damage, making it impossible to perform diagnostics directly Figure 9: CrashScan direct to Mercedes Benz module set up
Read page 28 text
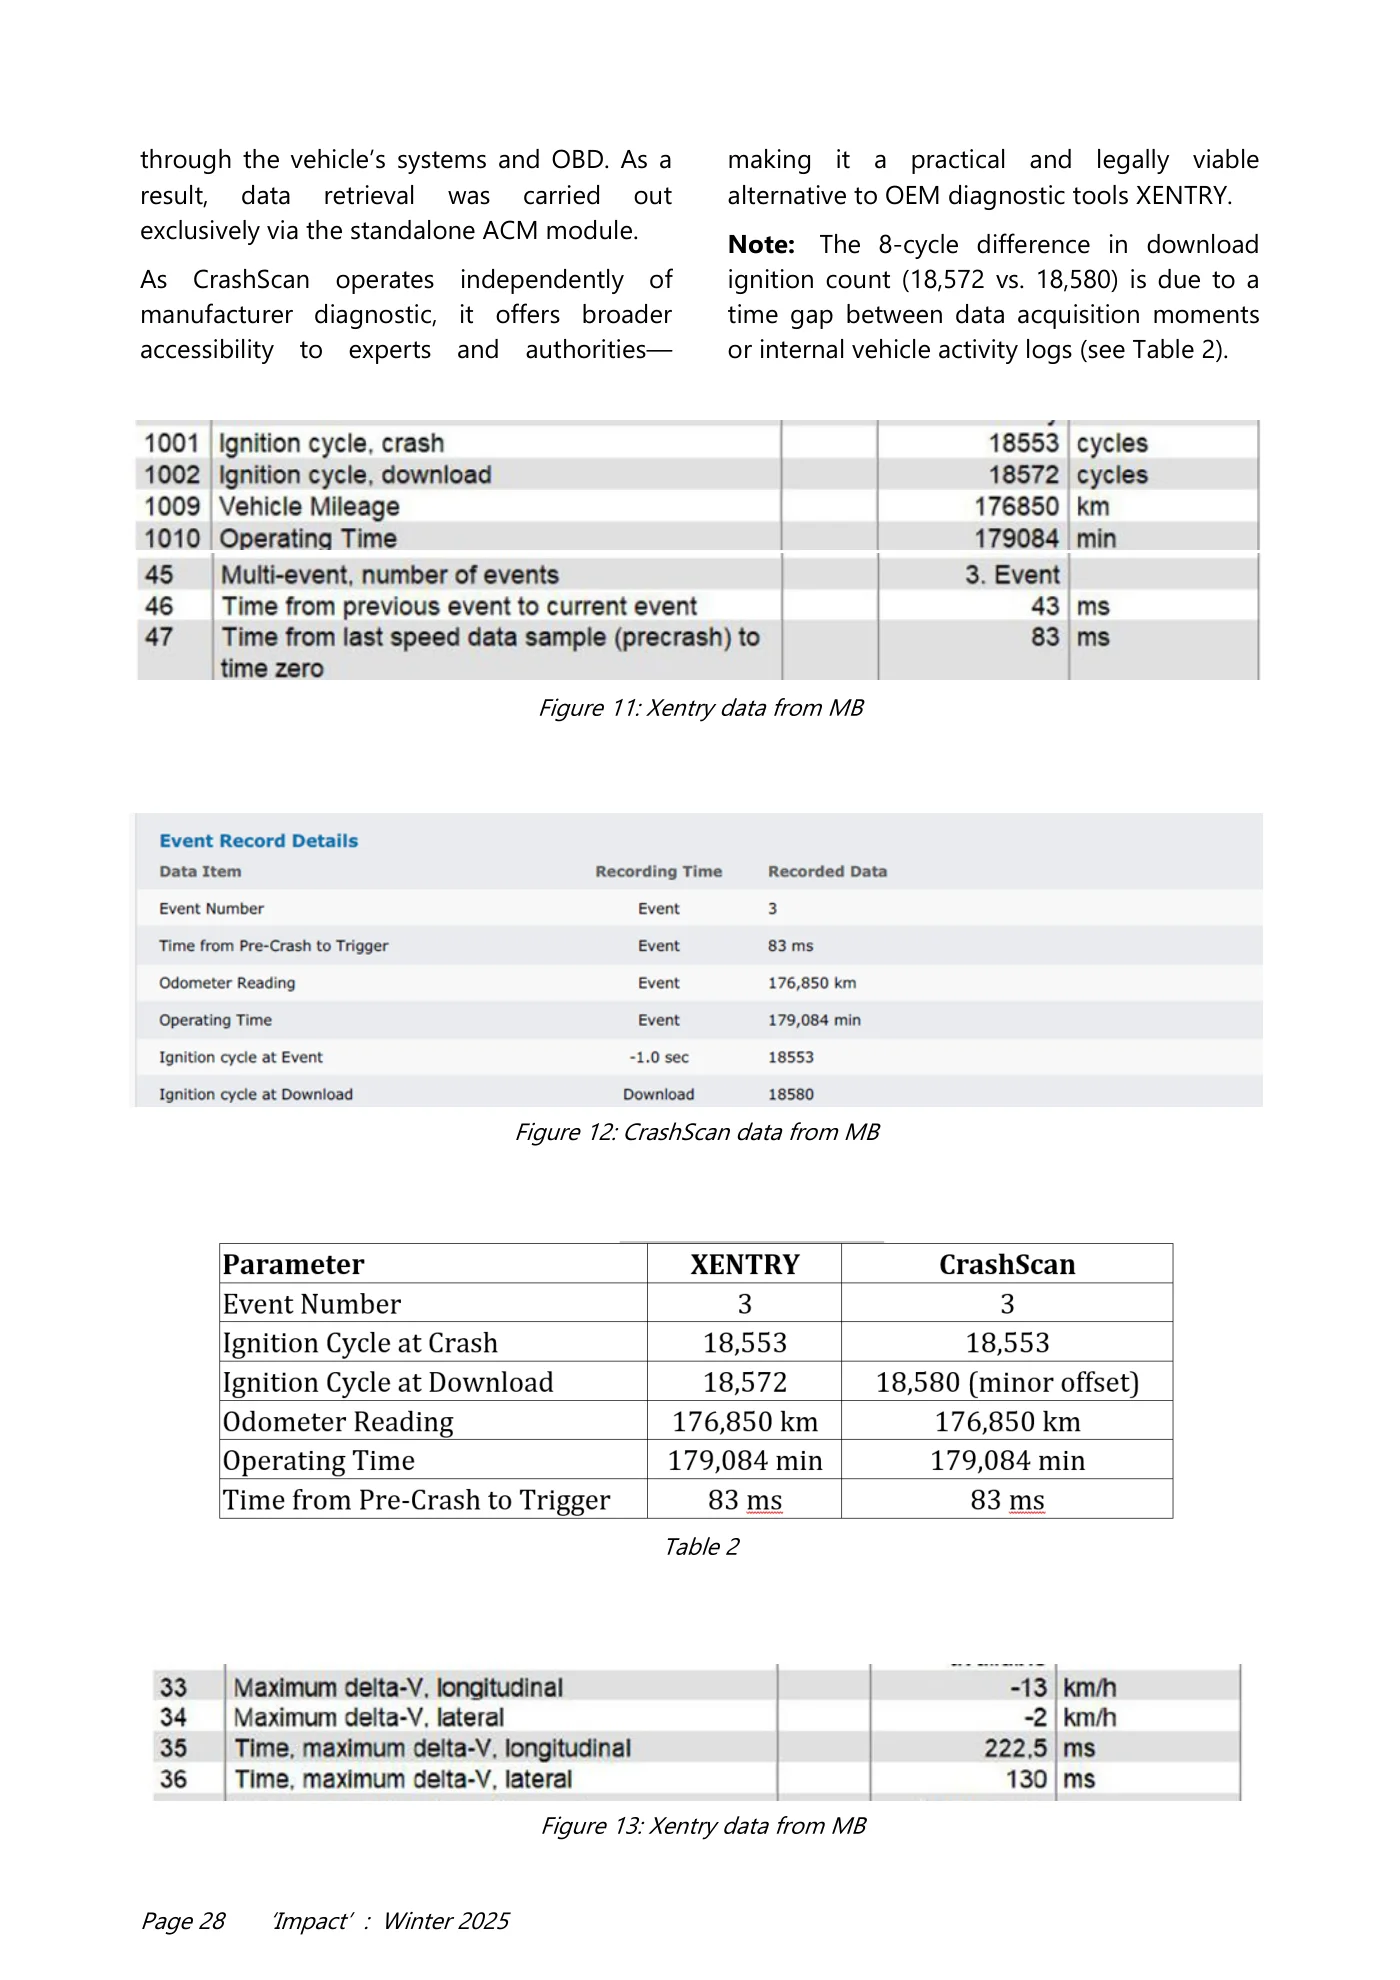
Page 28 ‘Impact’ : Winter 2025 through the vehicle’s systems and OBD. As a result, data retrieval was carried out exclusively via the standalone ACM module. As CrashScan operates independently of manufacturer diagnostic, it offers broader accessibility to experts and authorities— making it a practical and legally viable alternative to OEM diagnostic tools XENTRY. Note: The 8-cycle difference in download ignition count (18,572 vs. 18,580) is due to a time gap between data acquisition moments or internal vehicle activity logs (see Table 2). Figure 11: Xentry data from MB Figure 12: CrashScan data from MB Figure 13: Xentry data from MB Table 2
Read page 29 text
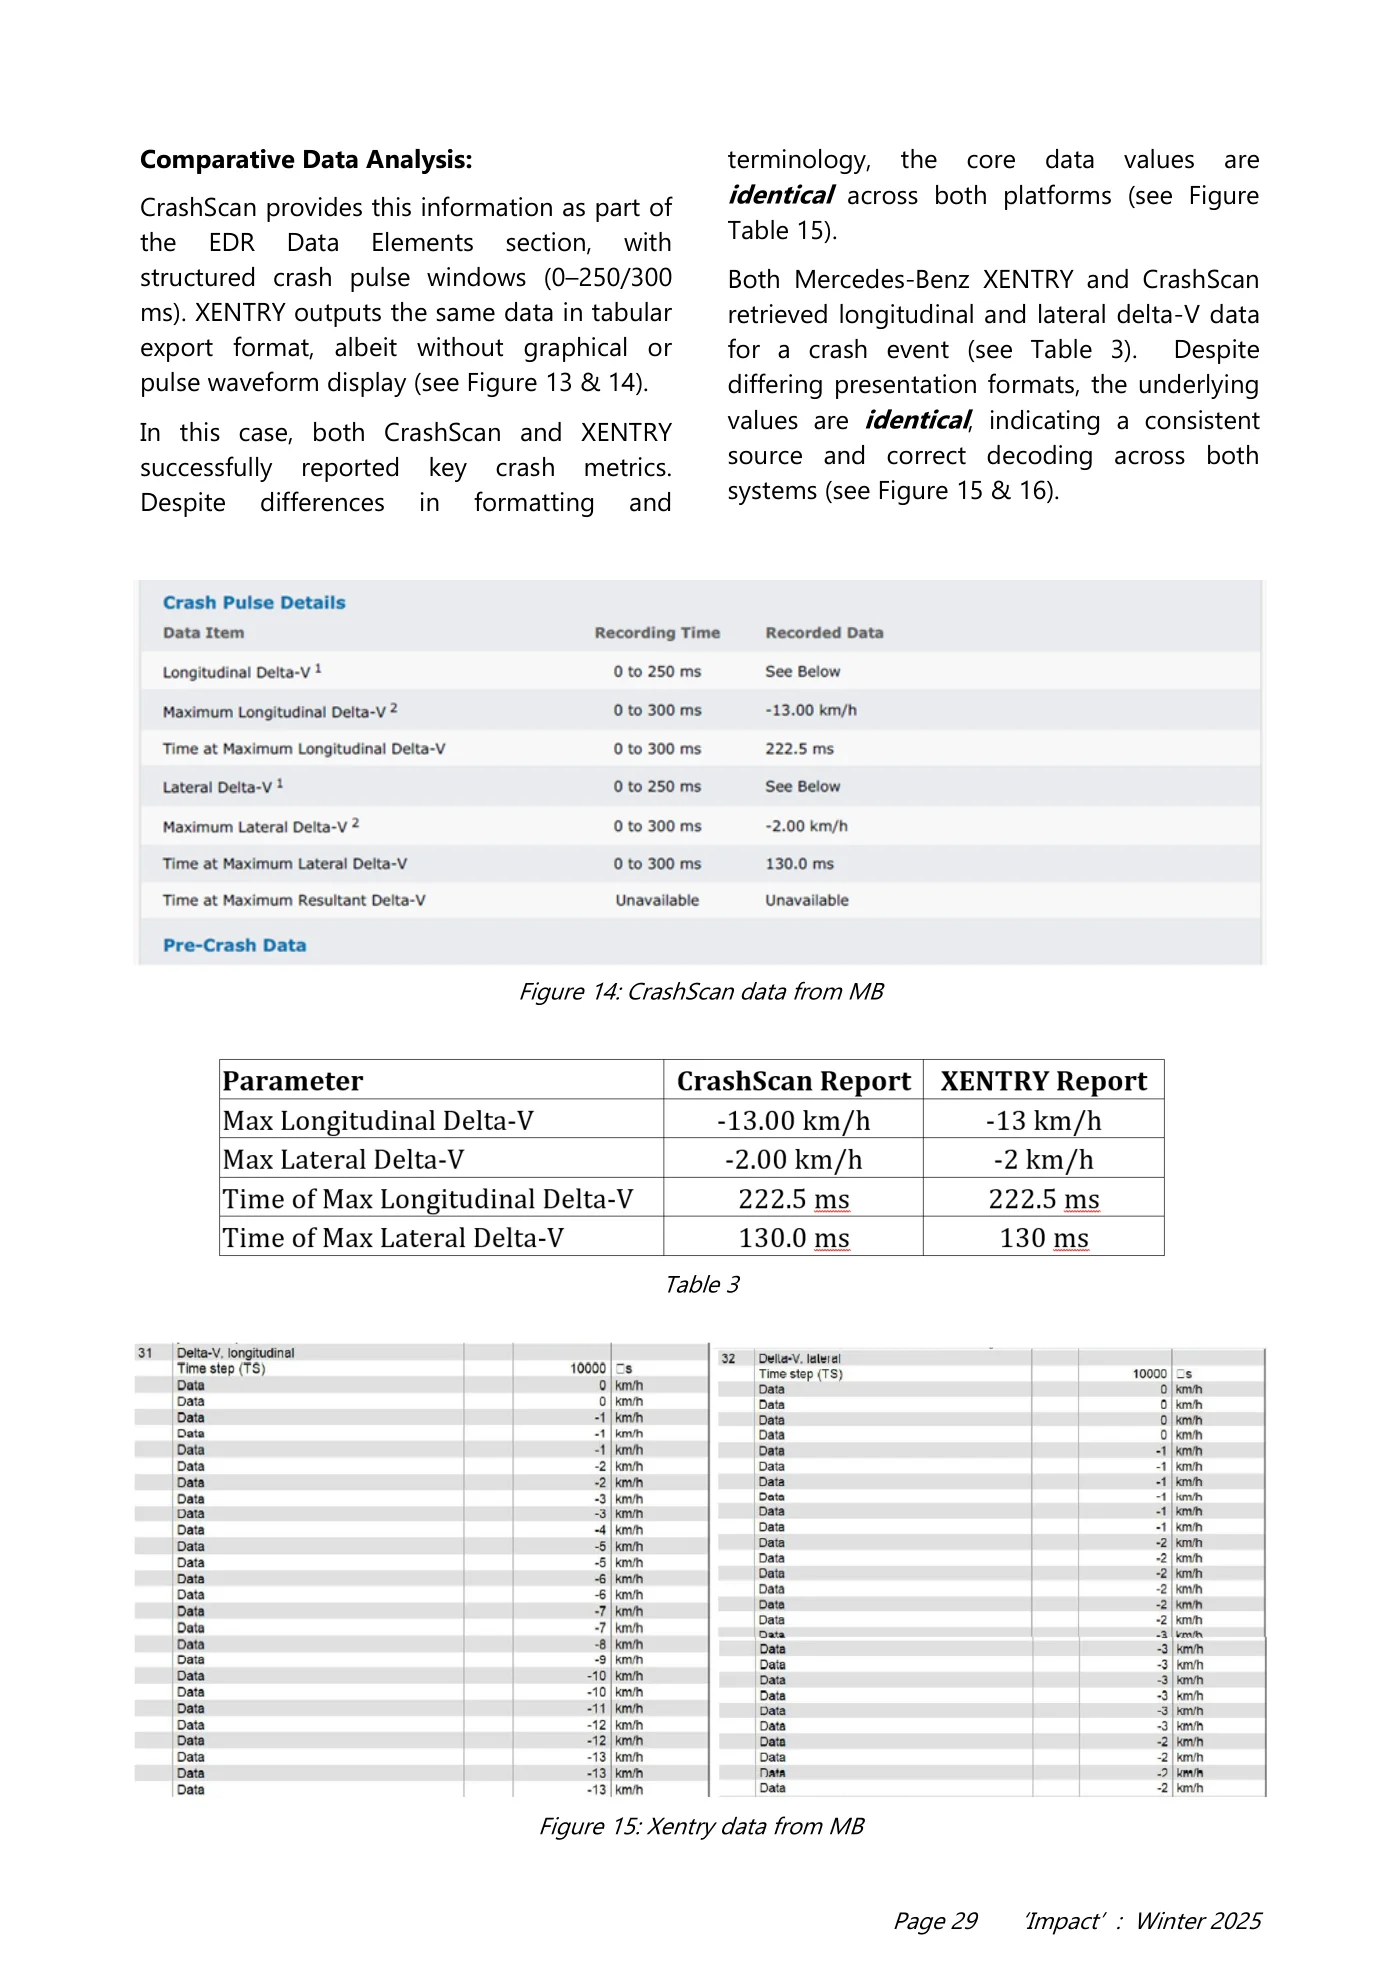
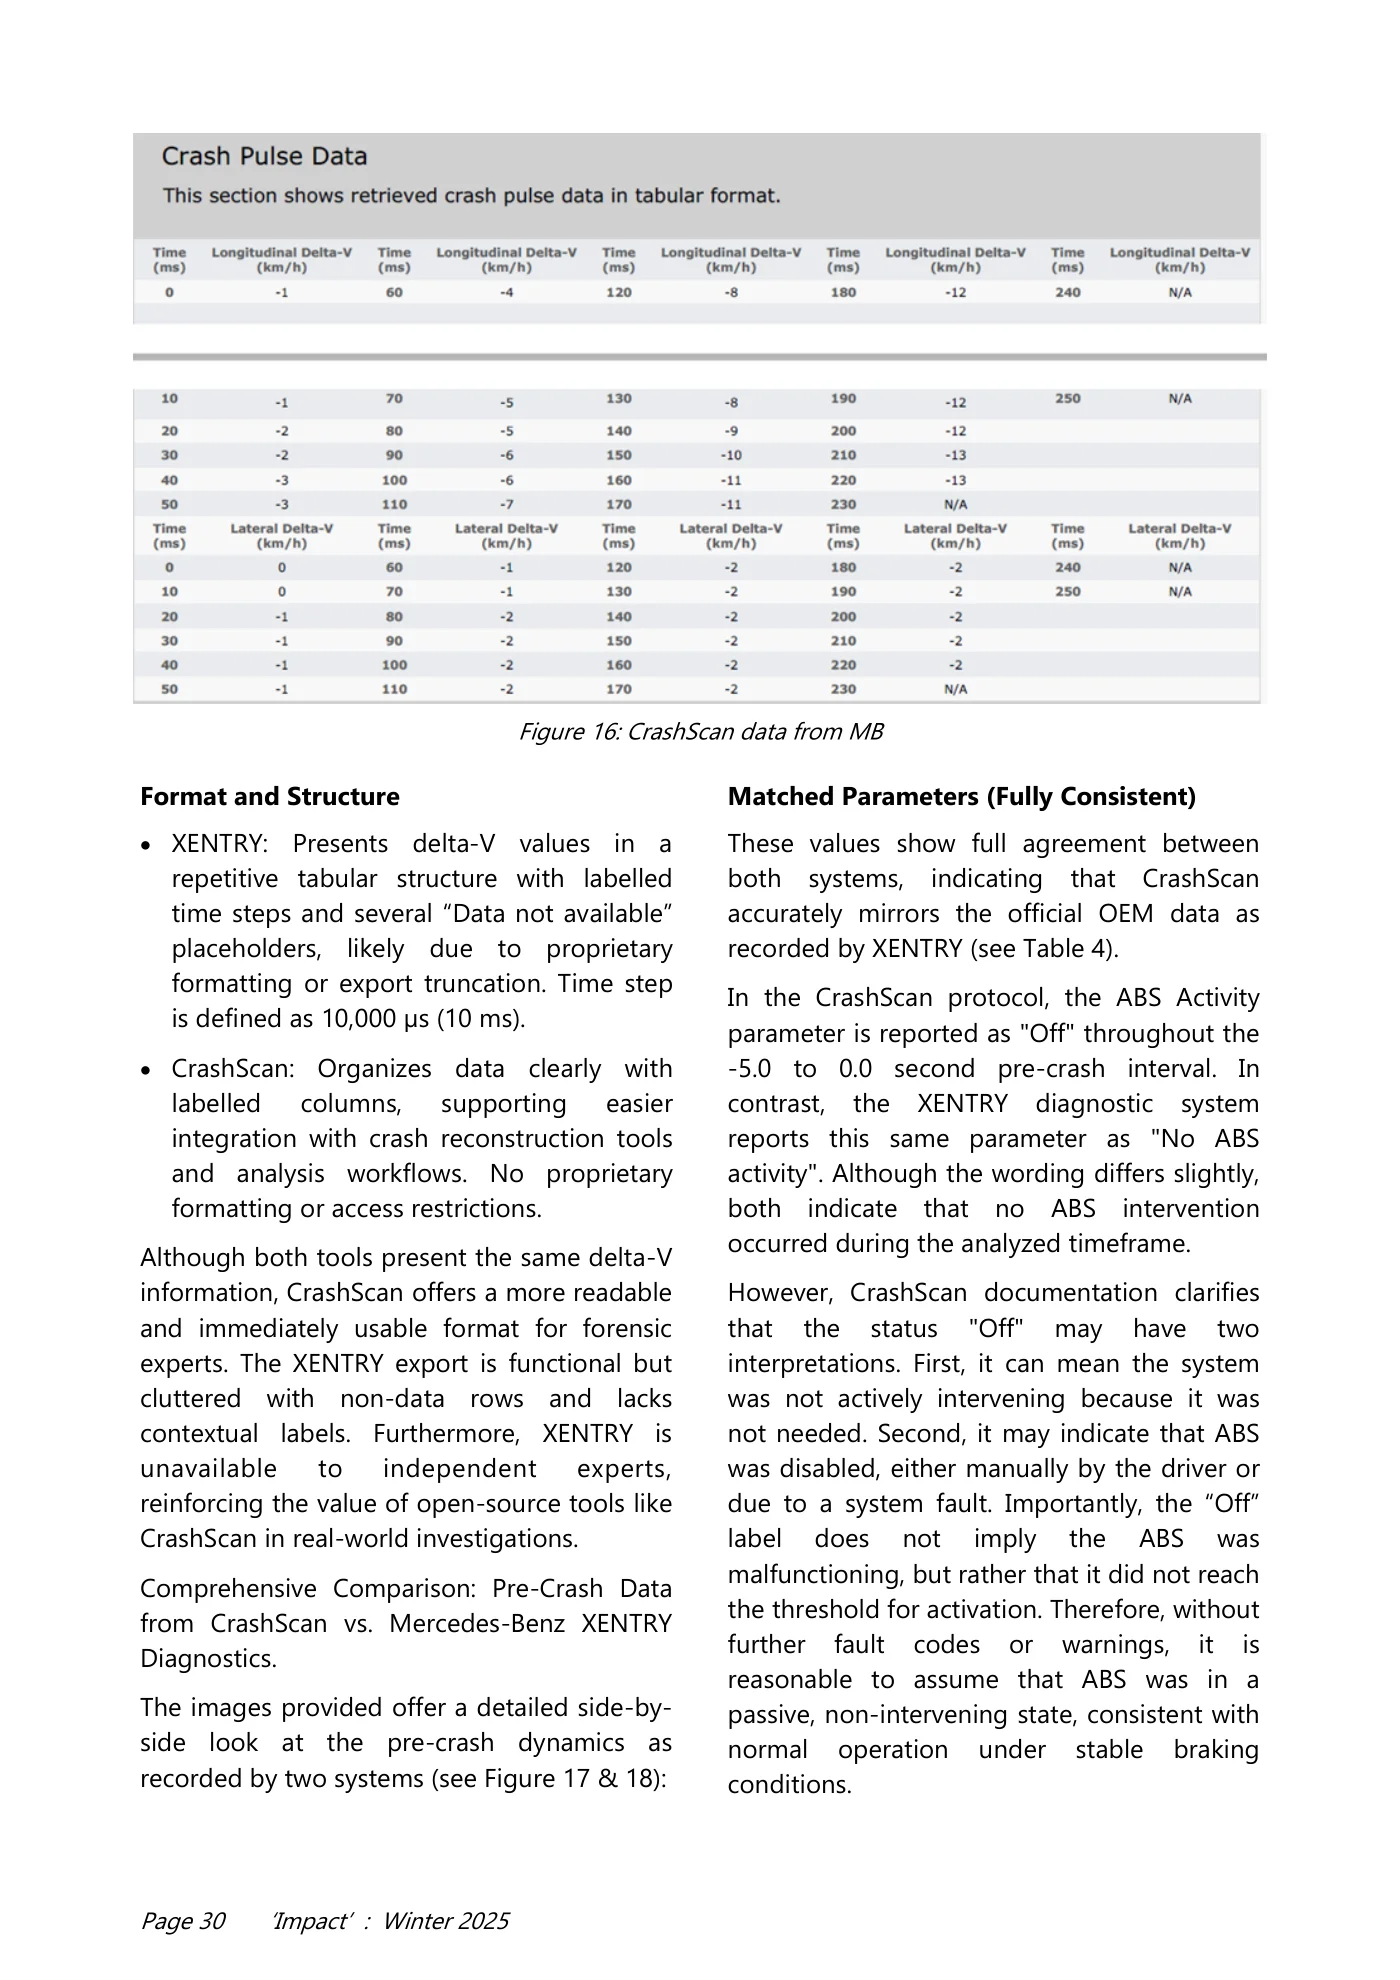
Page 29 ‘Impact’ : Winter 2025 Comparative Data Analysis: CrashScan provides this information as part of the EDR Data Elements section, with structured crash pulse windows (0–250/300 ms). XENTRY outputs the same data in tabular export format, albeit without graphical or pulse waveform display (see Figure 13 & 14). In this case, both CrashScan and XENTRY successfully reported key crash metrics. Despite differences in formatting and terminology, the core data values are identical across both platforms (see Figure Table 15). Both Mercedes-Benz XENTRY and CrashScan retrieved longitudinal and lateral delta-V data for a crash event (see Table 3). Despite differing presentation formats, the underlying values are identical, indicating a consistent source and correct decoding across both systems (see Figure 15 & 16). Figure 14: CrashScan data from MB Table 3 Figure 15: Xentry data from MB
Read page 30 text
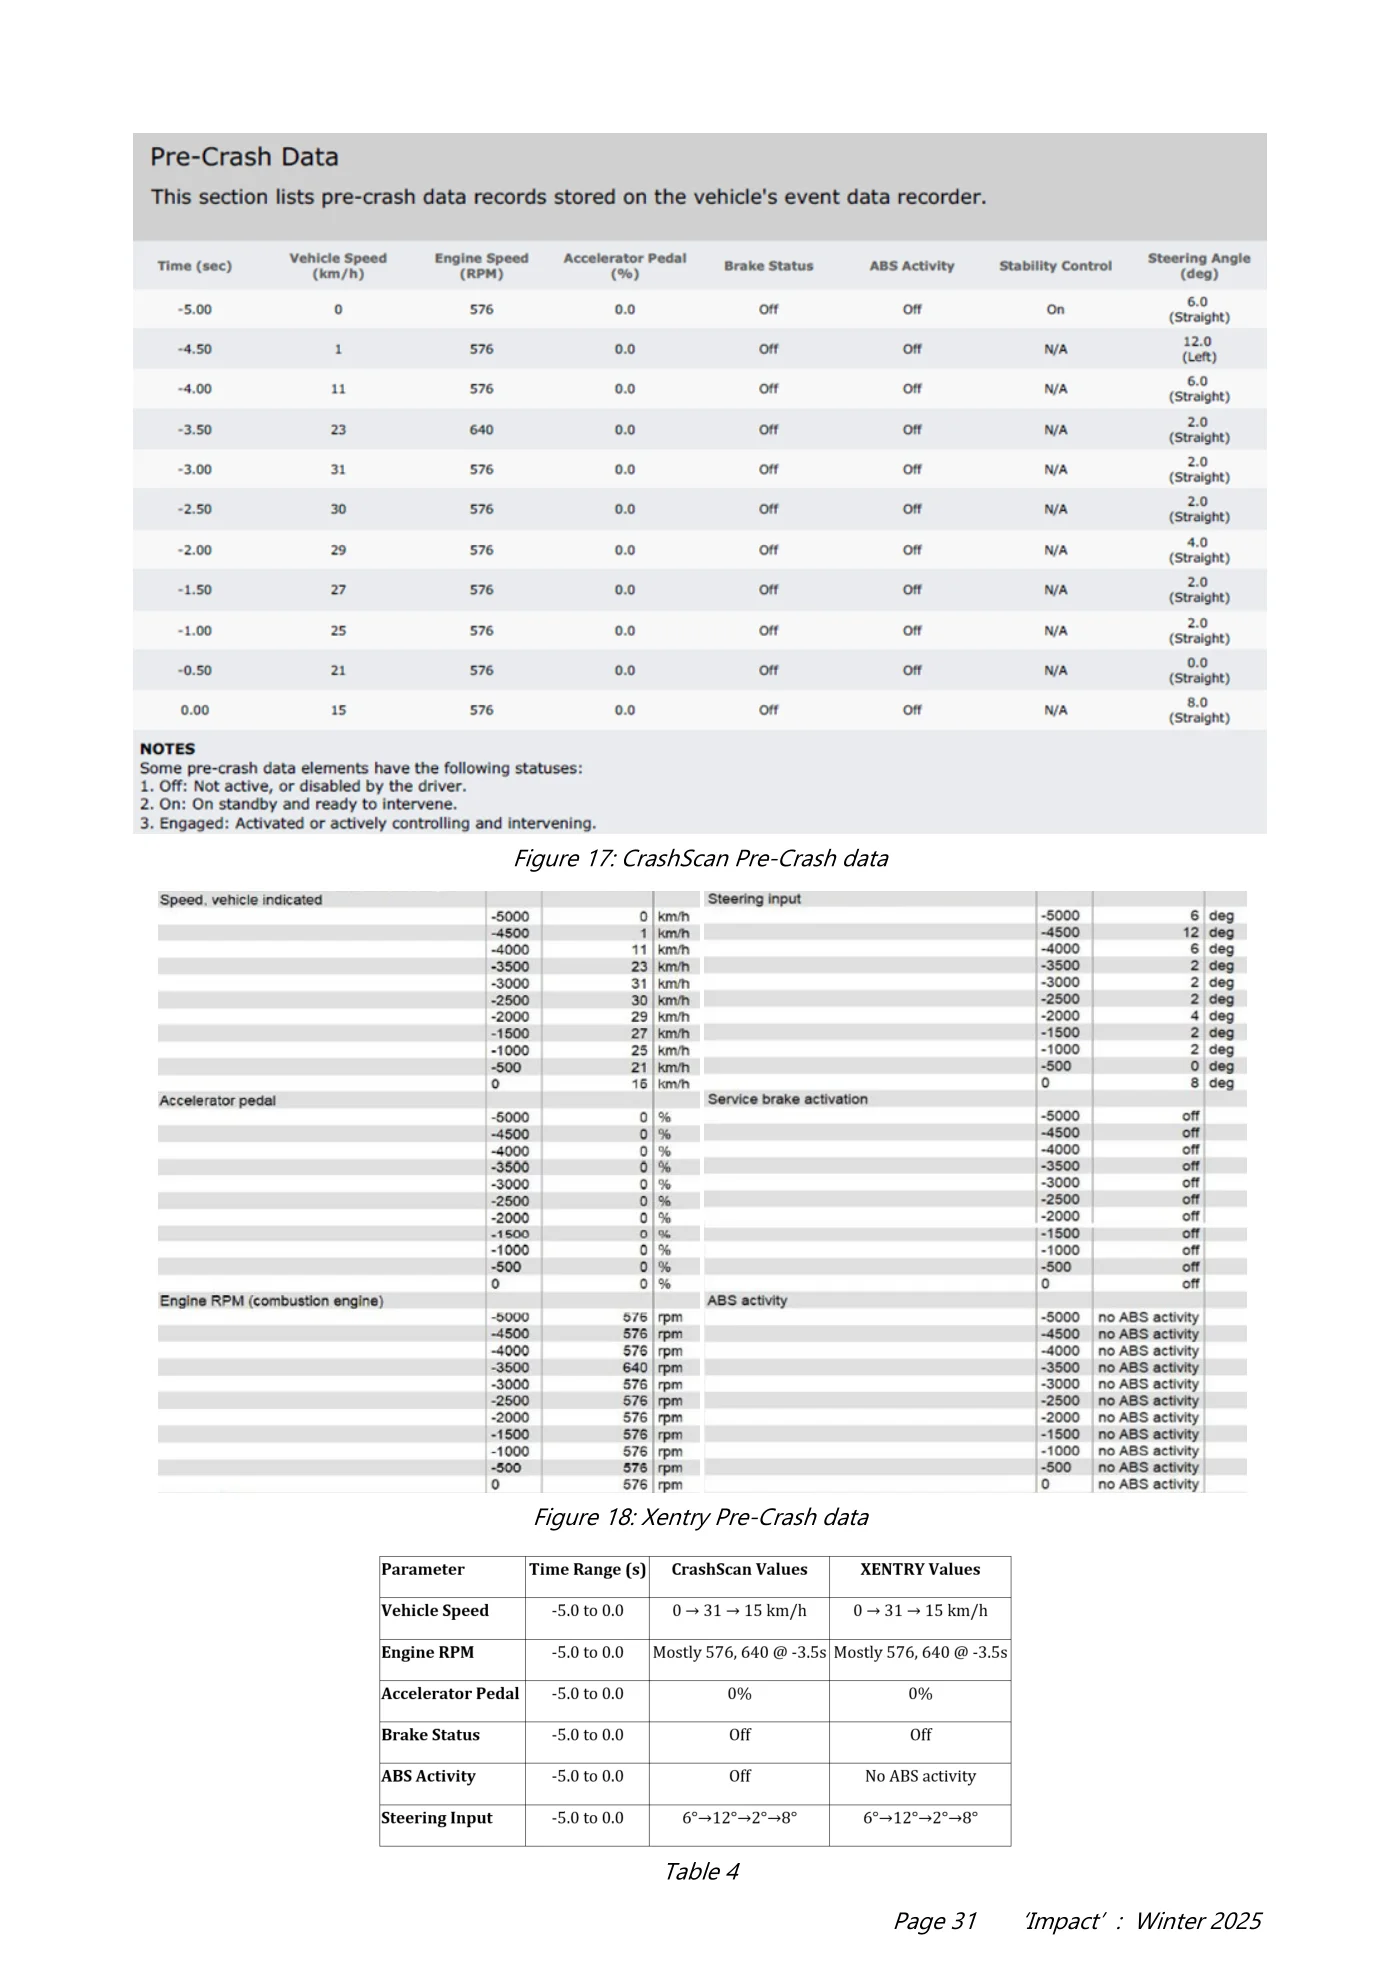
Page 30 ‘Impact’ : Winter 2025 Format and Structure • XENTRY: Presents delta-V values in a repetitive tabular structure with labelled time steps and several “Data not available” placeholders, likely due to proprietary formatting or export truncation. Time step is defined as 10,000 µs (10 ms). • CrashScan: Organizes data clearly with labelled columns, supporting easier integration with crash reconstruction tools and analysis workflows. No proprietary formatting or access restrictions. Although both tools present the same delta-V information, CrashScan offers a more readable and immediately usable format for forensic experts. The XENTRY export is functional but cluttered with non-data rows and lacks contextual labels. Furthermore, XENTRY is unavailable to independent experts, reinforcing the value of open-source tools like CrashScan in real-world investigations. Comprehensive Comparison: Pre-Crash Data from CrashScan vs. Mercedes-Benz XENTRY Diagnostics. The images provided offer a detailed side-by- side look at the pre-crash dynamics as recorded by two systems (see Figure 17 & 18): Matched Parameters (Fully Consistent) These values show full agreement between both systems, indicating that CrashScan accurately mirrors the official OEM data as recorded by XENTRY (see Table 4). In the CrashScan protocol, the ABS Activity parameter is reported as "Off" throughout the -5.0 to 0.0 second pre-crash interval. In contrast, the XENTRY diagnostic system reports this same parameter as "No ABS activity". Although the wording differs slightly, both indicate that no ABS intervention occurred during the analyzed timeframe. However, CrashScan documentation clarifies that the status "Off" may have two interpretations. First, it can mean the system was not actively intervening because it was not needed. Second, it may indicate that ABS was disabled, either manually by the driver or due to a system fault. Importantly, the “Off” label does not imply the ABS was malfunctioning, but rather that it did not reach the threshold for activation. Therefore, without further fault codes or warnings, it is reasonable to assume that ABS was in a passive, non-intervening state, consistent with normal operation under stable braking conditions. Figure 16: CrashScan data from MB
Read page 31 text
Page 31 ‘Impact’ : Winter 2025 Figure 17: CrashScan Pre-Crash data Figure 18: Xentry Pre-Crash data Table 4
Read page 32 text
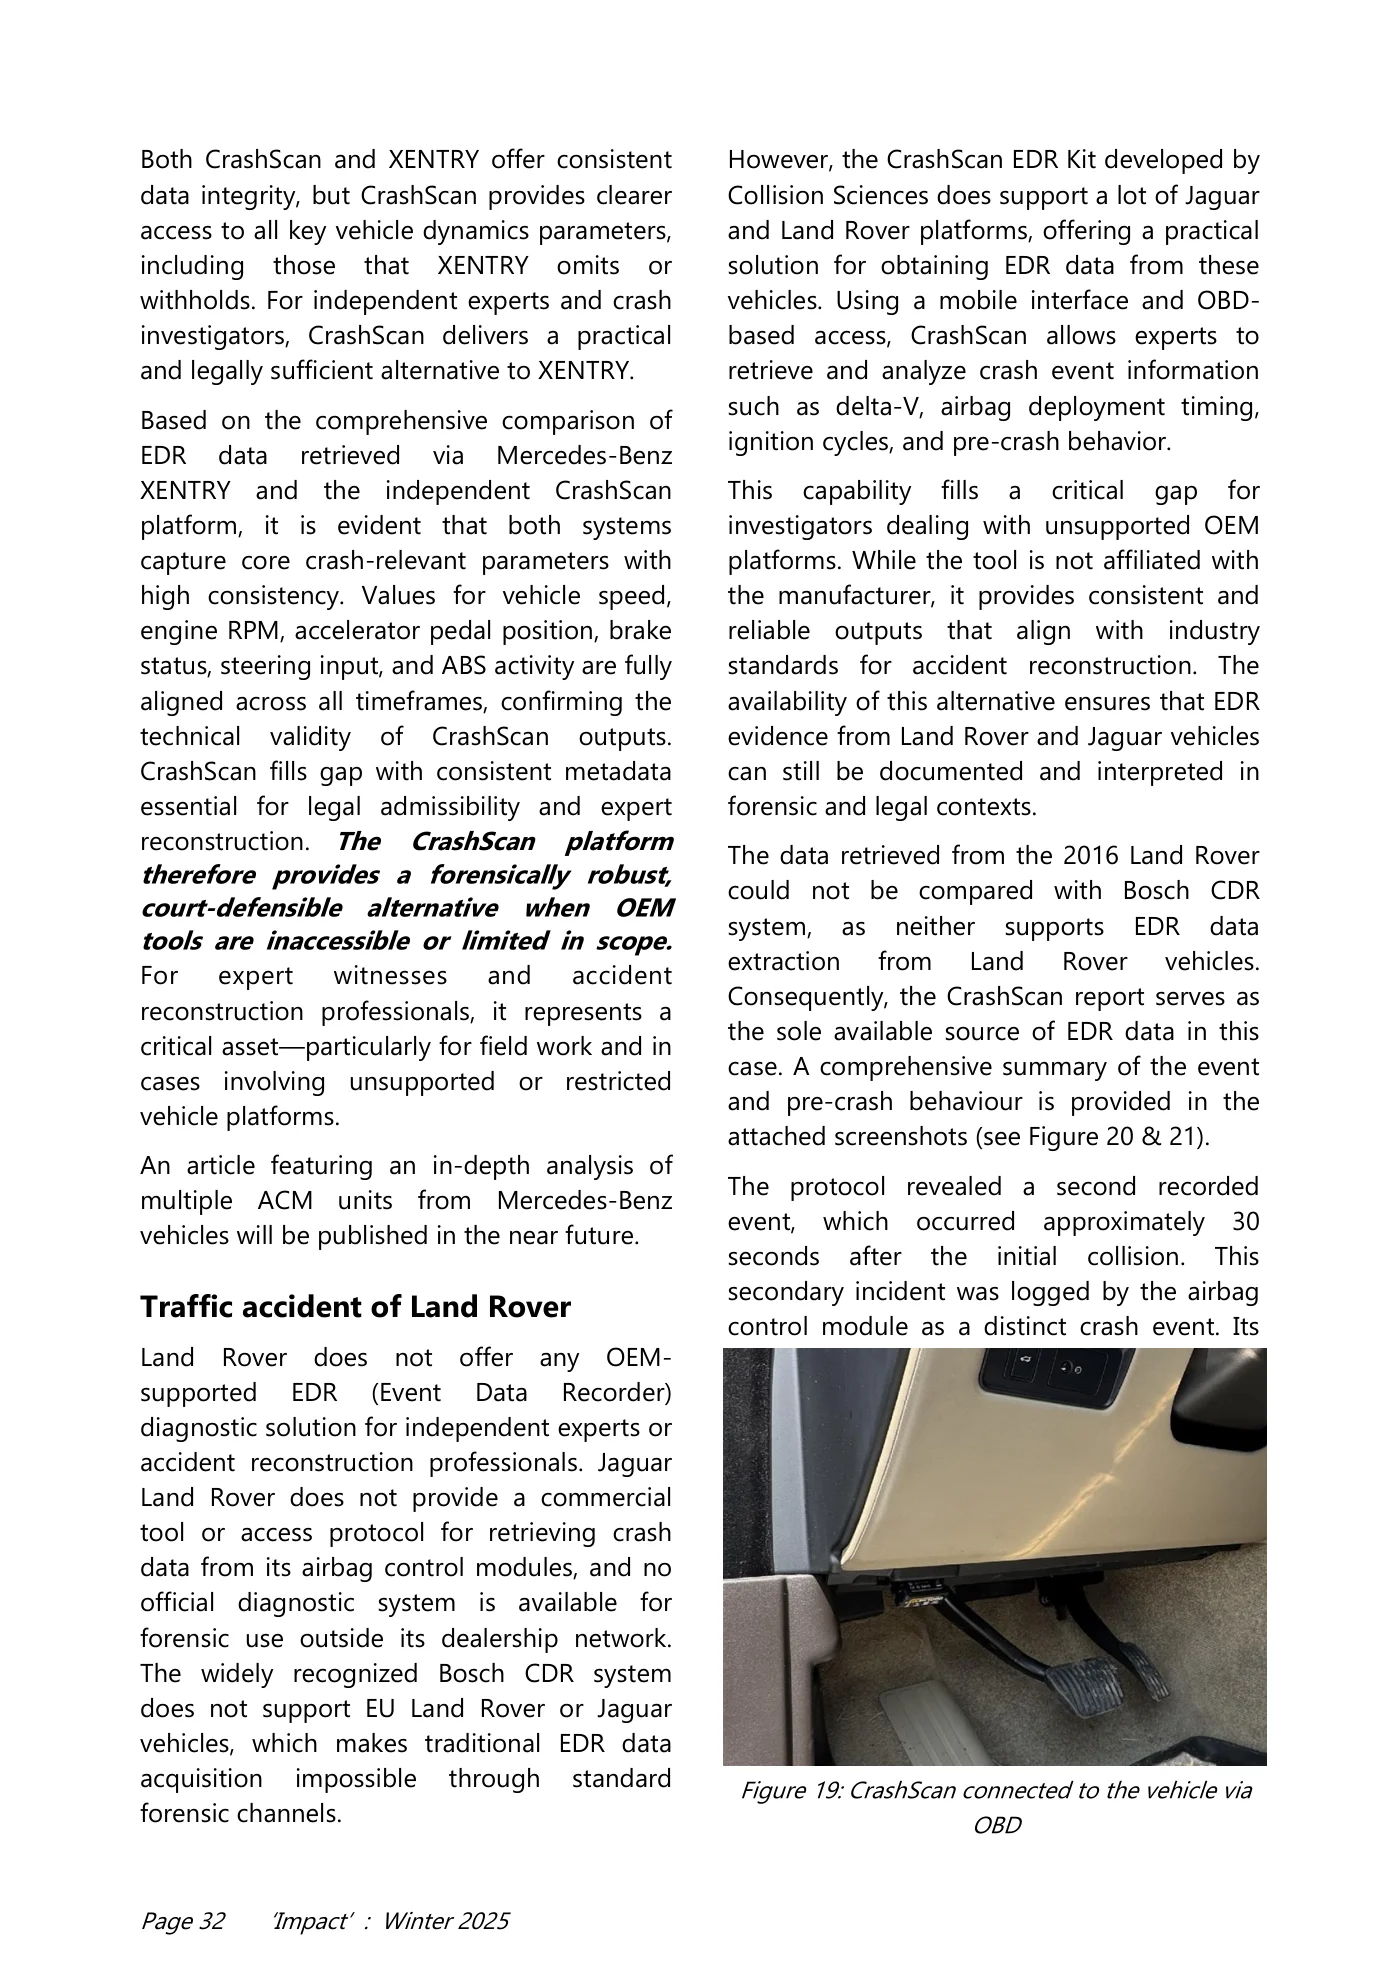
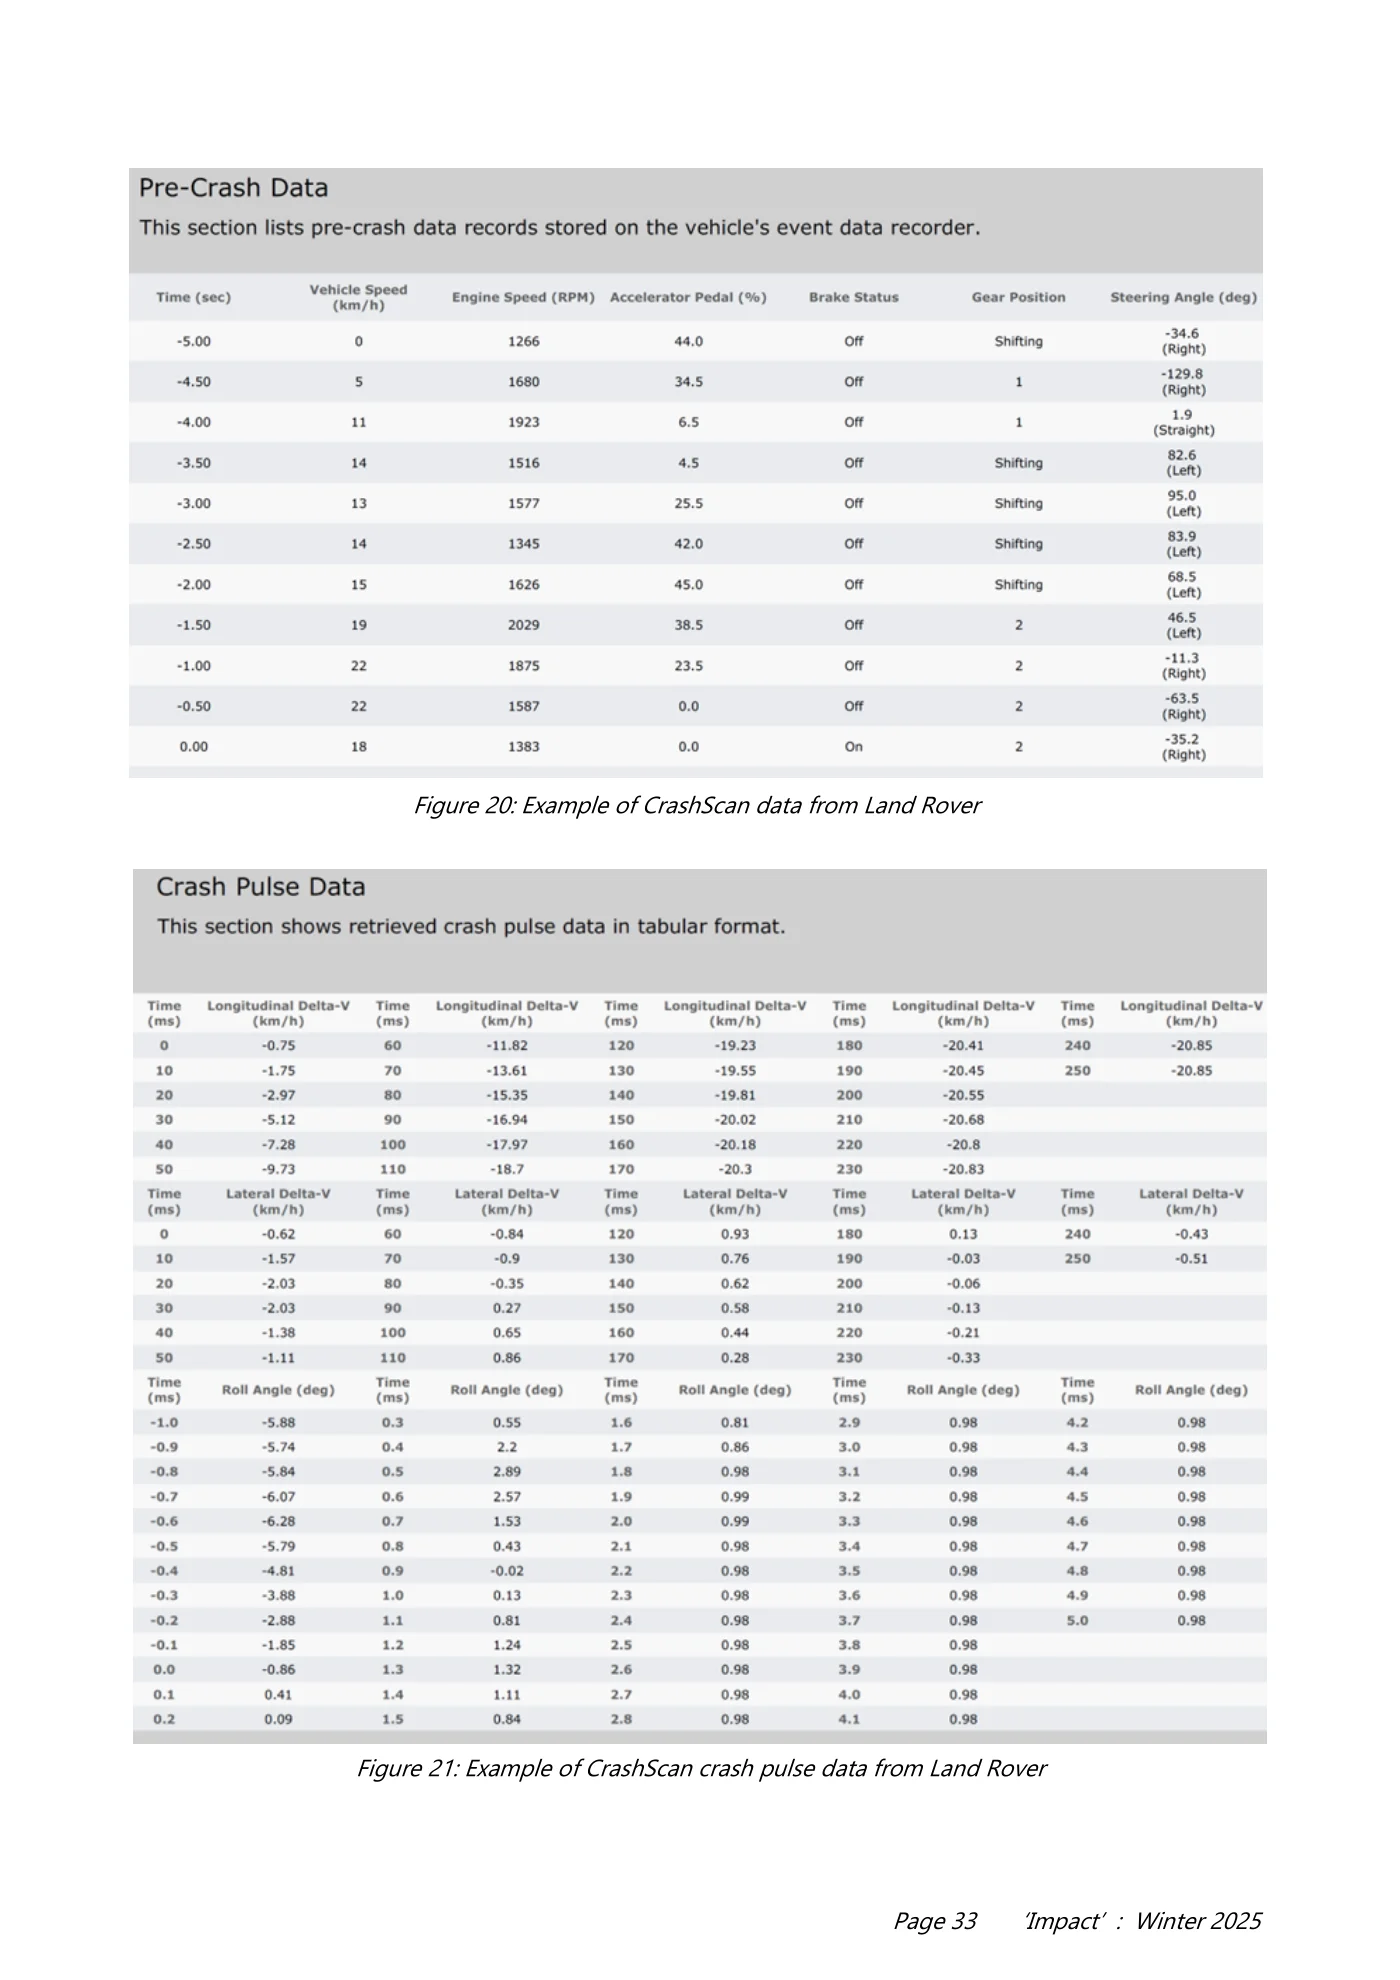
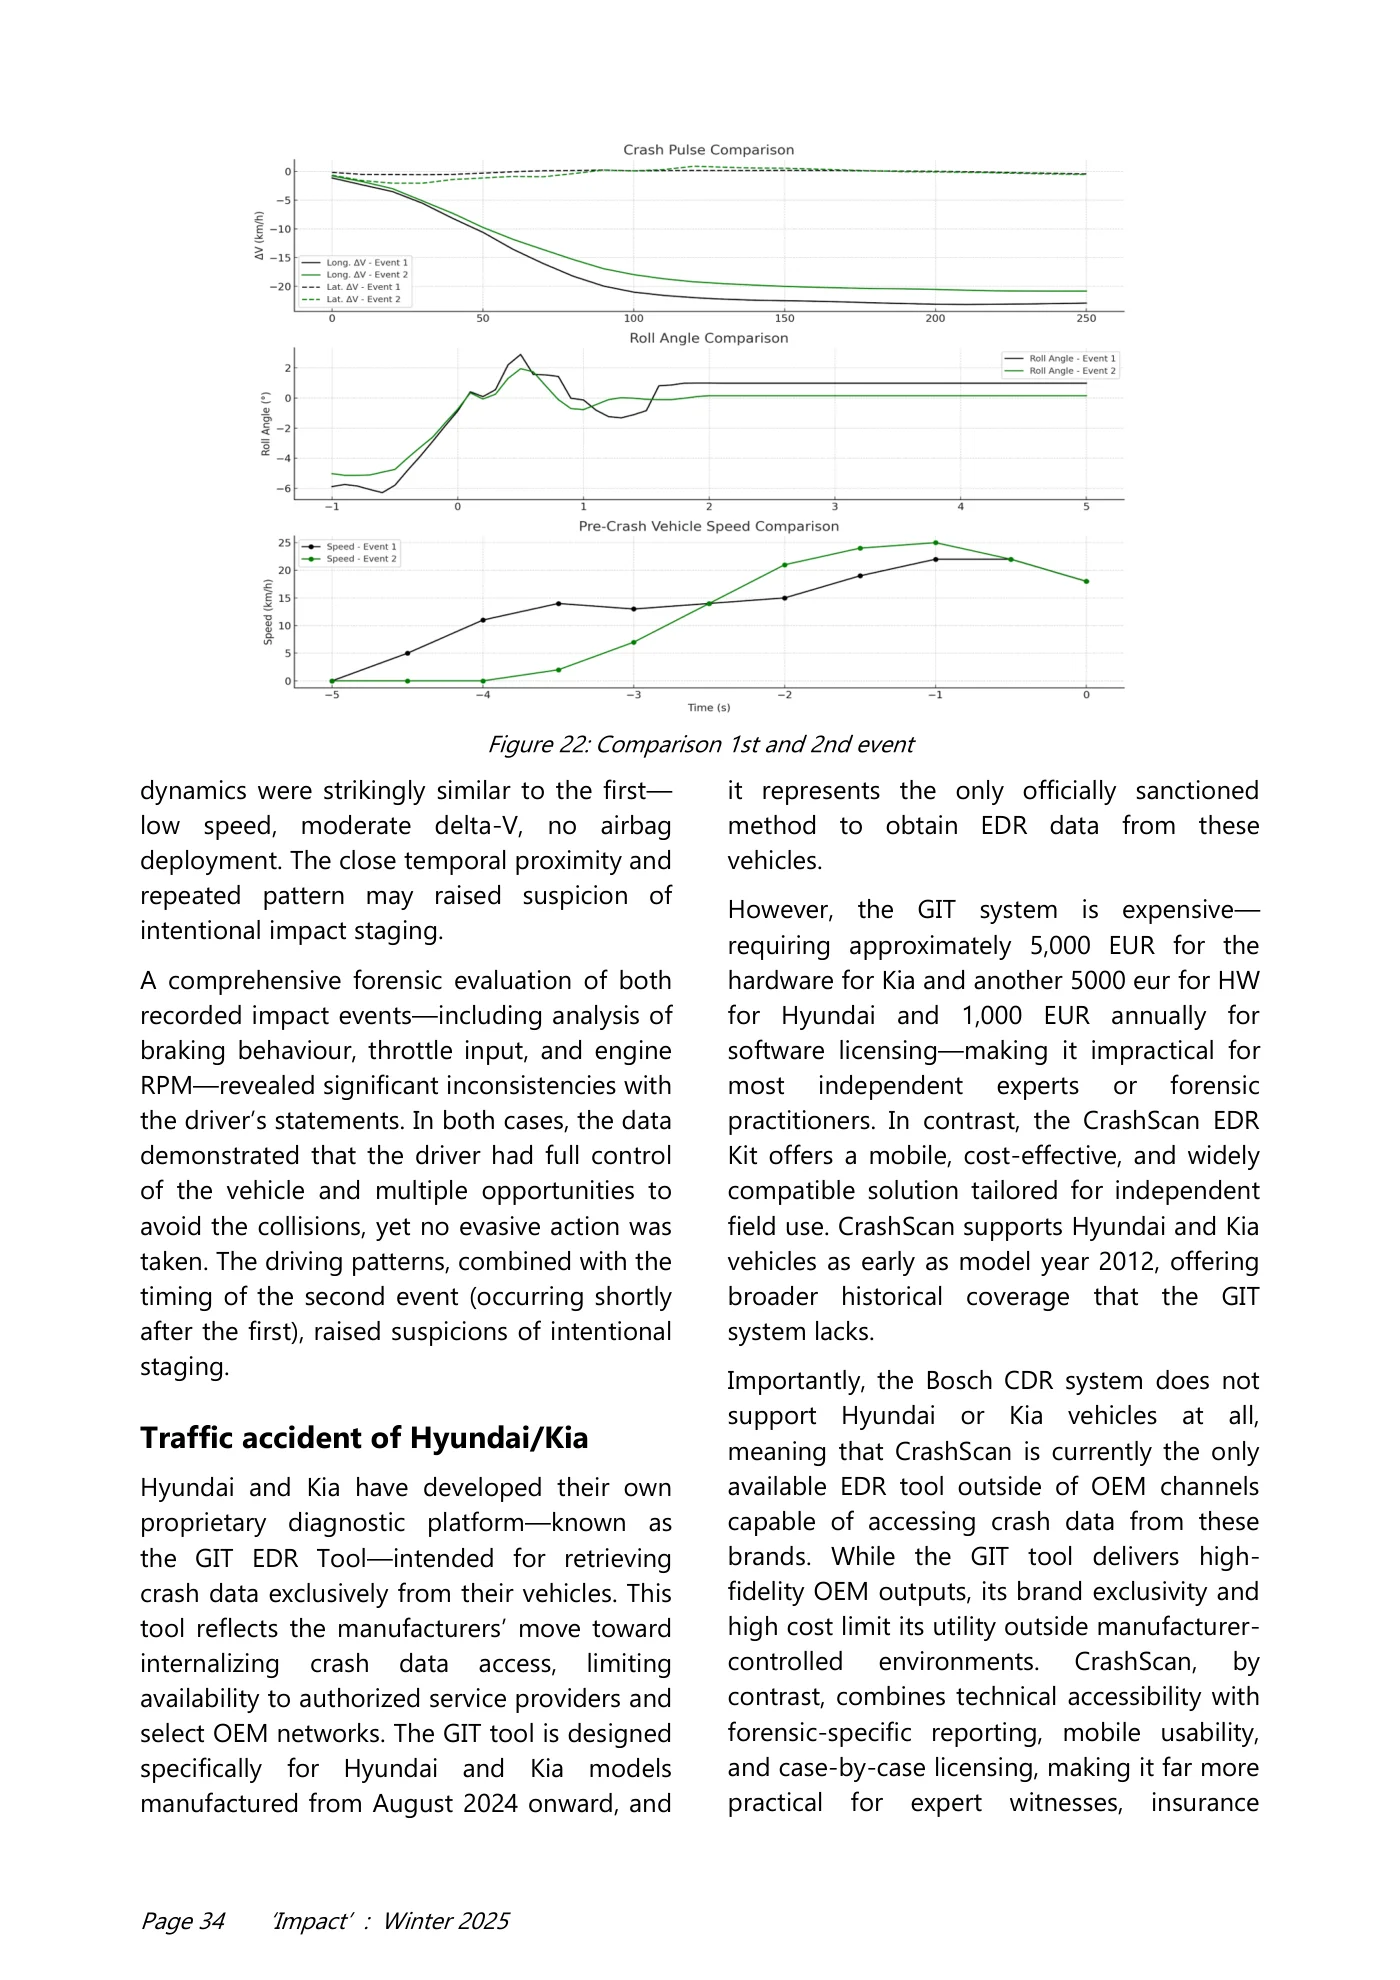
Page 32 ‘Impact’ : Winter 2025 Both CrashScan and XENTRY offer consistent data integrity, but CrashScan provides clearer access to all key vehicle dynamics parameters, including those that XENTRY omits or withholds. For independent experts and crash investigators, CrashScan delivers a practical and legally sufficient alternative to XENTRY. Based on the comprehensive comparison of EDR data retrieved via Mercedes-Benz XENTRY and the independent CrashScan platform, it is evident that both systems capture core crash-relevant parameters with high consistency. Values for vehicle speed, engine RPM, accelerator pedal position, brake status, steering input, and ABS activity are fully aligned across all timeframes, confirming the technical validity of CrashScan outputs. CrashScan fills gap with consistent metadata essential for legal admissibility and expert reconstruction. The CrashScan platform therefore provides a forensically robust, court-defensible alternative when OEM tools are inaccessible or limited in scope. For expert witnesses and accident reconstruction professionals, it represents a critical asset—particularly for field work and in cases involving unsupported or restricted vehicle platforms. An article featuring an in-depth analysis of multiple ACM units from Mercedes-Benz vehicles will be published in the near future. Traffic accident of Land Rover Land Rover does not offer any OEM- supported EDR (Event Data Recorder) diagnostic solution for independent experts or accident reconstruction professionals. Jaguar Land Rover does not provide a commercial tool or access protocol for retrieving crash data from its airbag control modules, and no official diagnostic system is available for forensic use outside its dealership network. The widely recognized Bosch CDR system does not support EU Land Rover or Jaguar vehicles, which makes traditional EDR data acquisition impossible through standard forensic channels. However, the CrashScan EDR Kit developed by Collision Sciences does support a lot of Jaguar and Land Rover platforms, offering a practical solution for obtaining EDR data from these vehicles. Using a mobile interface and OBD- based access, CrashScan allows experts to retrieve and analyze crash event information such as delta-V, airbag deployment timing, ignition cycles, and pre-crash behavior. This capability fills a critical gap for investigators dealing with unsupported OEM platforms. While the tool is not affiliated with the manufacturer, it provides consistent and reliable outputs that align with industry standards for accident reconstruction. The availability of this alternative ensures that EDR evidence from Land Rover and Jaguar vehicles can still be documented and interpreted in forensic and legal contexts. The data retrieved from the 2016 Land Rover could not be compared with Bosch CDR system, as neither supports EDR data extraction from Land Rover vehicles. Consequently, the CrashScan report serves as the sole available source of EDR data in this case. A comprehensive summary of the event and pre-crash behaviour is provided in the attached screenshots (see Figure 20 & 21). The protocol revealed a second recorded event, which occurred approximately 30 seconds after the initial collision. This secondary incident was logged by the airbag control module as a distinct crash event. Its Figure 19: CrashScan connected to the vehicle via OBD
Read page 33 text
Page 33 ‘Impact’ : Winter 2025 Figure 20: Example of CrashScan data from Land Rover Figure 21: Example of CrashScan crash pulse data from Land Rover
Read page 34 text
Page 34 ‘Impact’ : Winter 2025 dynamics were strikingly similar to the first— low speed, moderate delta-V, no airbag deployment. The close temporal proximity and repeated pattern may raised suspicion of intentional impact staging. A comprehensive forensic evaluation of both recorded impact events—including analysis of braking behaviour, throttle input, and engine RPM—revealed significant inconsistencies with the driver’s statements. In both cases, the data demonstrated that the driver had full control of the vehicle and multiple opportunities to avoid the collisions, yet no evasive action was taken. The driving patterns, combined with the timing of the second event (occurring shortly after the first), raised suspicions of intentional staging. Traffic accident of Hyundai/Kia Hyundai and Kia have developed their own proprietary diagnostic platform—known as the GIT EDR Tool—intended for retrieving crash data exclusively from their vehicles. This tool reflects the manufacturers’ move toward internalizing crash data access, limiting availability to authorized service providers and select OEM networks. The GIT tool is designed specifically for Hyundai and Kia models manufactured from August 2024 onward, and it represents the only officially sanctioned method to obtain EDR data from these vehicles. However, the GIT system is expensive— requiring approximately 5,000 EUR for the hardware for Kia and another 5000 eur for HW for Hyundai and 1,000 EUR annually for software licensing—making it impractical for most independent experts or forensic practitioners. In contrast, the CrashScan EDR Kit offers a mobile, cost-effective, and widely compatible solution tailored for independent field use. CrashScan supports Hyundai and Kia vehicles as early as model year 2012, offering broader historical coverage that the GIT system lacks. Importantly, the Bosch CDR system does not support Hyundai or Kia vehicles at all, meaning that CrashScan is currently the only available EDR tool outside of OEM channels capable of accessing crash data from these brands. While the GIT tool delivers high- fidelity OEM outputs, its brand exclusivity and high cost limit its utility outside manufacturer- controlled environments. CrashScan, by contrast, combines technical accessibility with forensic-specific reporting, mobile usability, and case-by-case licensing, making it far more practical for expert witnesses, insurance Figure 22: Comparison 1st and 2nd event
Read page 35 text
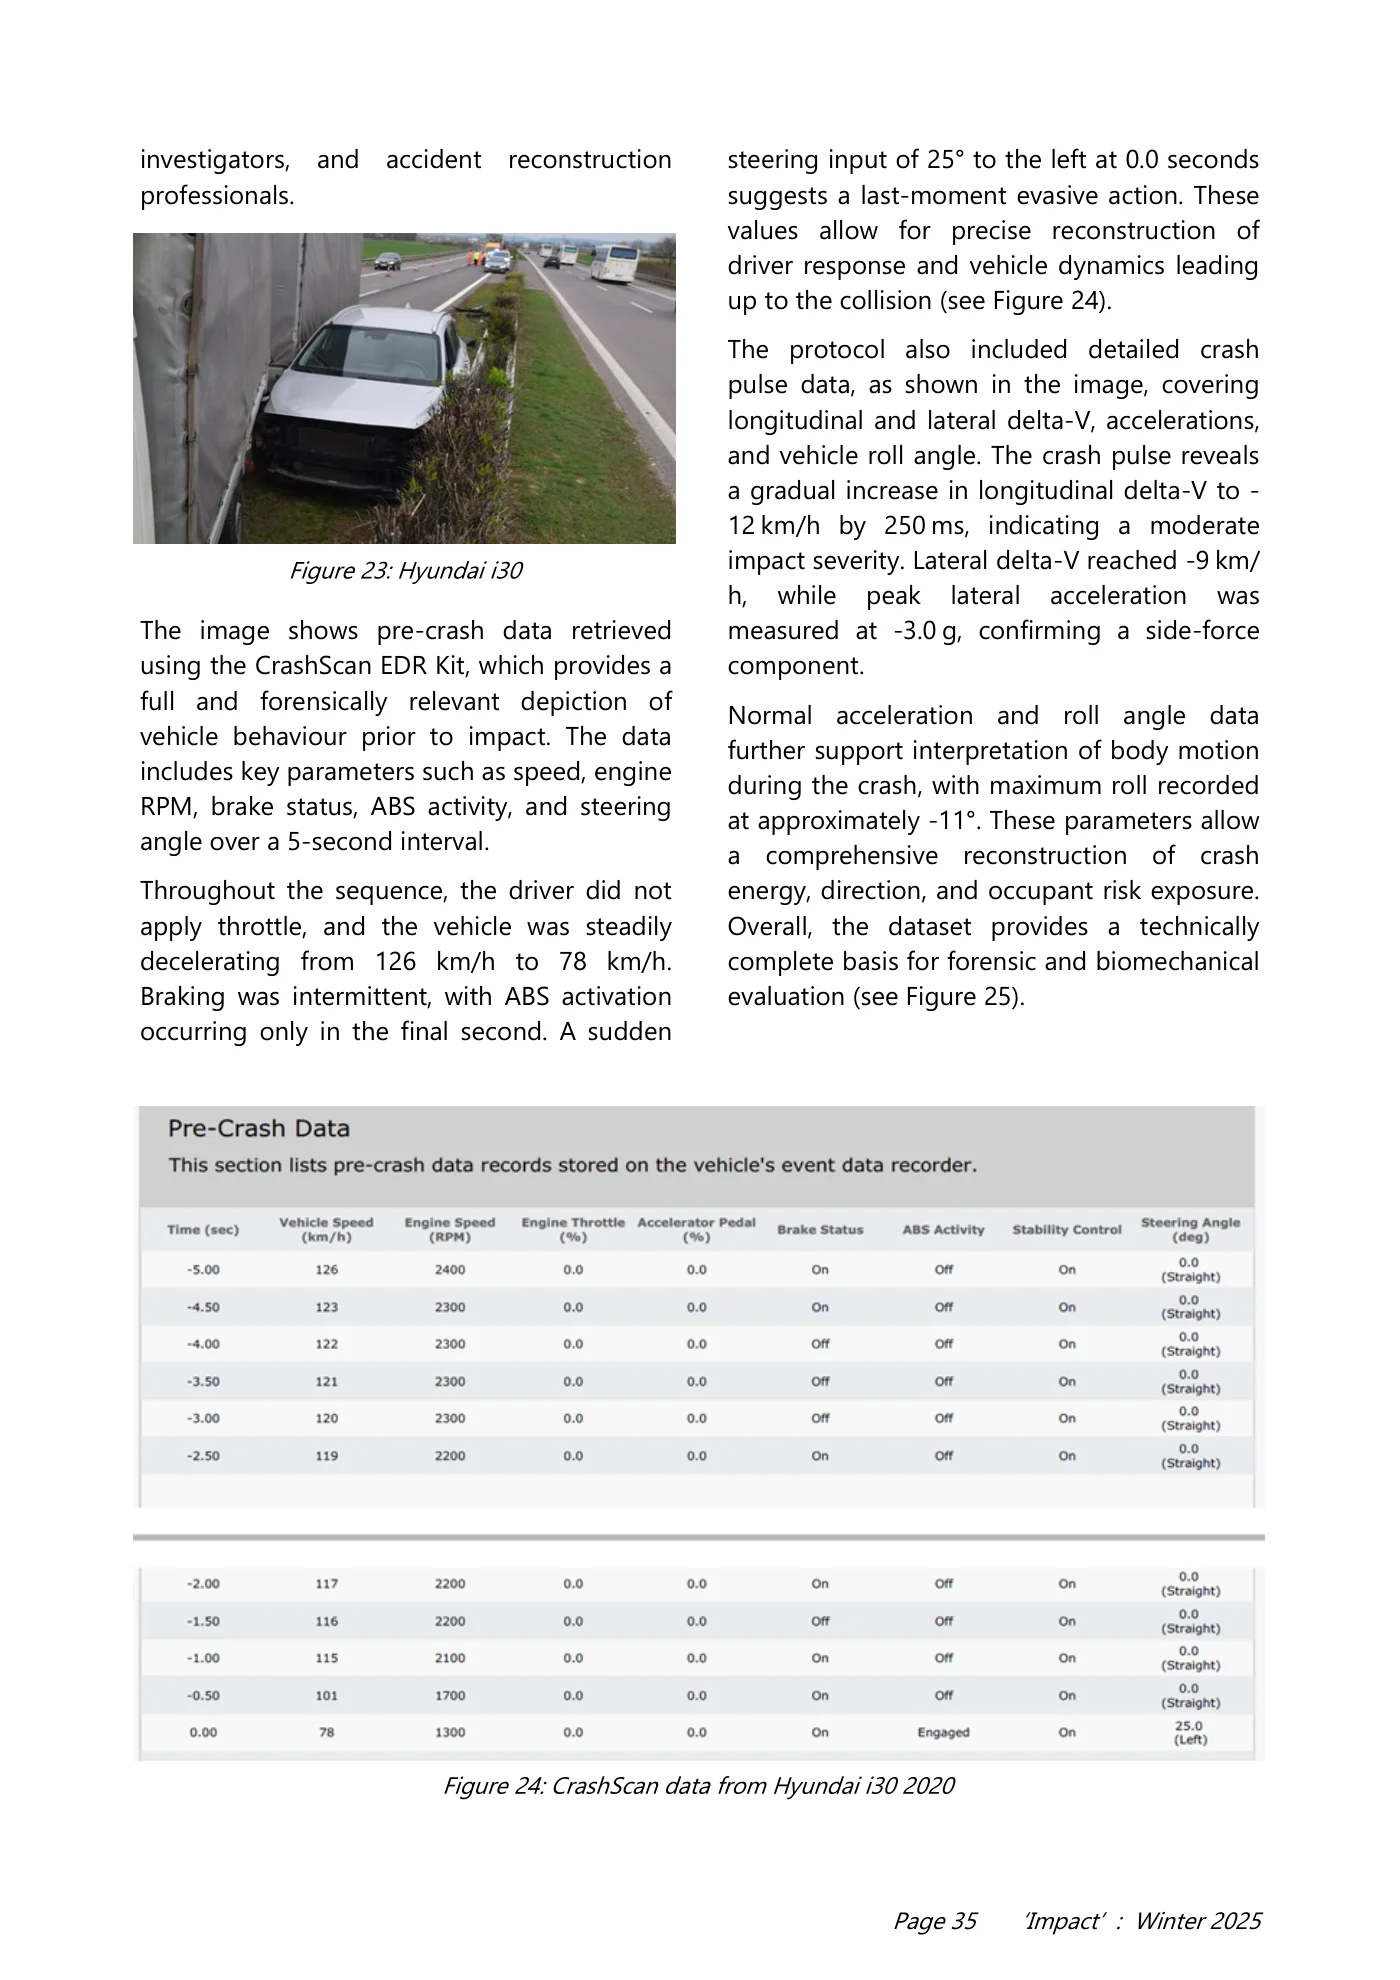
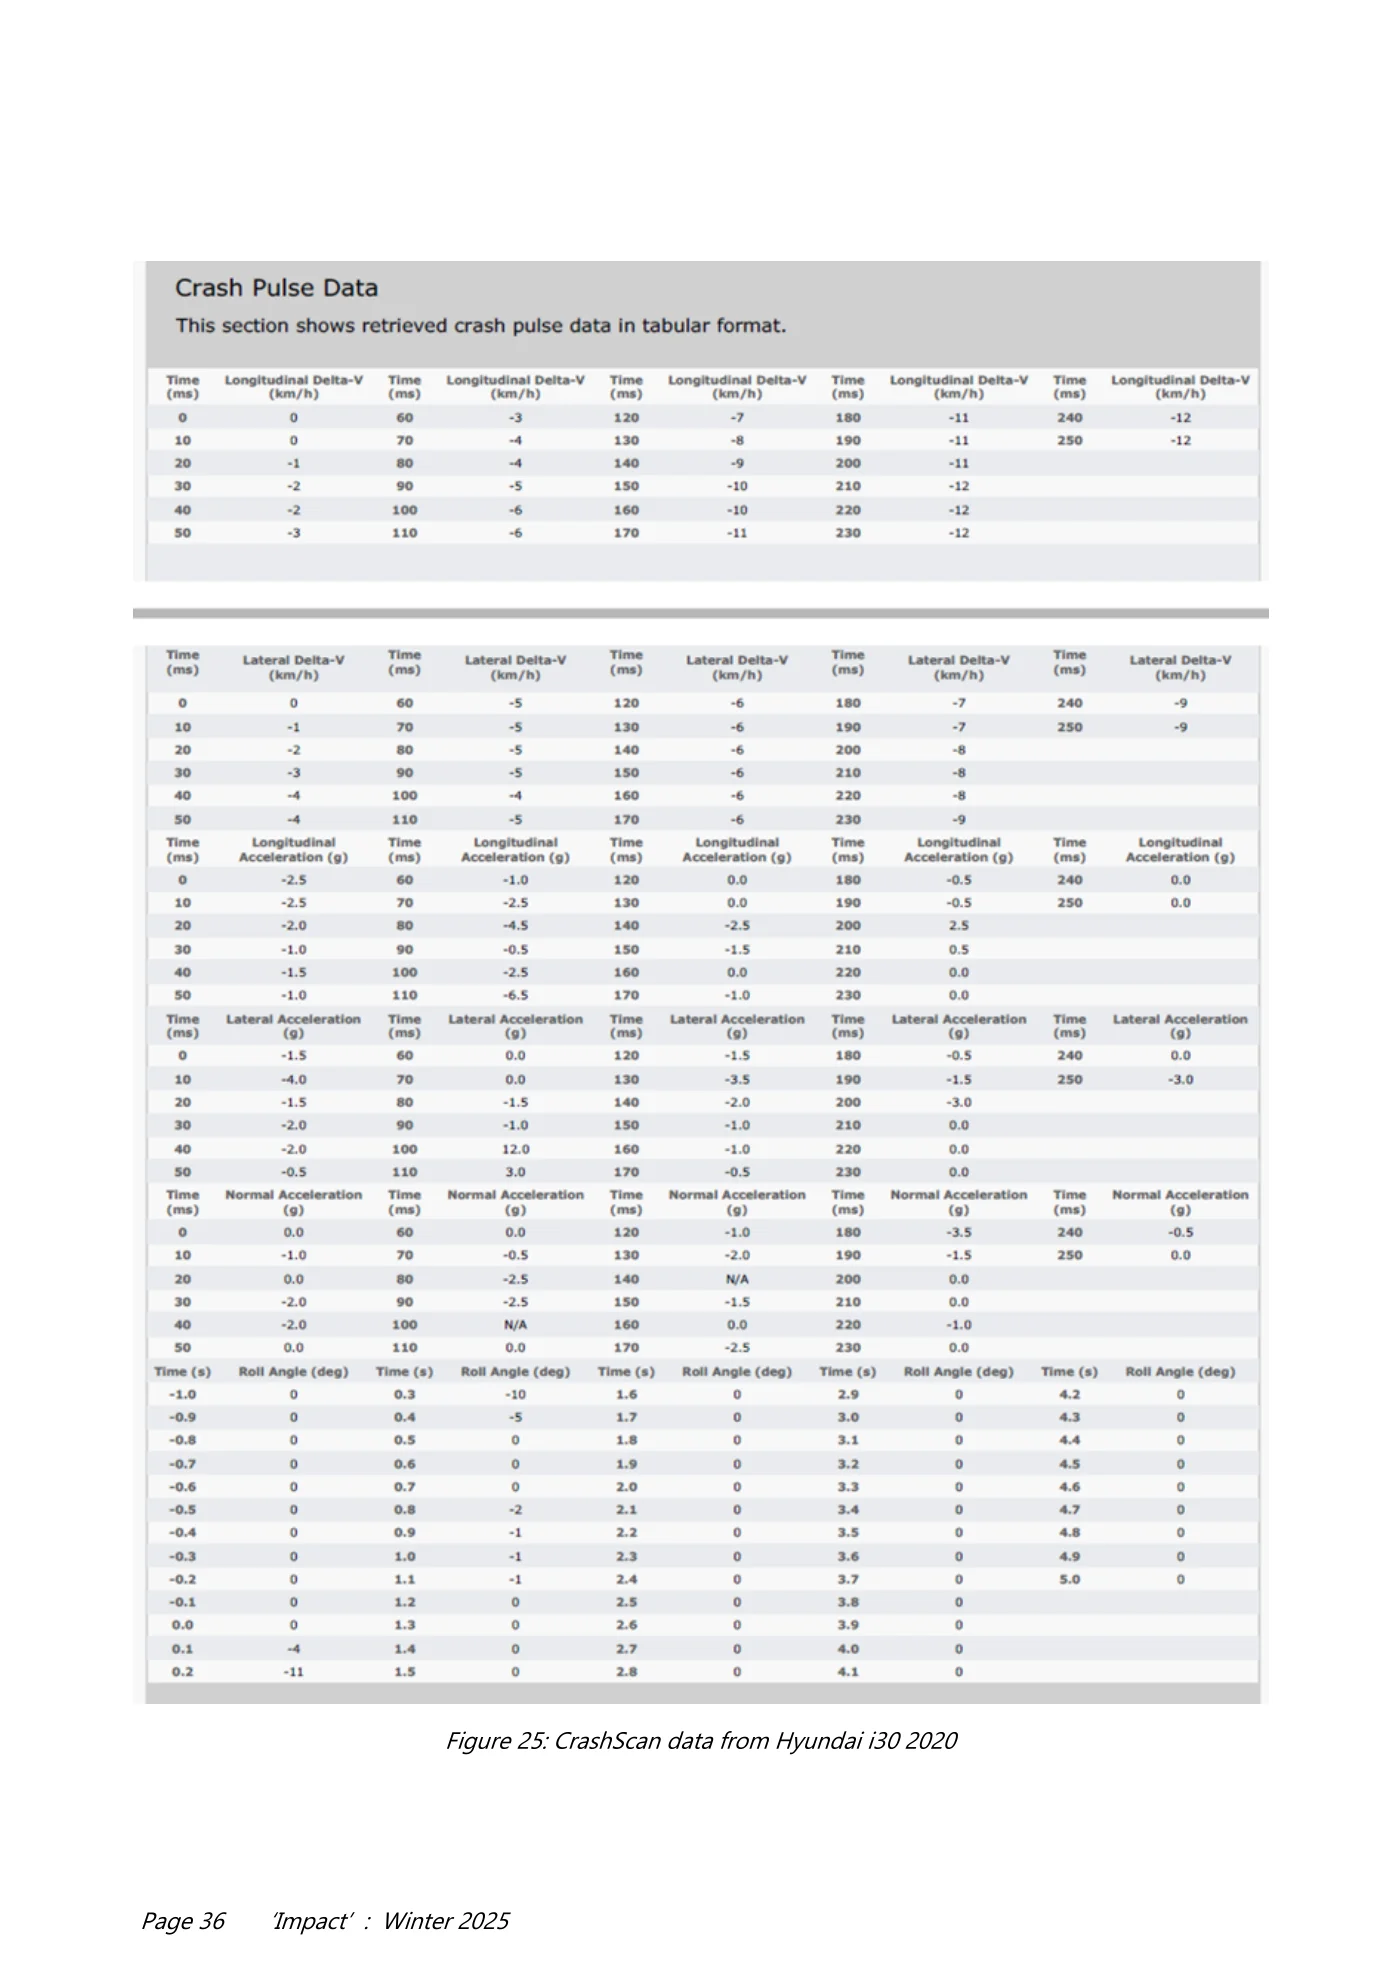
Page 35 ‘Impact’ : Winter 2025 investigators, and accident reconstruction professionals. The image shows pre-crash data retrieved using the CrashScan EDR Kit, which provides a full and forensically relevant depiction of vehicle behaviour prior to impact. The data includes key parameters such as speed, engine RPM, brake status, ABS activity, and steering angle over a 5-second interval. Throughout the sequence, the driver did not apply throttle, and the vehicle was steadily decelerating from 126 km/h to 78 km/h. Braking was intermittent, with ABS activation occurring only in the final second. A sudden steering input of 25° to the left at 0.0 seconds suggests a last-moment evasive action. These values allow for precise reconstruction of driver response and vehicle dynamics leading up to the collision (see Figure 24). The protocol also included detailed crash pulse data, as shown in the image, covering longitudinal and lateral delta-V, accelerations, and vehicle roll angle. The crash pulse reveals a gradual increase in longitudinal delta-V to - 12 km/h by 250 ms, indicating a moderate impact severity. Lateral delta-V reached -9 km/ h, while peak lateral acceleration was measured at -3.0 g, confirming a side-force component. Normal acceleration and roll angle data further support interpretation of body motion during the crash, with maximum roll recorded at approximately -11°. These parameters allow a comprehensive reconstruction of crash energy, direction, and occupant risk exposure. Overall, the dataset provides a technically complete basis for forensic and biomechanical evaluation (see Figure 25). Figure 23: Hyundai i30 Figure 24: CrashScan data from Hyundai i30 2020
Read page 36 text
Page 36 ‘Impact’ : Winter 2025 Figure 25: CrashScan data from Hyundai i30 2020

Read page 37 text
Page 37 ‘Impact’ : Winter 2025 Conclusion The comparative analysis clearly demonstrates that CrashScan represents a highly versatile and accessible solution for forensic experts and accident investigators. Unlike Bosch CDR and OEM-specific tools like the Mercedes- Benz XENTRY or the Hyundai GIT Tool, CrashScan provides brand-agnostic access to EDR data across a wide range of vehicle manufacturers. Its mobile format, minimal hardware requirements, and user-friendly reporting make it especially suitable for field deployment and on-site crash evaluations. While Bosch CDR remains a robust option for supported brands, its high cost, bulkiness, and more limited vehicle coverage constrain its practical use in many investigative scenarios. OEM tools like XENTRY are inaccessible to non -dealer professionals, severely limiting their forensic utility. GIT Tool is very expensive, 5000 euros for Kia and another 5000 euros for Hyundai, plus an annual license of 1000 euros per brand. Further, it only supports vehicles from 8/2024. In contrast, CrashScan delivers all critical EDR data—including pre-crash dynamics, delta-V curves, and ignition history—in a format tailored for forensic interpretation and court presentation. Its support for otherwise unsupported brands (e.g., Mercedes Benz, Ford, Land Rover, Hyundai, Kia and others) further enhances its value. For users who occasionally need to retrieve data, this tool is also financially very attractive. At the same time, it is a very compact piece of hardware that can be easily carried at all times. For independent experts and police forces, the ability to retrieve reliable crash data without OEM authorization is a decisive advantage. Given its consistent performance, technical accuracy, and comprehensive reporting, CrashScan fills critical gaps left by traditional systems and provides a legally defensible, cost -effective, and fully mobile platform for modern accident reconstruction. Contact Ing. Peter Vertal Institute of Forensic Engineering, University of Zilina E-mail: peter.vertal@usi.sk Impact Submissions invited Next Edition April. ‘26 As ever, the Editor would be very pleased to hear from members, non-members or subscribers, who have produced material that they feel would be of interest to readers of ’Impact’. Details of research projects or relevant collision investigation testing would be particularly welcome. At- tracting sufficient numbers of articles for publication in the Institute’s journal remains a difficulty! Whilst the Editor is delighted to receive papers from overseas contributors, a greater supply of ‘home grown’ material would also be very welcome. If you have any questions regarding the publication of an article / paper, or simply wish to discuss the possibility of preparing a piece for the journal, please contact the Editor at editor@itai.org
Read page 38 text
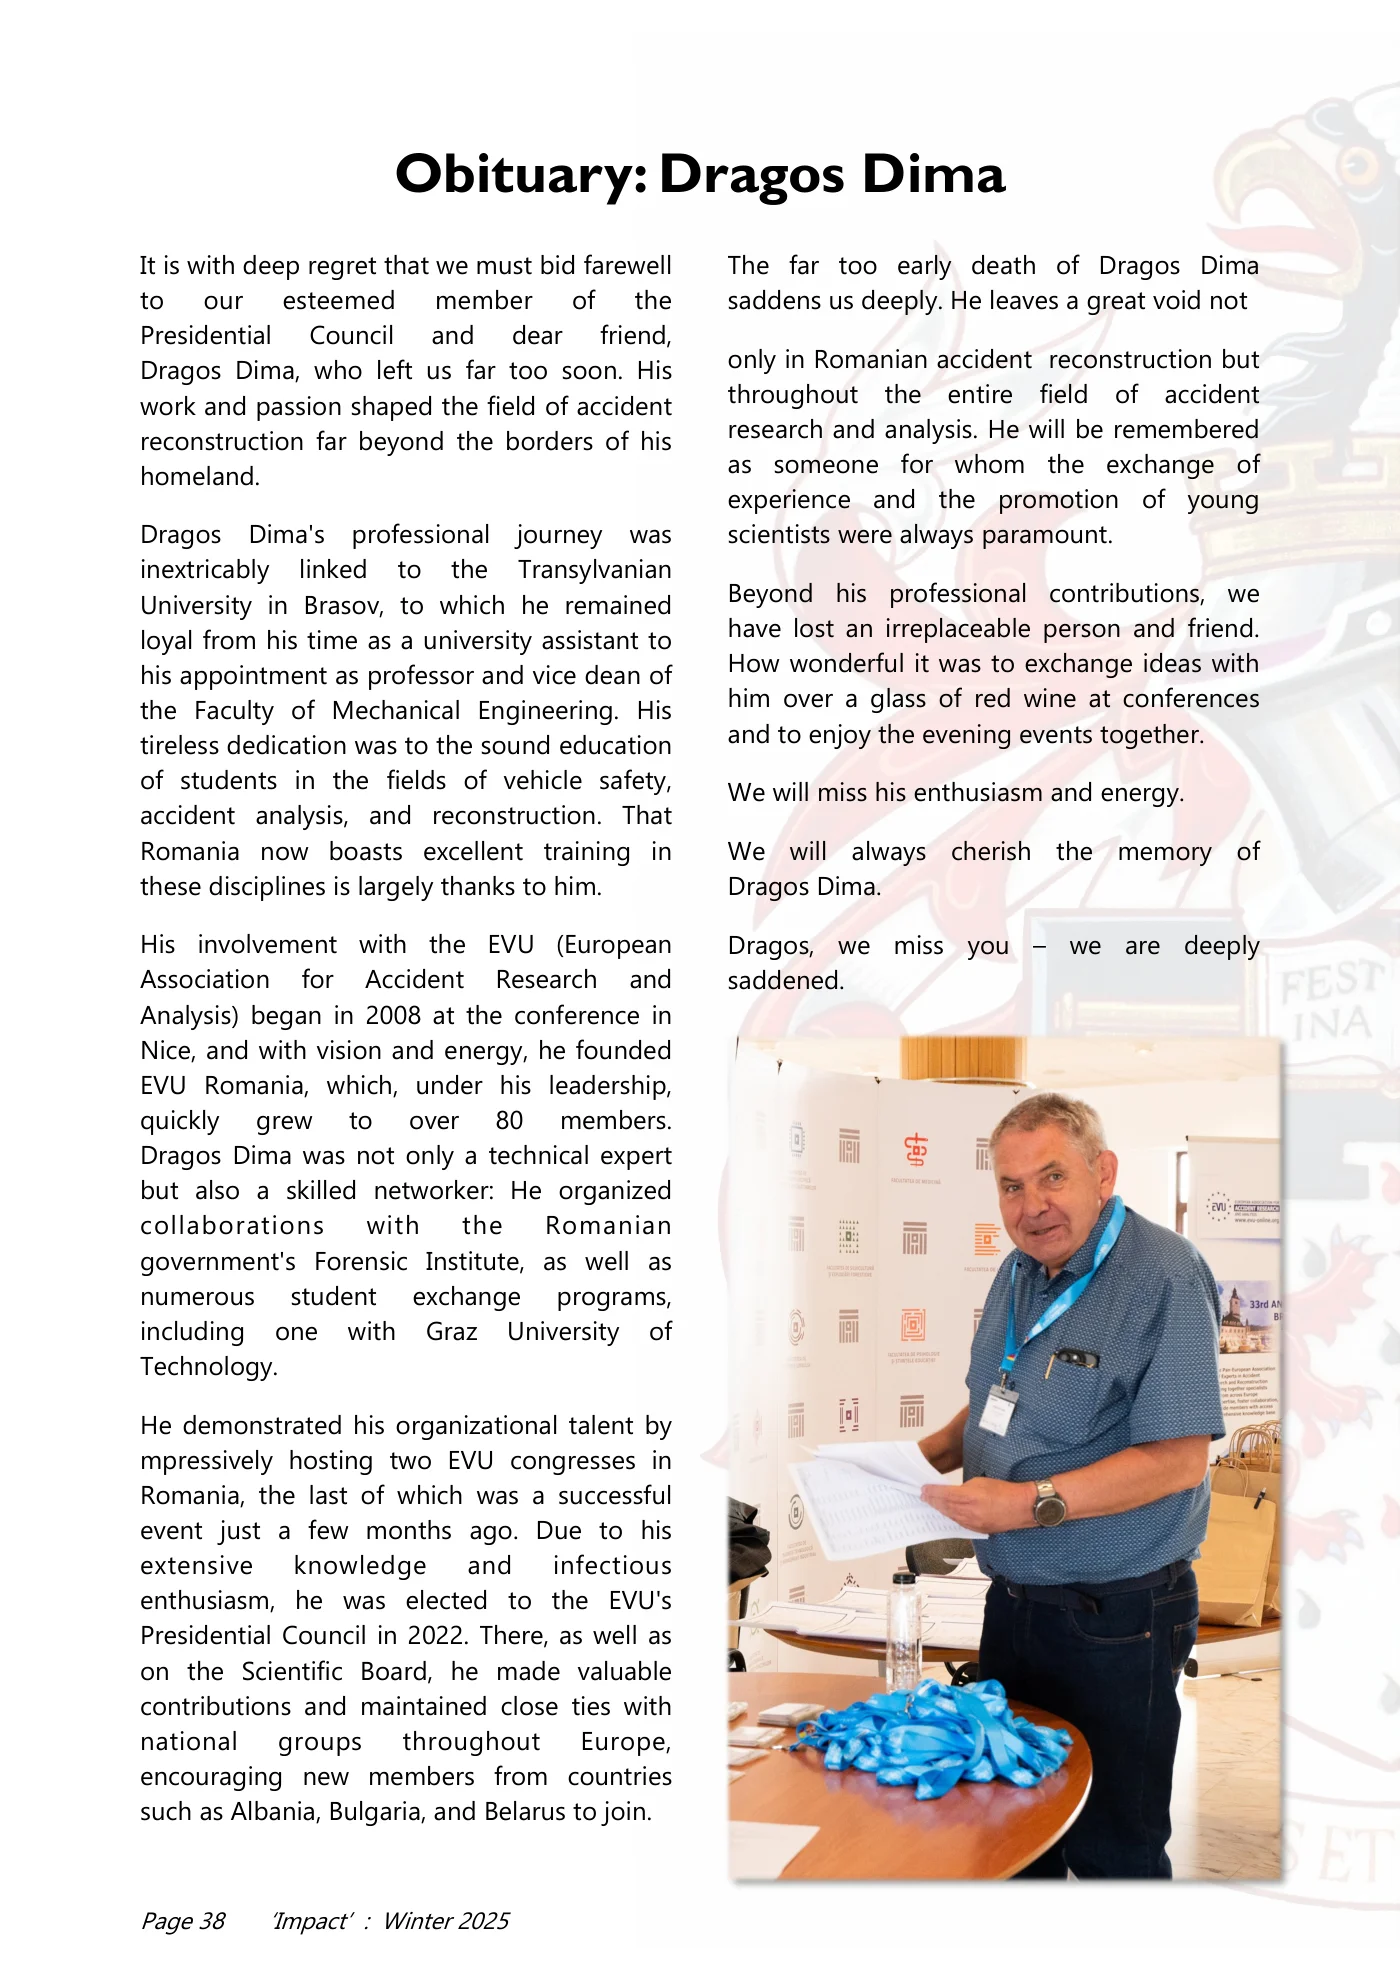
Page 38 ‘Impact’ : Winter 2025 It is with deep regret that we must bid farewell to our esteemed member of the Presidential Council and dear friend, Dragos Dima, who left us far too soon. His work and passion shaped the field of accident reconstruction far beyond the borders of his homeland. Dragos Dima's professional journey was inextricably linked to the Transylvanian University in Brasov, to which he remained loyal from his time as a university assistant to his appointment as professor and vice dean of the Faculty of Mechanical Engineering. His tireless dedication was to the sound education of students in the fields of vehicle safety, accident analysis, and reconstruction. That Romania now boasts excellent training in these disciplines is largely thanks to him. His involvement with the EVU (European Association for Accident Research and Analysis) began in 2008 at the conference in Nice, and with vision and energy, he founded EVU Romania, which, under his leadership, quickly grew to over 80 members. Dragos Dima was not only a technical expert but also a skilled networker: He organized collaborations with the Romanian government's Forensic Institute, as well as numerous student exchange programs, including one with Graz University of Technology. He demonstrated his organizational talent by mpressively hosting two EVU congresses in Romania, the last of which was a successful event just a few months ago. Due to his extensive knowledge and infectious enthusiasm, he was elected to the EVU's Presidential Council in 2022. There, as well as on the Scientific Board, he made valuable contributions and maintained close ties with national groups throughout Europe, encouraging new members from countries such as Albania, Bulgaria, and Belarus to join. The far too early death of Dragos Dima saddens us deeply. He leaves a great void not only in Romanian accident reconstruction but throughout the entire field of accident research and analysis. He will be remembered as someone for whom the exchange of experience and the promotion of young scientists were always paramount. Beyond his professional contributions, we have lost an irreplaceable person and friend. How wonderful it was to exchange ideas with him over a glass of red wine at conferences and to enjoy the evening events together. We will miss his enthusiasm and energy. We will always cherish the memory of Dragos Dima. Dragos, we miss you – we are deeply saddened. Obituary: Dragos Dima
Read page 39 text
Page 39 ‘Impact’ : Winter 2025 Mit tiefem Bedauern nehmen wir Abschied von unserem geschätzten Mitglied des Präsidialrates und lieben Freund Dragos Dima, der uns viel zu früh verlassen hat. Sein Wirken und seine Leidenschaft haben die Fachwelt der Unfallrekonstruktion weit über die Grenzen seines Heimatlandes hinaus geprägt. Die berufliche Reise von Dragos Dima war untrennbar mit der Transsilvanischen Universität in Brasov verbunden, der er von seiner Zeit als Universitätsassistent bis hin zu seiner Berufung als Professor und Vize-Dekan der Fakultät für Maschinenbau treu blieb. Sein unermüdlicher Einsatz galt vor allem der fundierten Ausbildung von Studenten in den Bereichen Fahrzeugsicherheit, Unfallanalyse und Rekonstruktion. Dass Rumänien heute über eine exzellente Ausbildung in diesen Fachgebieten verfügt, ist zu einem großen Teil sein Verdienst. Sein Engagement für die EVU begann im Jahr 2008 bei der Tagung in Nizza. Mit Vision und Tatkraft gründete er die EVU Rumänien, die unter seiner Leitung binnen kürzester Zeit auf über 80 Mitglieder anwuchs. Dragos Dima war nicht nur ein fachlicher Experte, sondern auch ein Netzwerker: Er organisierte Kooperationen mit dem Forensischen Institut der rumänischen Regierung, sowie zahlreiche studentische Austauschprogramme, unter anderem mit der TU Graz. Sein Organisationstalent bewies er eindrucksvoll durch die Ausrichtung von zwei EVUKongressen in Rumänien, wobei die letzte erfolgreiche Tagung erst wenige Monate zurückliegt. Aufgrund seiner umfassenden Kenntnisse und seiner ansteckenden Motivation wurde er 2022 in den Präsidialrat des EVU gewählt. Dort, sowie im Scientific Board, leistete er wertvolle Beiträge und pflegte intensive Kontakte zu Ländergruppen in ganz Europa, animierte auch neue Mitglieder aus Ländern wie beispielsweise Albanien, Bulgarien oder Weißrussland zum Beitritt. Der viel zu frühe Tod von Dragos Dima macht uns traurig. Er hinterlässt nicht nur in der rumänischen Unfallrekonstruktion eine große Lücke, sondern überall in der Fachwelt der Unfallforschung und Unfallanalyse. Er wird als ein Mensch in Erinnerung bleiben, für den der Erfahrungsaustausch und die Förderung des wissenschaftlichen Nachwuchses stets an erster Stelle standen. Doch über das Fachliche hinaus verlieren wir mit ihm einen unersetzlichen Menschen und Freund. Wie schön war es, bei einer Tagung mit ihm bei einem Glas Rotwein Gedanken a u s z u t a u s c h e n u n d b e i d e n Abendveranstaltungen Spaß zu haben. Sein Enthusiasmus und seine Energie werden uns fehlen. Wir werden Dragos Dima stets ein ehrendes Andenken bewahren. Dragos, du fehlst uns – wir vermissen dich. Nachruf: Dragos Dima

Read page 40 text
Page 40 ‘Impact’ : Winter 2025

Read page 41 text
Page 41 ‘Impact’ : Winter 2025

Read page 42 text
Page 42 ‘Impact’ : Winter 2025 Rates for advertising in ‘Impact’ Advertisement Further details from the Editor who will be pleased to deal with any queries that you may have in relation to placing an advertisement (or advertisements) in the Institute’s journal. editor @itai.org Advertisement Quarter Page (92mm x 136mm) Full Colour Single entry £200 Discounted rate of £450 for 3 consecutive entries Advertisement Half Page (190mm x 136mm) Full Colour Single entry £320 Discounted rate of £720 for 3 consecutive entries Full Page (190mm x 279mm) Full Colour Single entry £500 Discounted rate of £1125 for 3 consecutive entries ‘Impact’ is published 3 times each year (April, September, December) and is circulated to all members of the Institute in the UK and overseas. In addition, there are many non-member subscribers (also in the UK and overseas), who receive the publication. The journal reaches specialist police officers, researchers, private consultants, engineers and other professionals involved in collision investigation. ‘Impact’ is now in its 29th year ! Over that period, advertisements placed in the journal have proved highly effective in alerting its readers to - • Specialist Courses • Conferences • Specialist equipment / software • Career opportunities • Professional services Anyone considering advertising in ‘Impact’ is invited to contact the Editor, who will be pleased to assist by providing further details and deal with any queries. editor@itai.org

Read page 43 text
Page 43 ‘Impact’ : Winter 2025 Are you a Charted Engineer? If not, Why NOT? ITAI is a Professional Affiliate of the Engineering Council and as such we have developed a route to professional engineering registration for our members, so why not apply to become an Engineering Technician, an Incorporated Engineer or a Charted Engineer. There are 2 avenues to becoming registered: Qualification and/or Experience. The majority of our members, as well as having accident/collision investigation qualifications, also have a vast experience including training in ancillary subjects – to name a few: tyre / vehicle examination, CCTV and incident data analysis, PC-Crash, and so on. Putting all this together you will realise how experienced and qualified you are – so what are you waiting for? Full details are available in our members section on our website: www.itai.org Are you already a Charted Engineer? If so, you can have your registration transferred, FREE of charge to ITAI – all we need is a copy of your registration certificate – send it to: General Secretary at—gensec@itai.org
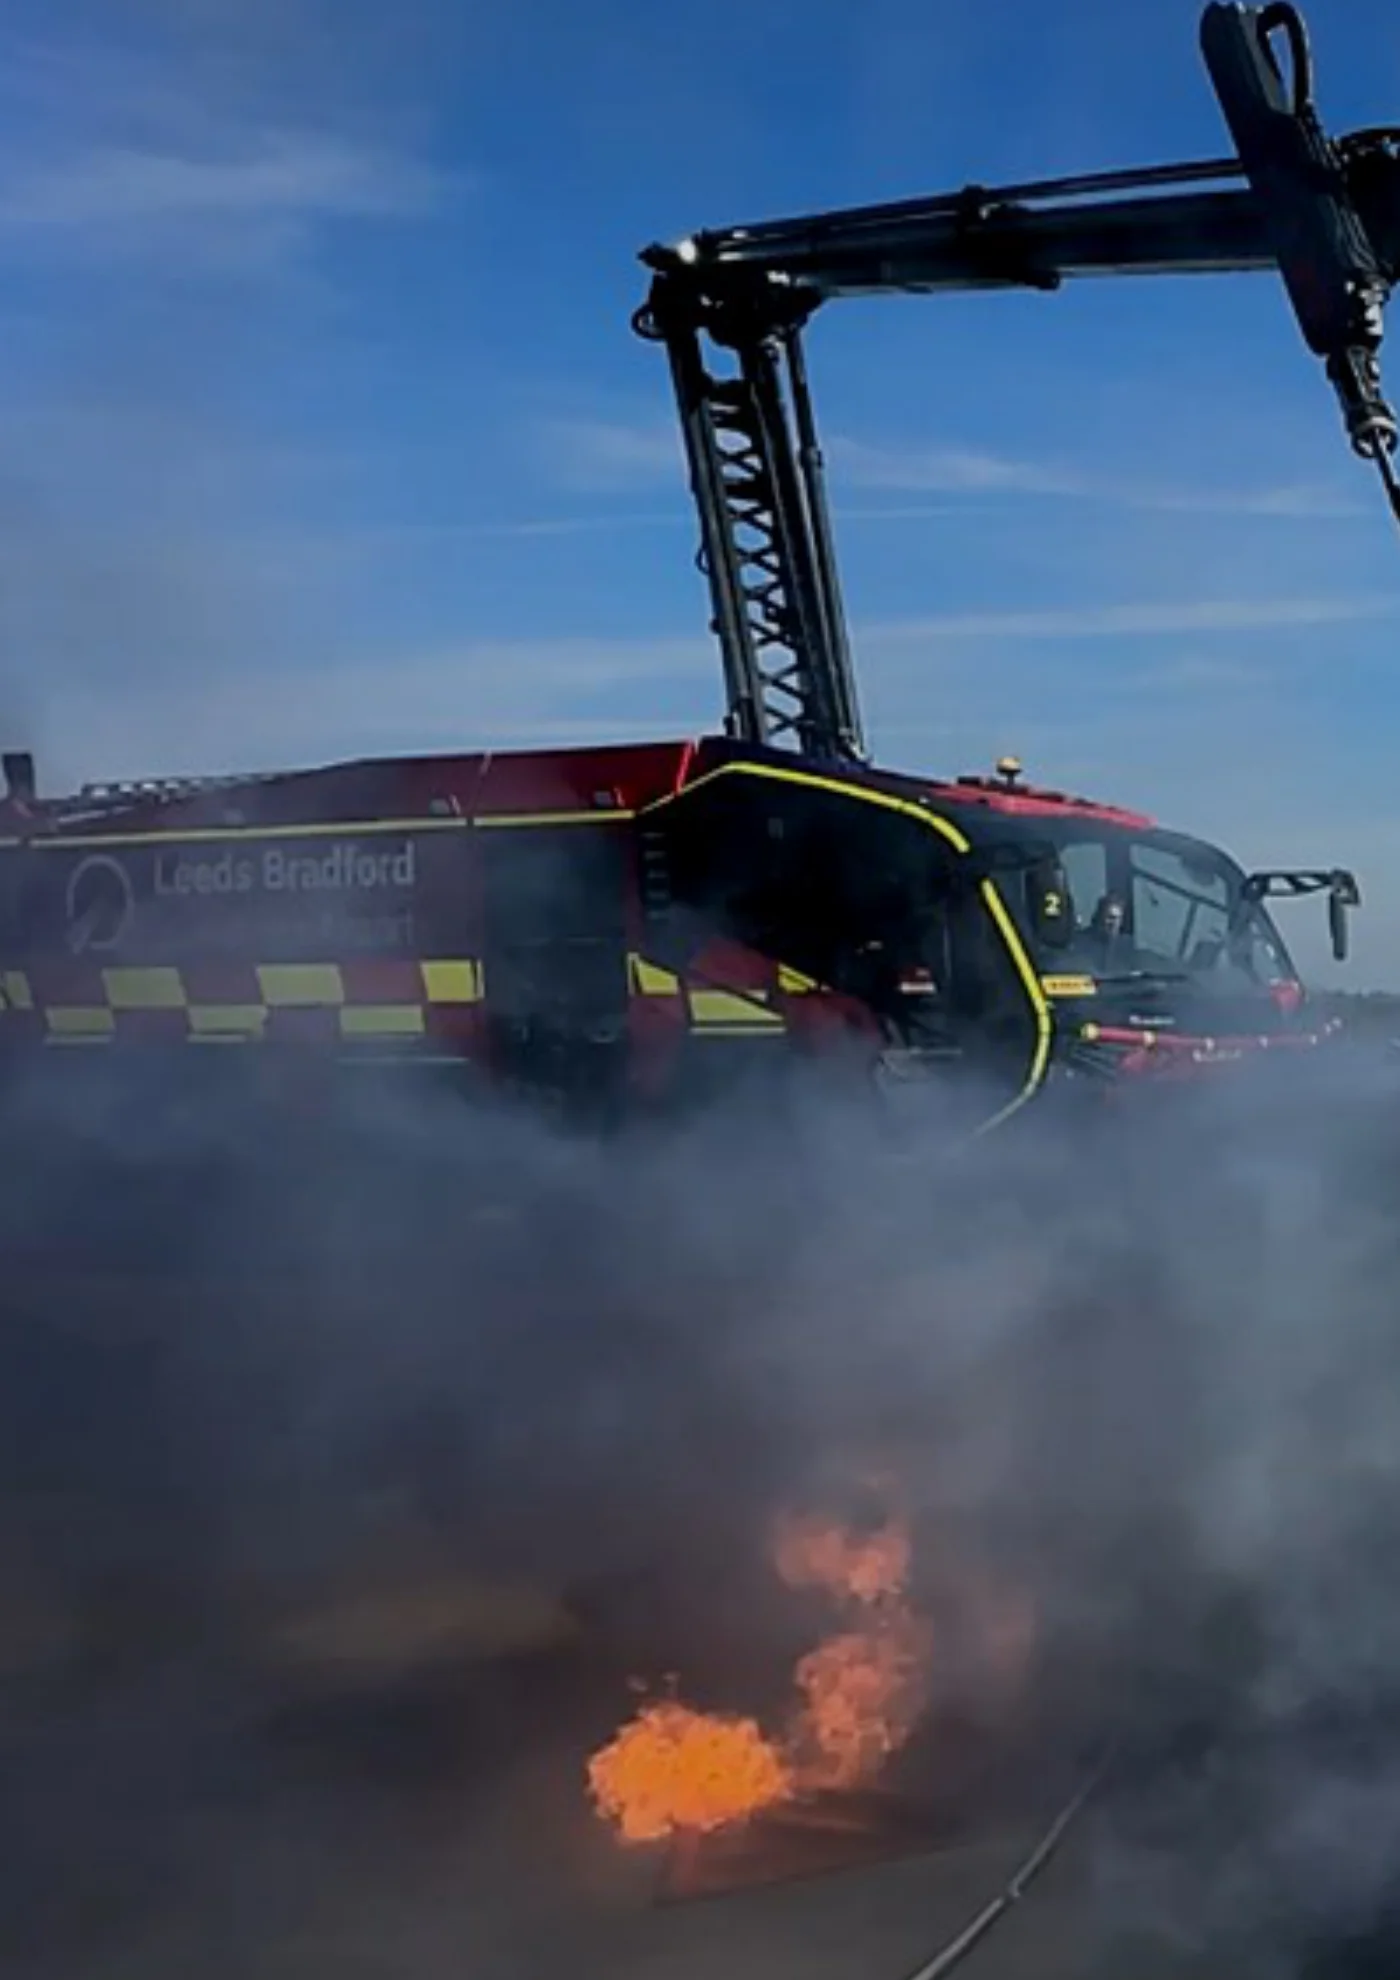
Read page 44 text
Page 44 ‘Impact’ : Winter 2025