
Source page 1
Read page 1 extracted text
Extracted text may not preserve table columns. Refer to the page image or original PDF for data relationships.
Validation of CrashScan EDR Data Through Consistency with BMW Drive Recorder Metadata Ing. Peter Vertal, Ph.D. Abstract This study presents a forensic analysis of a traffic accident involving a BMW M8 using Event Data Recorder (EDR) data from CrashScan and vehicle camera metadata. The aim was to verify consistency and reliability of independent data sources in reconstructing vehicle motion and impact conditions. The analysis showed strong agreement between EDR speed data and Drive Recorder metadata, confirming consistent pre-crash dynamics. The vehicle exceeded the speed limit, followed by braking approximately 2.5 seconds before impact, with a collision speed of about 38 km/h. Differences between EDR-reported delta-V (100 Hz) and values derived from higher-resolution acceleration data (500 Hz) indicate the effect of internal processing and downsampling within the airbag control unit. The study confirms that CrashScan EDR data were validated through independent vehicle metadata, demonstrating their reliability for accident reconstruction, while still requiring careful interpretation of internally processed outputs. Introduction allegedly lost the ability to brake the vehicle effectively before the intersection. The vehicle The traffic accident occurred within a built- involved was a relatively new high-performanceup urban area on a section of public road where the passenger vehicle with an approximate mileage ofmaximum permitted speed was 50 km/h. The only 20,000 km and an estimated value oflocation was situated in a residential housing estate approximately 220,000 EUR.in close proximity to a school, which represents an area with a potentially increased presence of No personal injuries were reported among pedestrians and other vulnerable road users. From the participants of the traffic accident. In the BMW the perspective of environmental and traffic vehicle, the driver was accompanied by his conditions, the circumstances were favourable. The approximately 2.5-year-old son, who was accident occurred during daylight hours, the driver transported in a child safety seat that was correctly was not dazzled by sunlight, visibility conditions installed and anchored using the ISOFIX system, were good, and the road surface was dry. thus complying with the applicable safety requirements for the transportation of children in The driver of the passenger vehicle BMW motor vehicles.M8 stated that he had been travelling at a speed of approximately 50 km/h, which according to his In the second involved vehicle, a Volkswagen statement corresponded to the maximum permitted passenger vehicle, there were two occupants. speed in the given area. According to his testimony, According to the available information, the a sudden failure of the left front tyre occurred during Volkswagen vehicle had been stationary before the the drive, as a result of which he intersection due to the traffic light signal indicating red (“stop”). The driver of the Volkswagen vehicle
Source page 2
Read page 2 extracted text
Extracted text may not preserve table columns. Refer to the page image or original PDF for data relationships.
was unable to provide any relevant information measure was being implemented. Based on the regarding the driving style of the BMW vehicle or the above-mentioned circumstances, the case triggered a events immediately preceding the collision, as his deeper level of examination by the police authorities. vehicle had been stationary at the time. At the same time, the situation served as a methodological and instructional exercise for the Immediately after the accident, the driver of participating units. The objective was not only to the BMW vehicle began to express strong clarify the factual circumstances of the accident but disagreement with the process of accident also to verify and improve operational procedures documentation and with further procedural steps used in the documentation of traffic accidents. undertaken by the police officers. He did not acknowledge responsibility for the occurrence of the Within this framework, additional personnel accident and communicated his disagreement in a were involved in the documentation and confrontational and emotionally charged manner. examination process. Specifically, a police officer from the District Traffic Inspectorate of the Traffic Although the incident represented a Police was deployed, who operates an unmanned relatively minor traffic accident which, under Slovak aerial system assigned to the aviation unit of the legislation, is typically classified as a traffic offence Ministry of the Interior. In addition, a firefighter with (administrative delict) without the threat of severe specialized training in aerial documentation and legal sanctions, the attending police officer reacted technical scene recording was also engaged. Both appropriately from a procedural standpoint and individuals possessed the necessary professional decided to secure the BMW vehicle for further qualifications and certifications for operating aerial examination. platforms and for conducting technical A key element of the subsequent documentation of incident scenes. investigation was the acquisition of data from the Their participation in the investigation vehicle’s Event Data Recorder (EDR) using Collision served a dual purpose. On one hand, it enabled the Sciences CrashScan. This EDR system is capable of application of advanced documentation techniques, storing selected parameters related to the vehicle’s including aerial imaging and spatial recording of the operation immediately before a collision event, such accident site. On the other hand, it provided an as vehicle speed, braking input, accelerator position, opportunity to test inter-agency cooperation and activation of various safety systems. For this between different emergency and investigative units reason, the vehicle was secured as potential evidence under real operational conditions. The activities were and was intended to undergo technical examination carried out in cooperation with a forensic traffic in order to obtain and analyse these data. At the accident expert (the author of this article), who moment when the BMW driver was informed about participated in the examination as a specialist the decision to secure the vehicle for forensic observer. Although the accident itself might initially examination and data extraction, he reacted with appear relatively simple in terms of its legal significant surprise and questioned why such a classification and consequences, it provided a
Source page 3
Read page 3 extracted text
Extracted text may not preserve table columns. Refer to the page image or original PDF for data relationships.
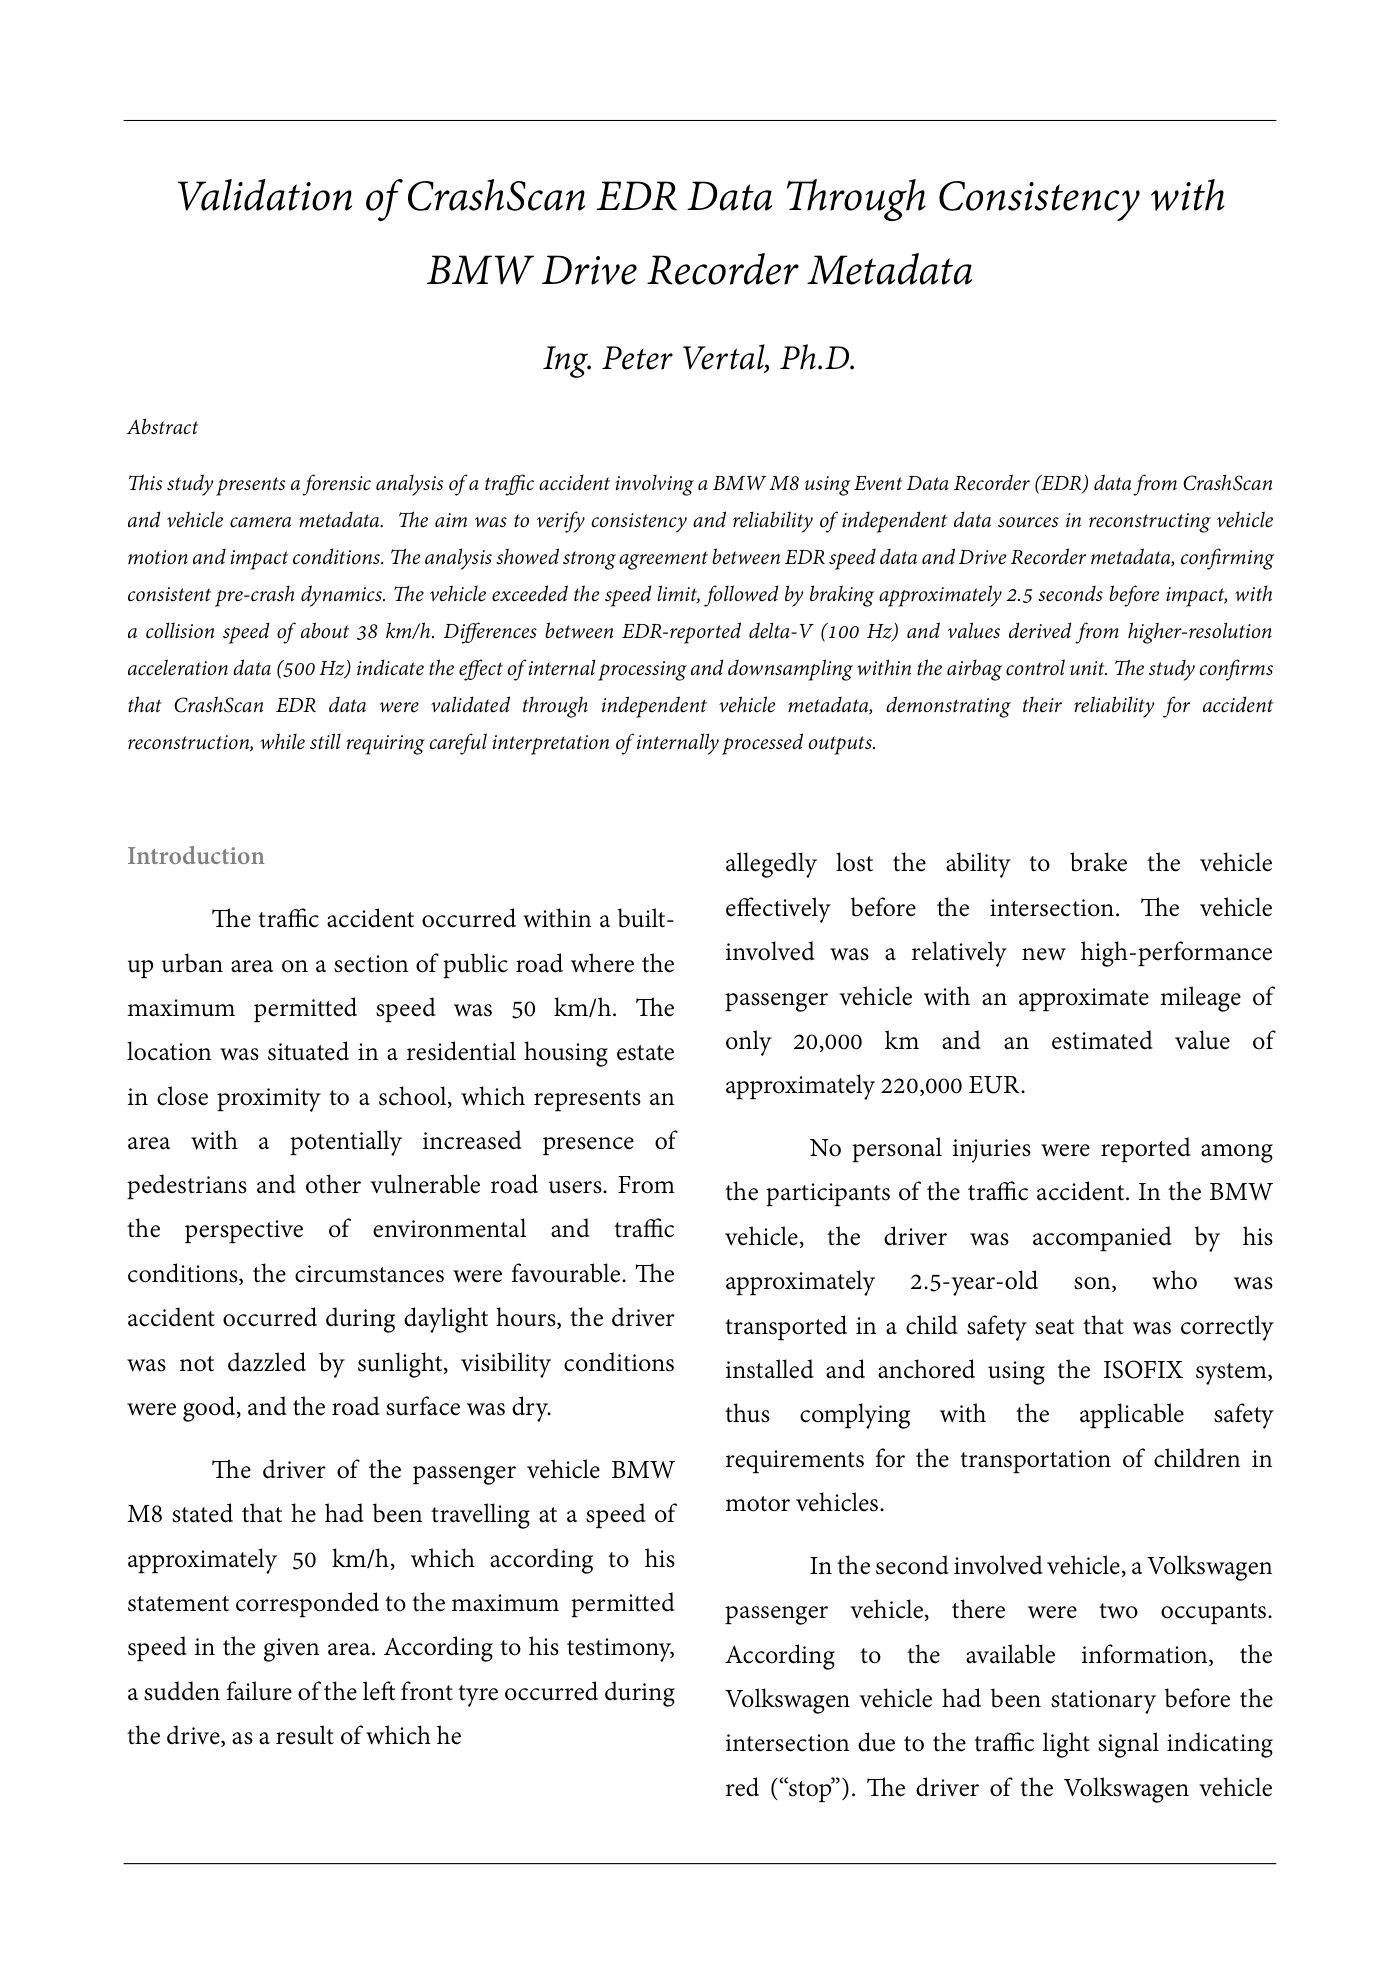
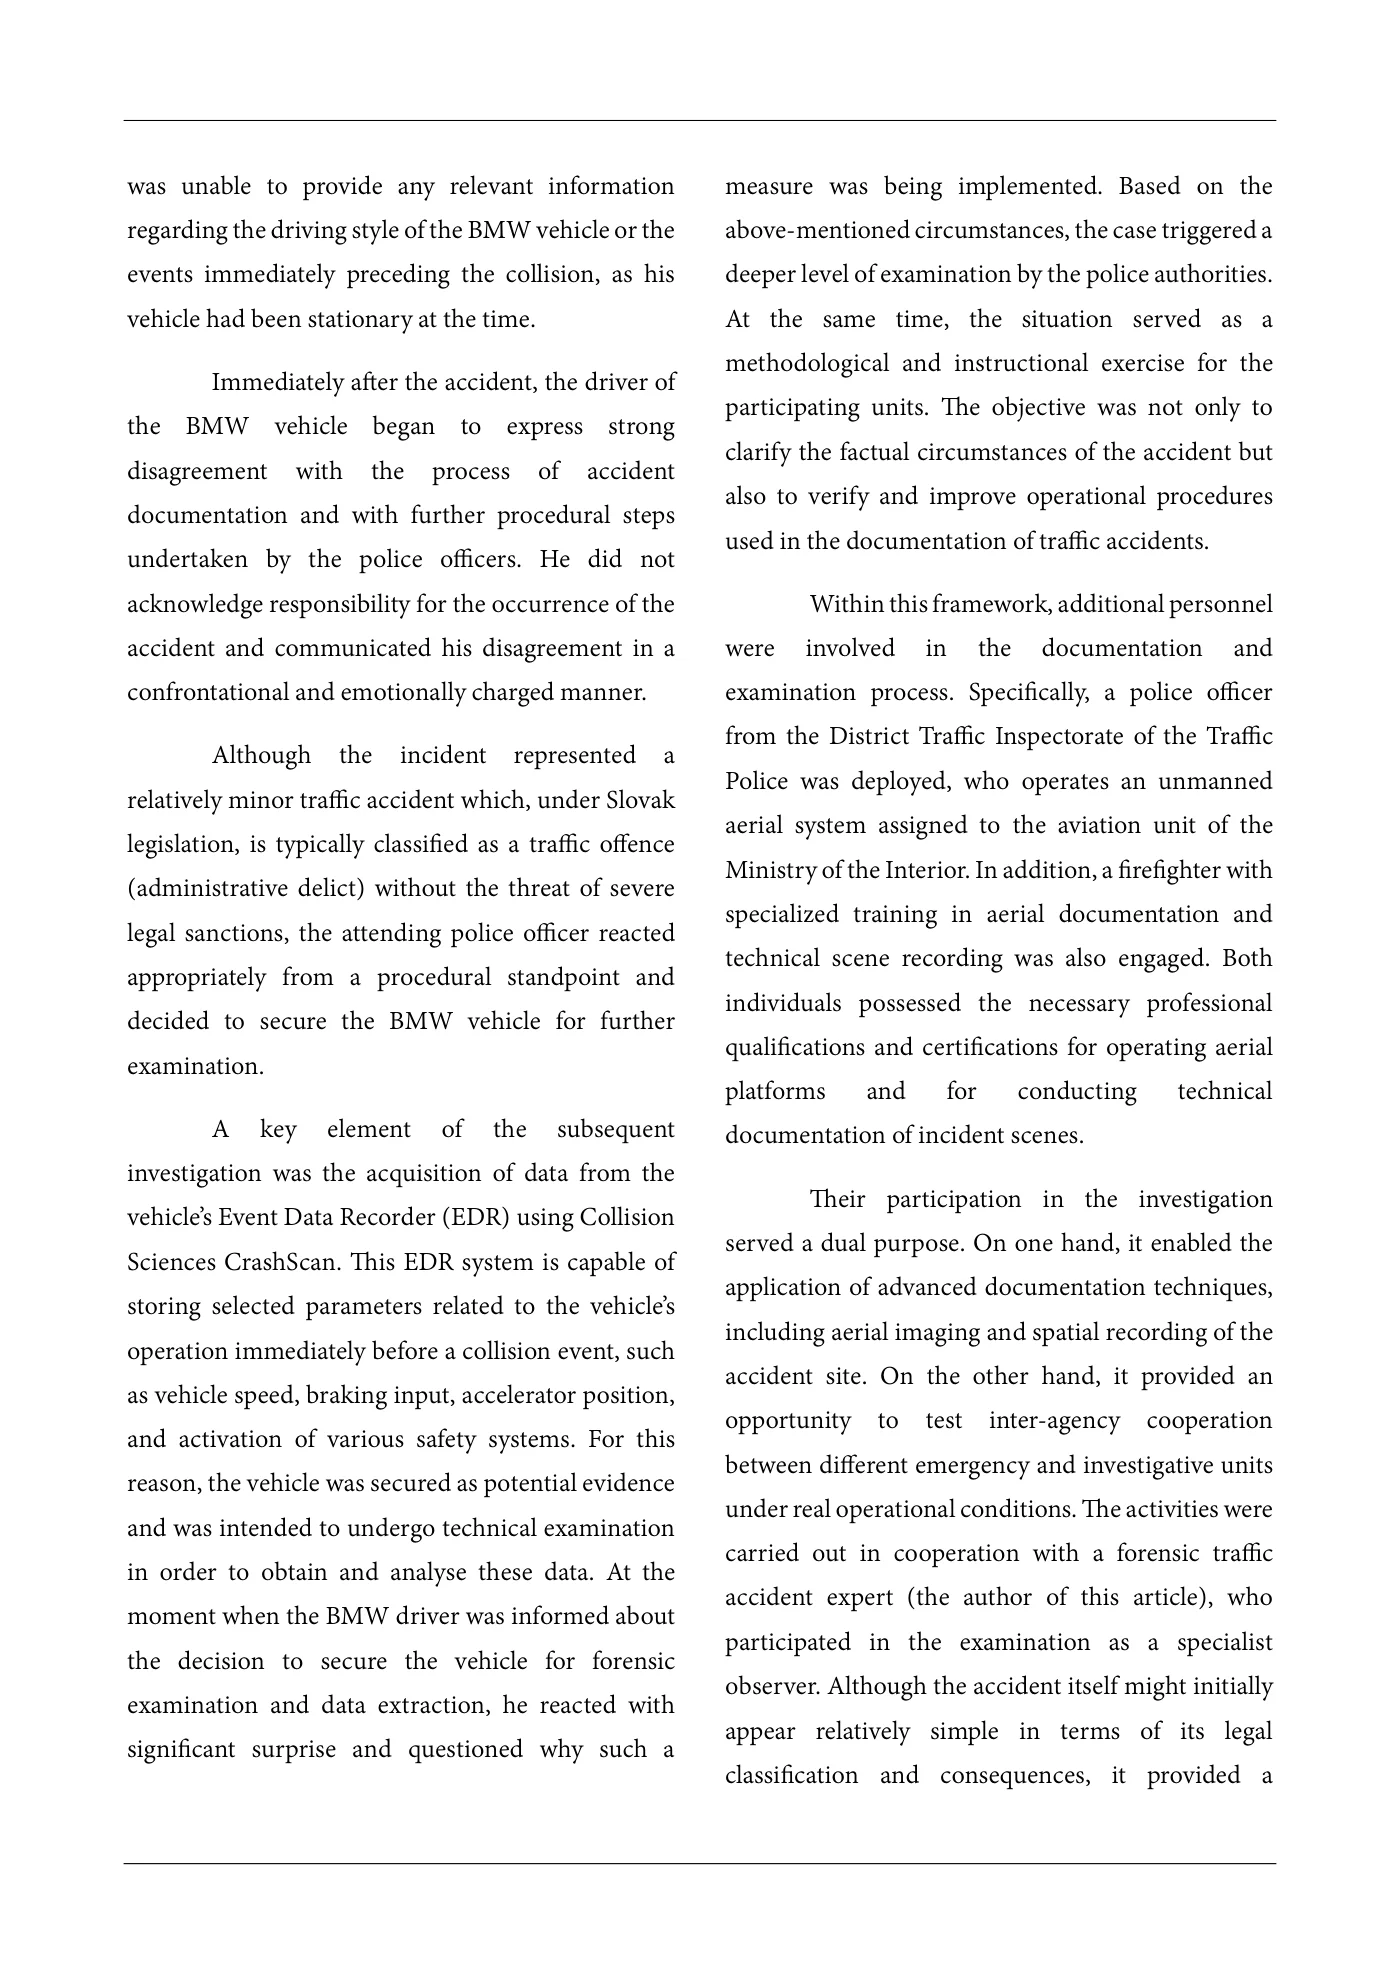
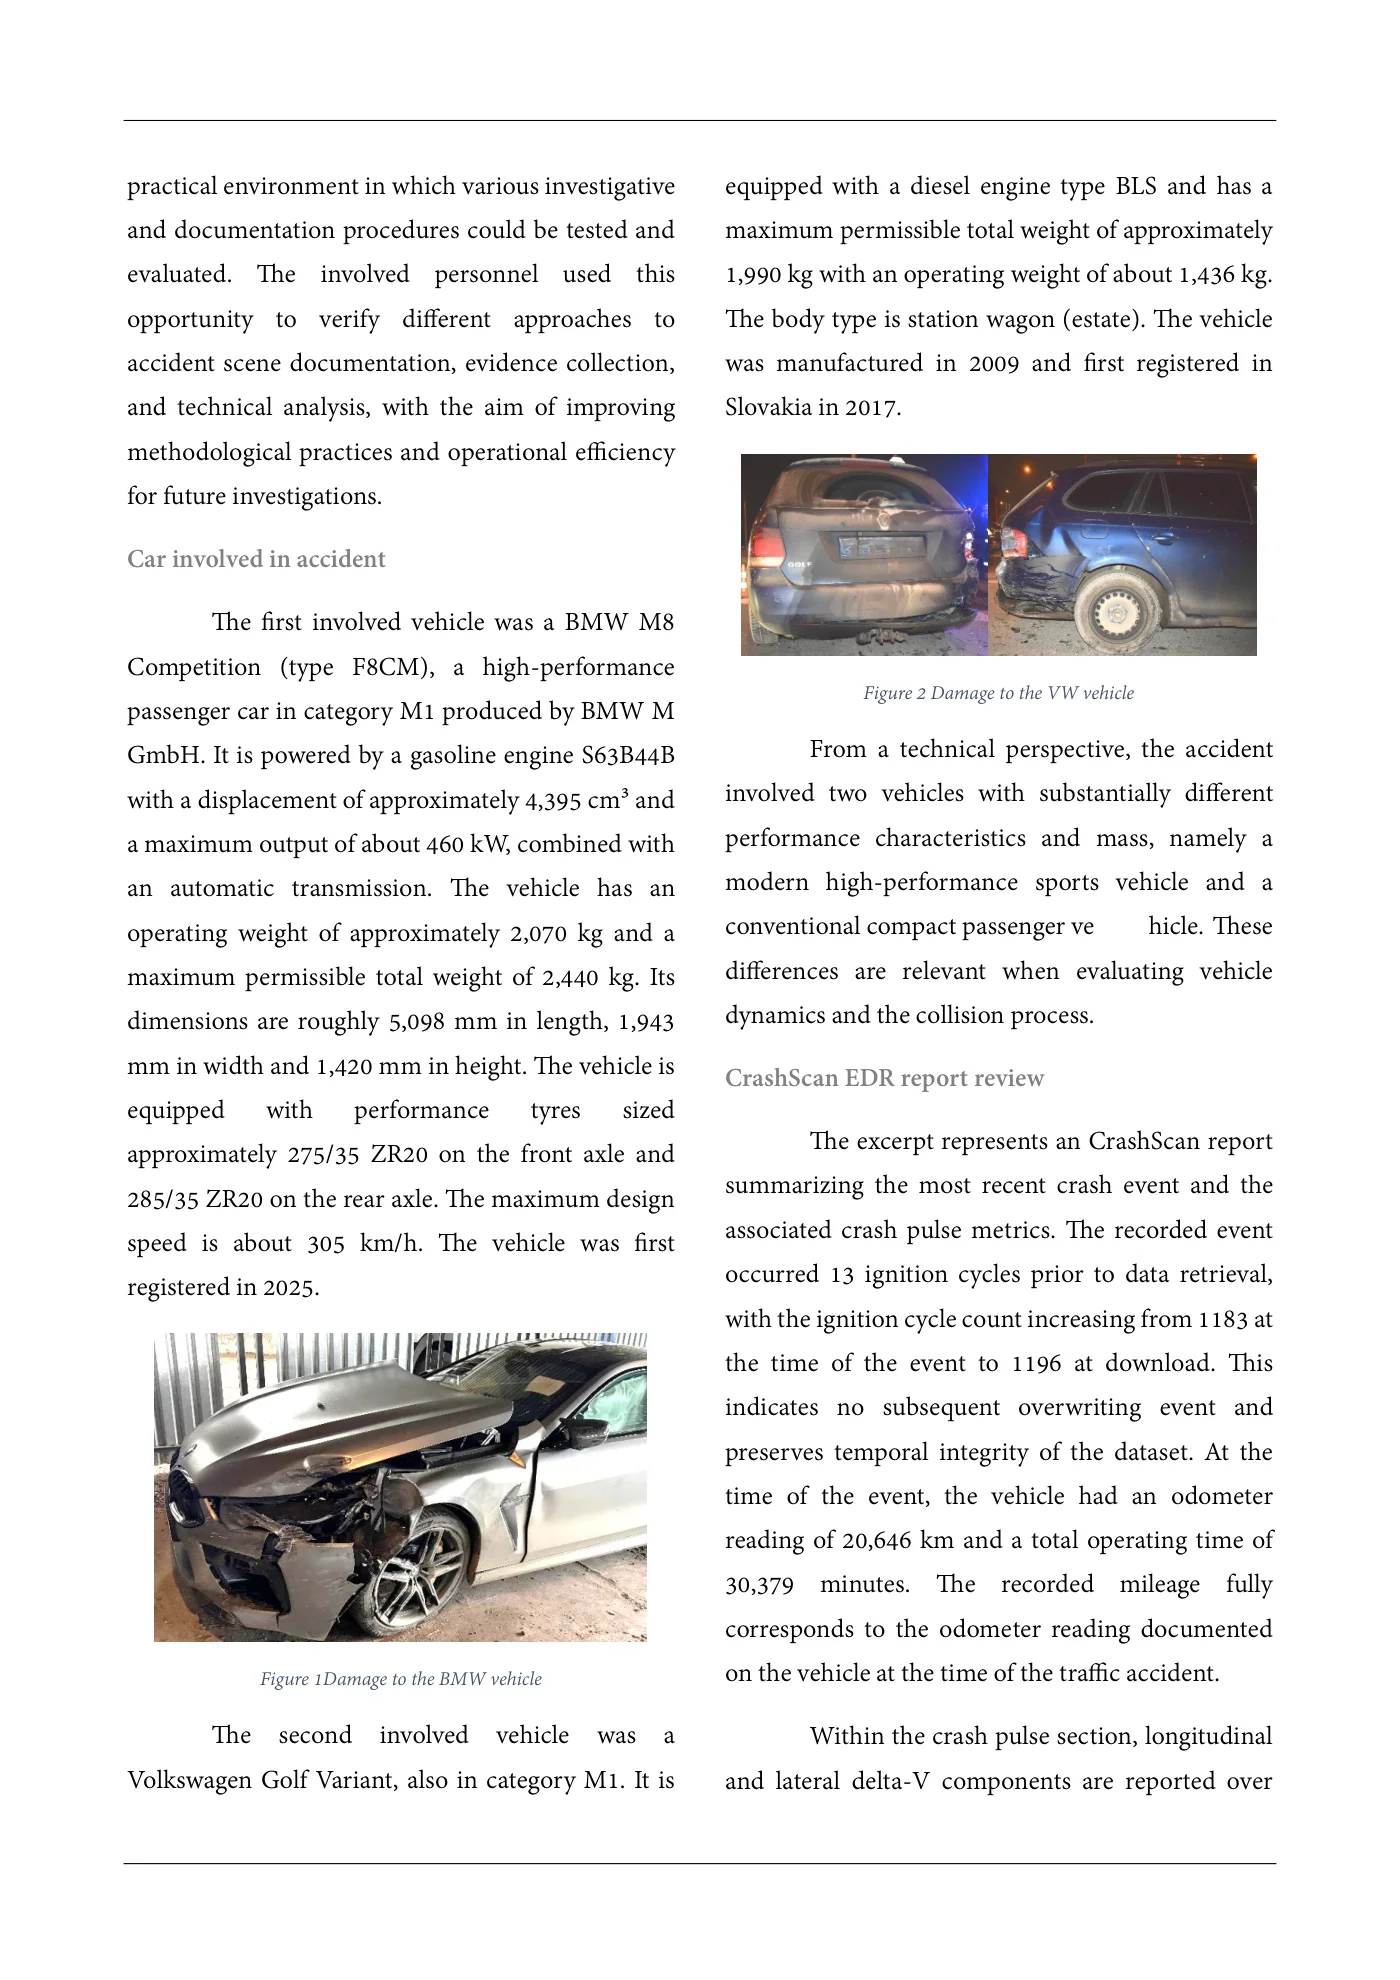
practical environment in which various investigative equipped with a diesel engine type BLS and has a and documentation procedures could be tested and maximum permissible total weight of approximately evaluated. The involved personnel used this 1,990 kg with an operating weight of about 1,436 kg. opportunity to verify different approaches to The body type is station wagon (estate). The vehicle accident scene documentation, evidence collection, was manufactured in 2009 and first registered in and technical analysis, with the aim of improving Slovakia in 2017. methodological practices and operational efficiency for future investigations. Car involved in accident The first involved vehicle was a BMW M8 Competition (type F8CM), a high-performance Figure 2 Damage to the VW vehicle passenger car in category M1 produced by BMW M GmbH. It is powered by a gasoline engine S63B44B From a technical perspective, the accident with a displacement of approximately 4,395 cm³ and involved two vehicles with substantially different a maximum output of about 460 kW, combined with performance characteristics and mass, namely a an automatic transmission. The vehicle has an modern high-performance sports vehicle and a operating weight of approximately 2,070 kg and a conventional compact passenger ve hicle. These maximum permissible total weight of 2,440 kg. Its differences are relevant when evaluating vehicle dimensions are roughly 5,098 mm in length, 1,943 dynamics and the collision process. mm in width and 1,420 mm in height. The vehicle is CrashScan EDR report review equipped with performance tyres sized The excerpt represents an CrashScan reportapproximately 275/35 ZR20 on the front axle and summarizing the most recent crash event and the285/35 ZR20 on the rear axle. The maximum design associated crash pulse metrics. The recorded eventspeed is about 305 km/h. The vehicle was first occurred 13 ignition cycles prior to data retrieval,registered in 2025. with the ignition cycle count increasing from 1183 at the time of the event to 1196 at download. This indicates no subsequent overwriting event and preserves temporal integrity of the dataset. At the time of the event, the vehicle had an odometer reading of 20,646 km and a total operating time of 30,379 minutes. The recorded mileage fully corresponds to the odometer reading documented Figure 1Damage to the BMW vehicle on the vehicle at the time of the traffic accident. The second involved vehicle was a Within the crash pulse section, longitudinal Volkswagen Golf Variant, also in category M1. It is and lateral delta-V components are reported over
Source page 4
Read page 4 extracted text
Extracted text may not preserve table columns. Refer to the page image or original PDF for data relationships.
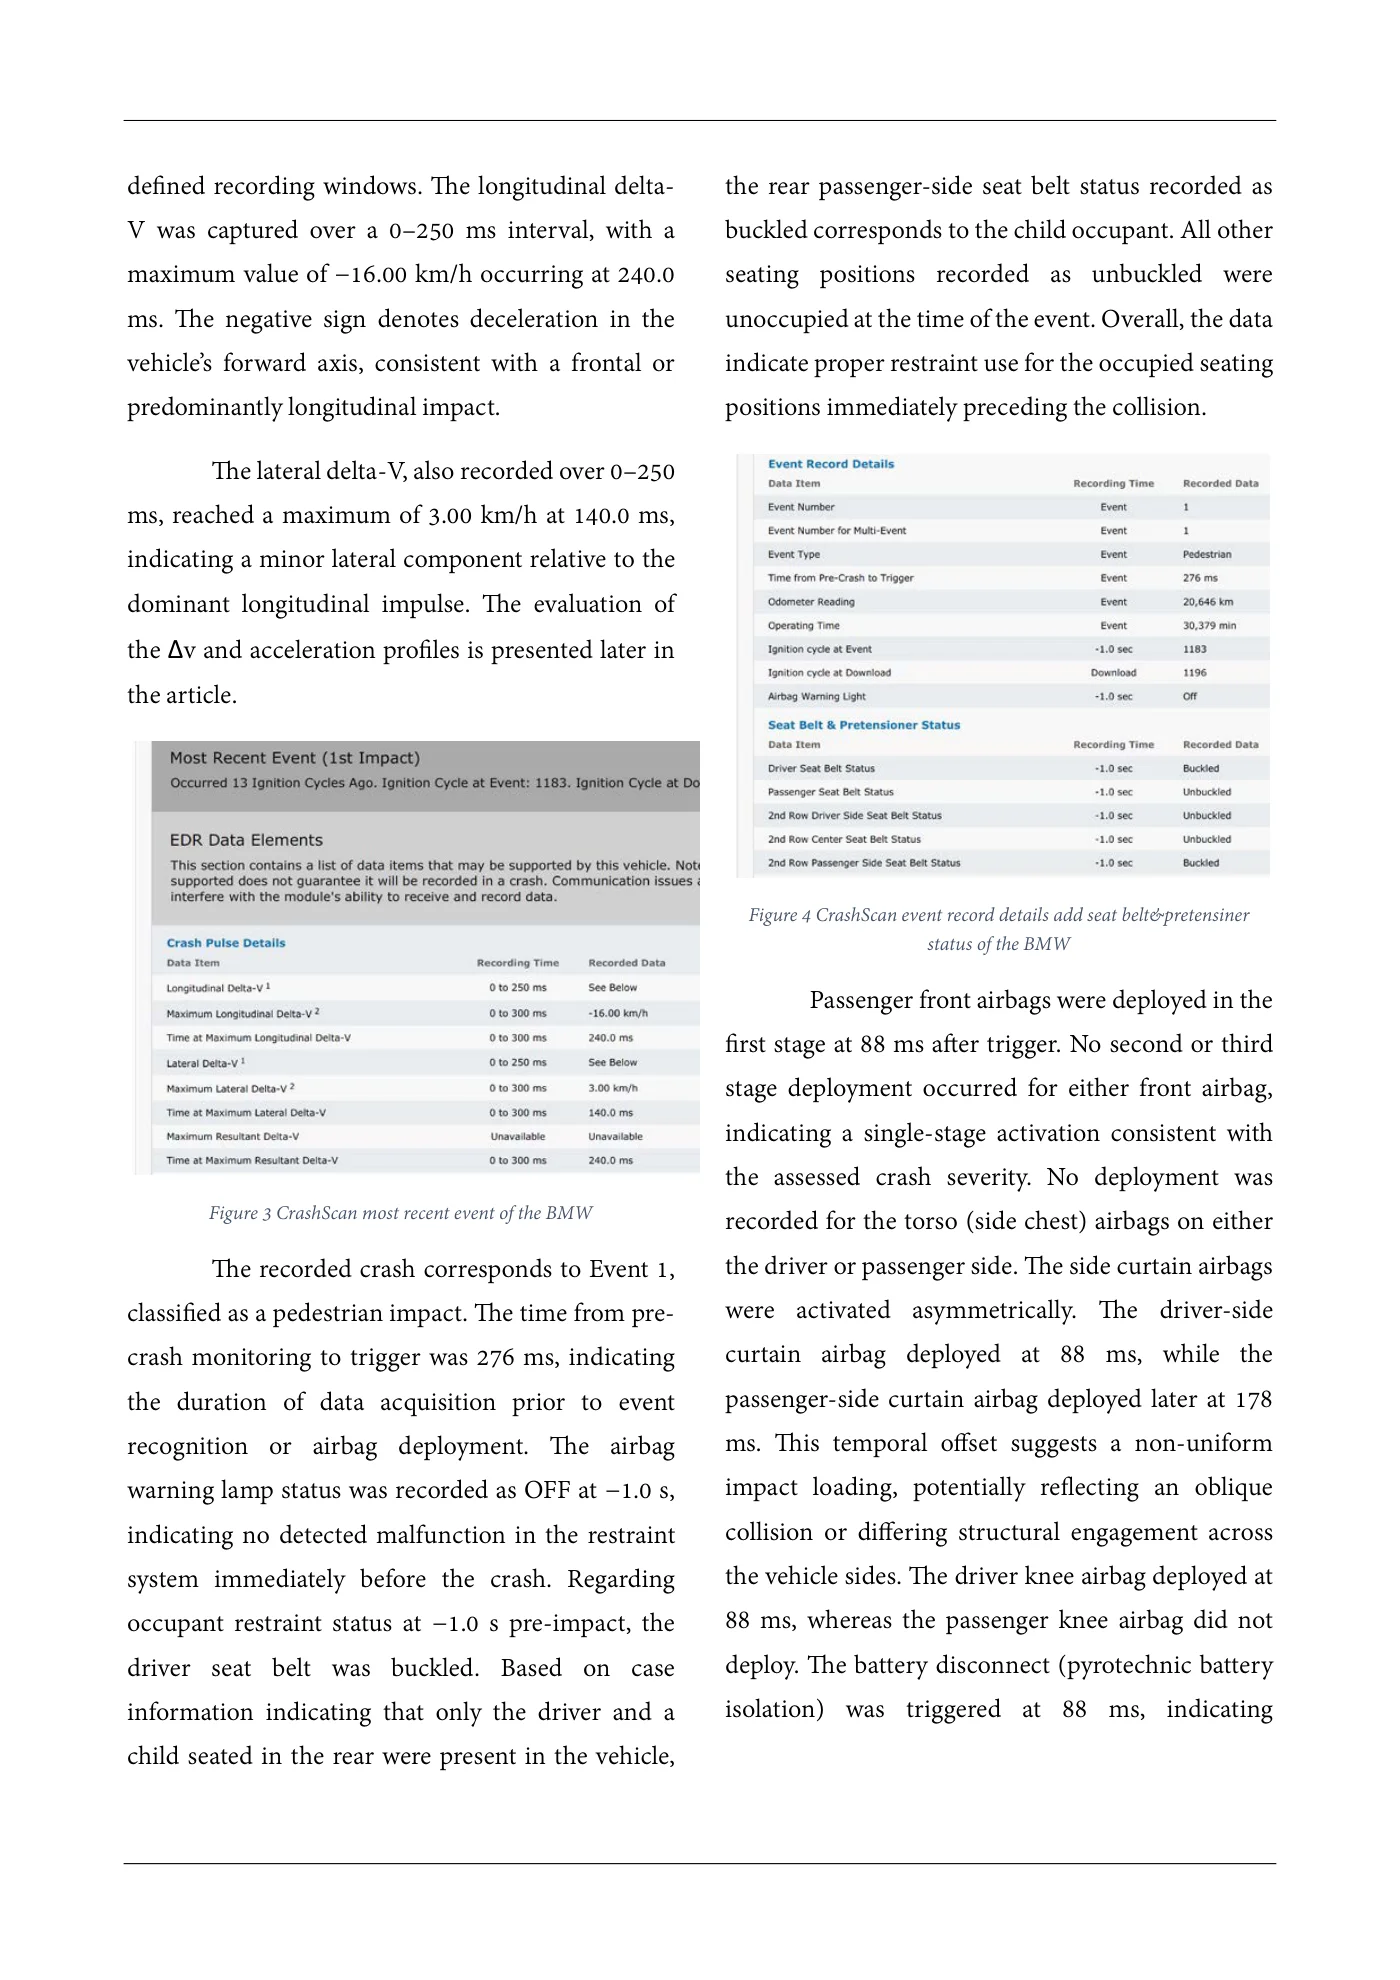
defined recording windows. The longitudinal delta- the rear passenger-side seat belt status recorded as V was captured over a 0–250 ms interval, with a buckled corresponds to the child occupant. All other maximum value of −16.00 km/h occurring at 240.0 seating positions recorded as unbuckled were ms. The negative sign denotes deceleration in the unoccupied at the time of the event. Overall, the data vehicle’s forward axis, consistent with a frontal or indicate proper restraint use for the occupied seating predominantly longitudinal impact. positions immediately preceding the collision. The lateral delta-V, also recorded over 0–250 ms, reached a maximum of 3.00 km/h at 140.0 ms, indicating a minor lateral component relative to the dominant longitudinal impulse. The evaluation of the Δv and acceleration profiles is presented later in the article. Figure 4 CrashScan event record details add seat belt&pretensiner status of the BMW Passenger front airbags were deployed in the first stage at 88 ms after trigger. No second or third stage deployment occurred for either front airbag, indicating a single-stage activation consistent with the assessed crash severity. No deployment was Figure 3 CrashScan most recent event of the BMW recorded for the torso (side chest) airbags on either The recorded crash corresponds to Event 1, the driver or passenger side. The side curtain airbags classified as a pedestrian impact. The time from pre- were activated asymmetrically. The driver-side crash monitoring to trigger was 276 ms, indicating curtain airbag deployed at 88 ms, while the the duration of data acquisition prior to event passenger-side curtain airbag deployed later at 178 recognition or airbag deployment. The airbag ms. This temporal offset suggests a non-uniform warning lamp status was recorded as OFF at −1.0 s, impact loading, potentially reflecting an oblique indicating no detected malfunction in the restraint collision or differing structural engagement across system immediately before the crash. Regarding the vehicle sides. The driver knee airbag deployed at occupant restraint status at −1.0 s pre-impact, the 88 ms, whereas the passenger knee airbag did not driver seat belt was buckled. Based on case deploy. The battery disconnect (pyrotechnic battery information indicating that only the driver and a isolation) was triggered at 88 ms, indicating child seated in the rear were present in the vehicle,
Source page 5
Read page 5 extracted text
Extracted text may not preserve table columns. Refer to the page image or original PDF for data relationships.
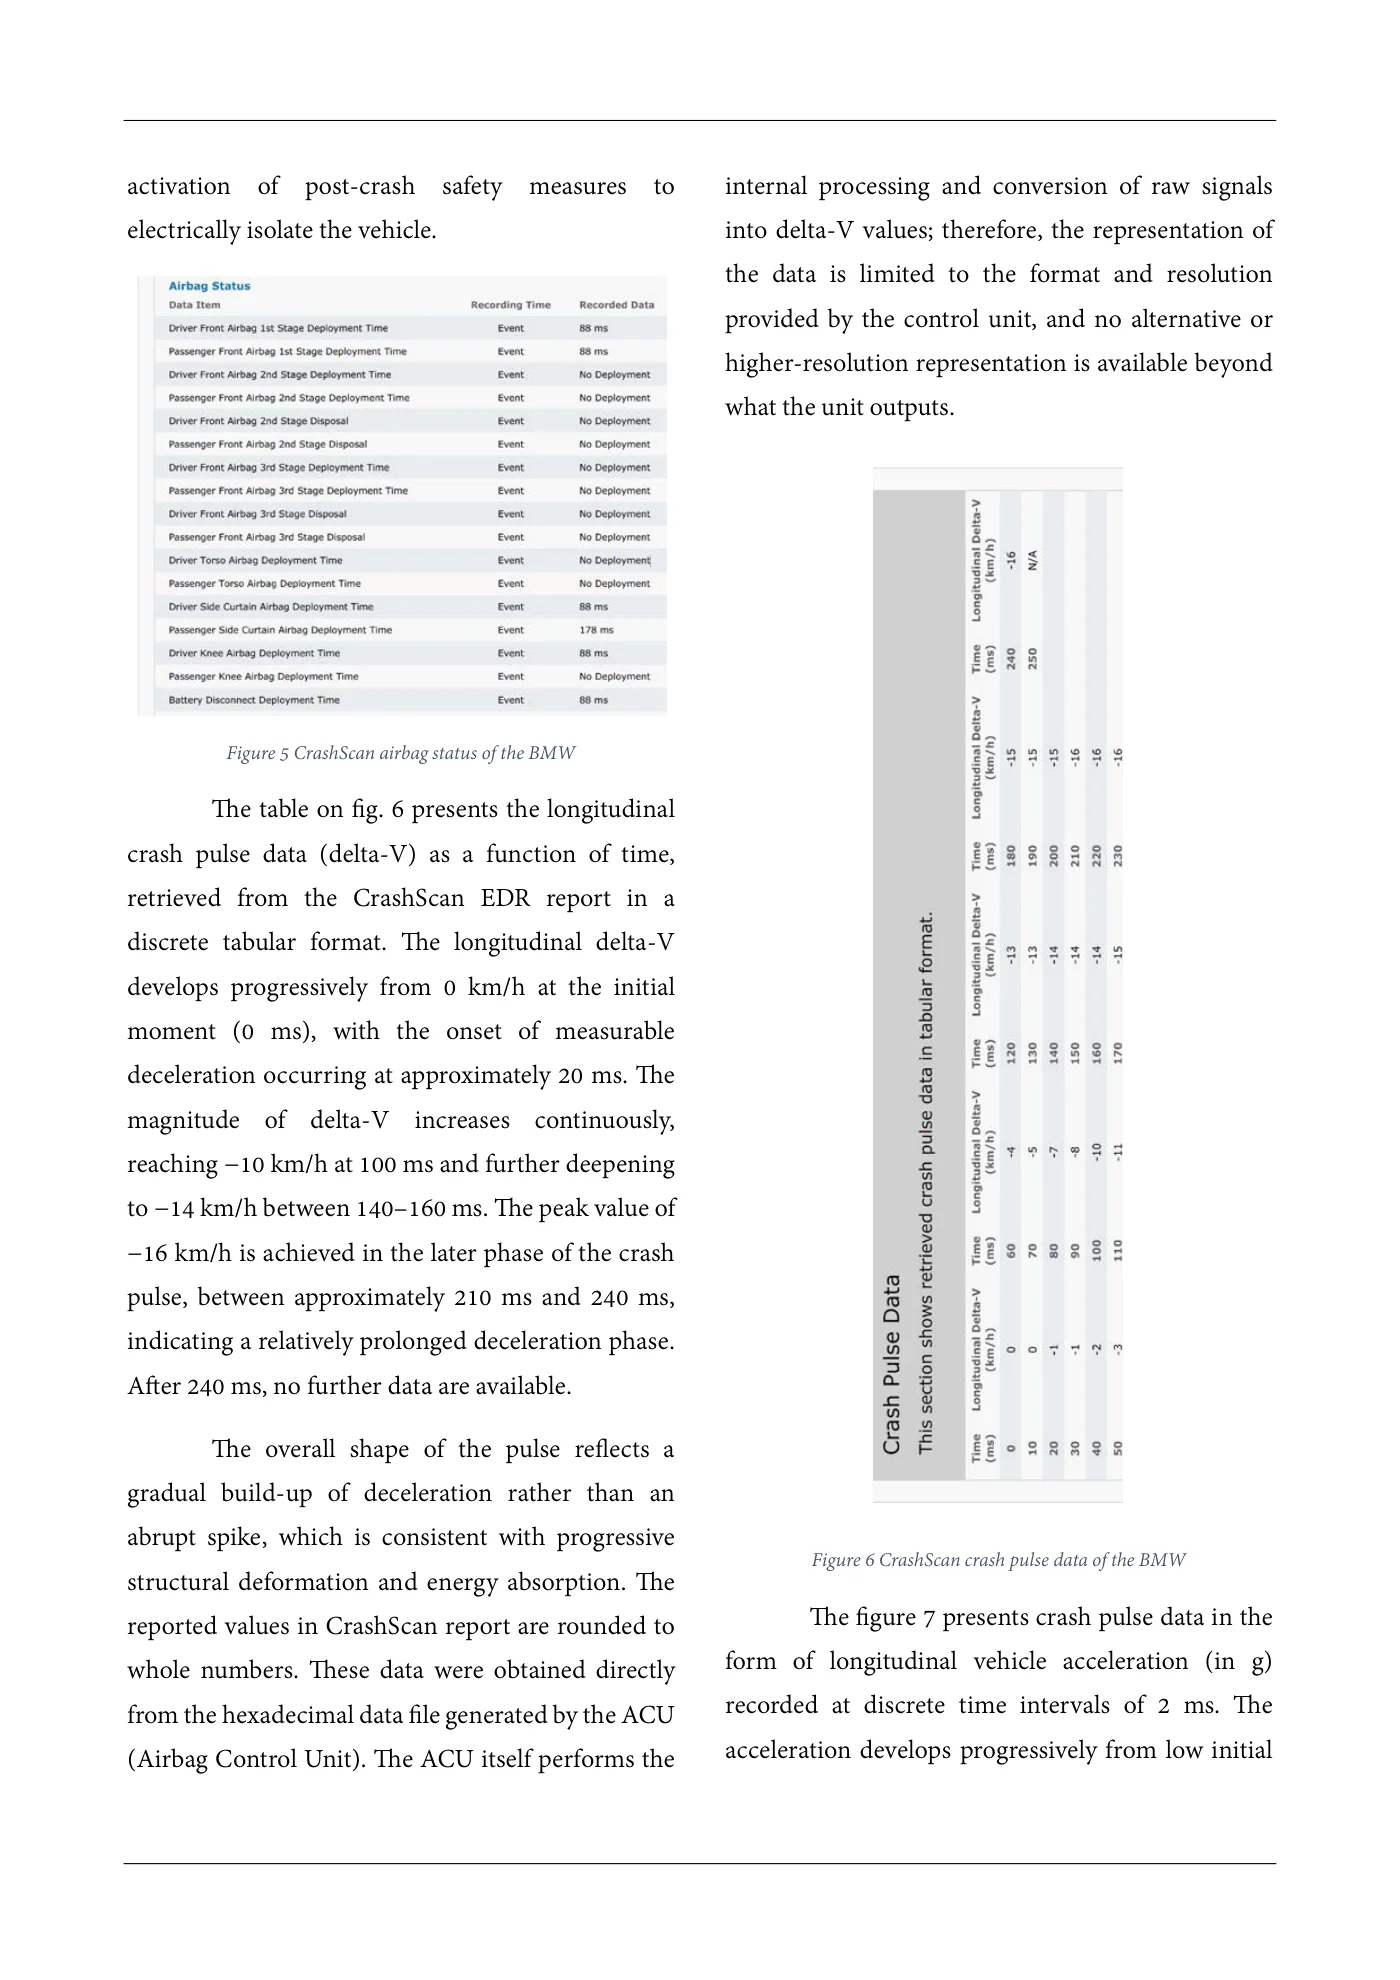
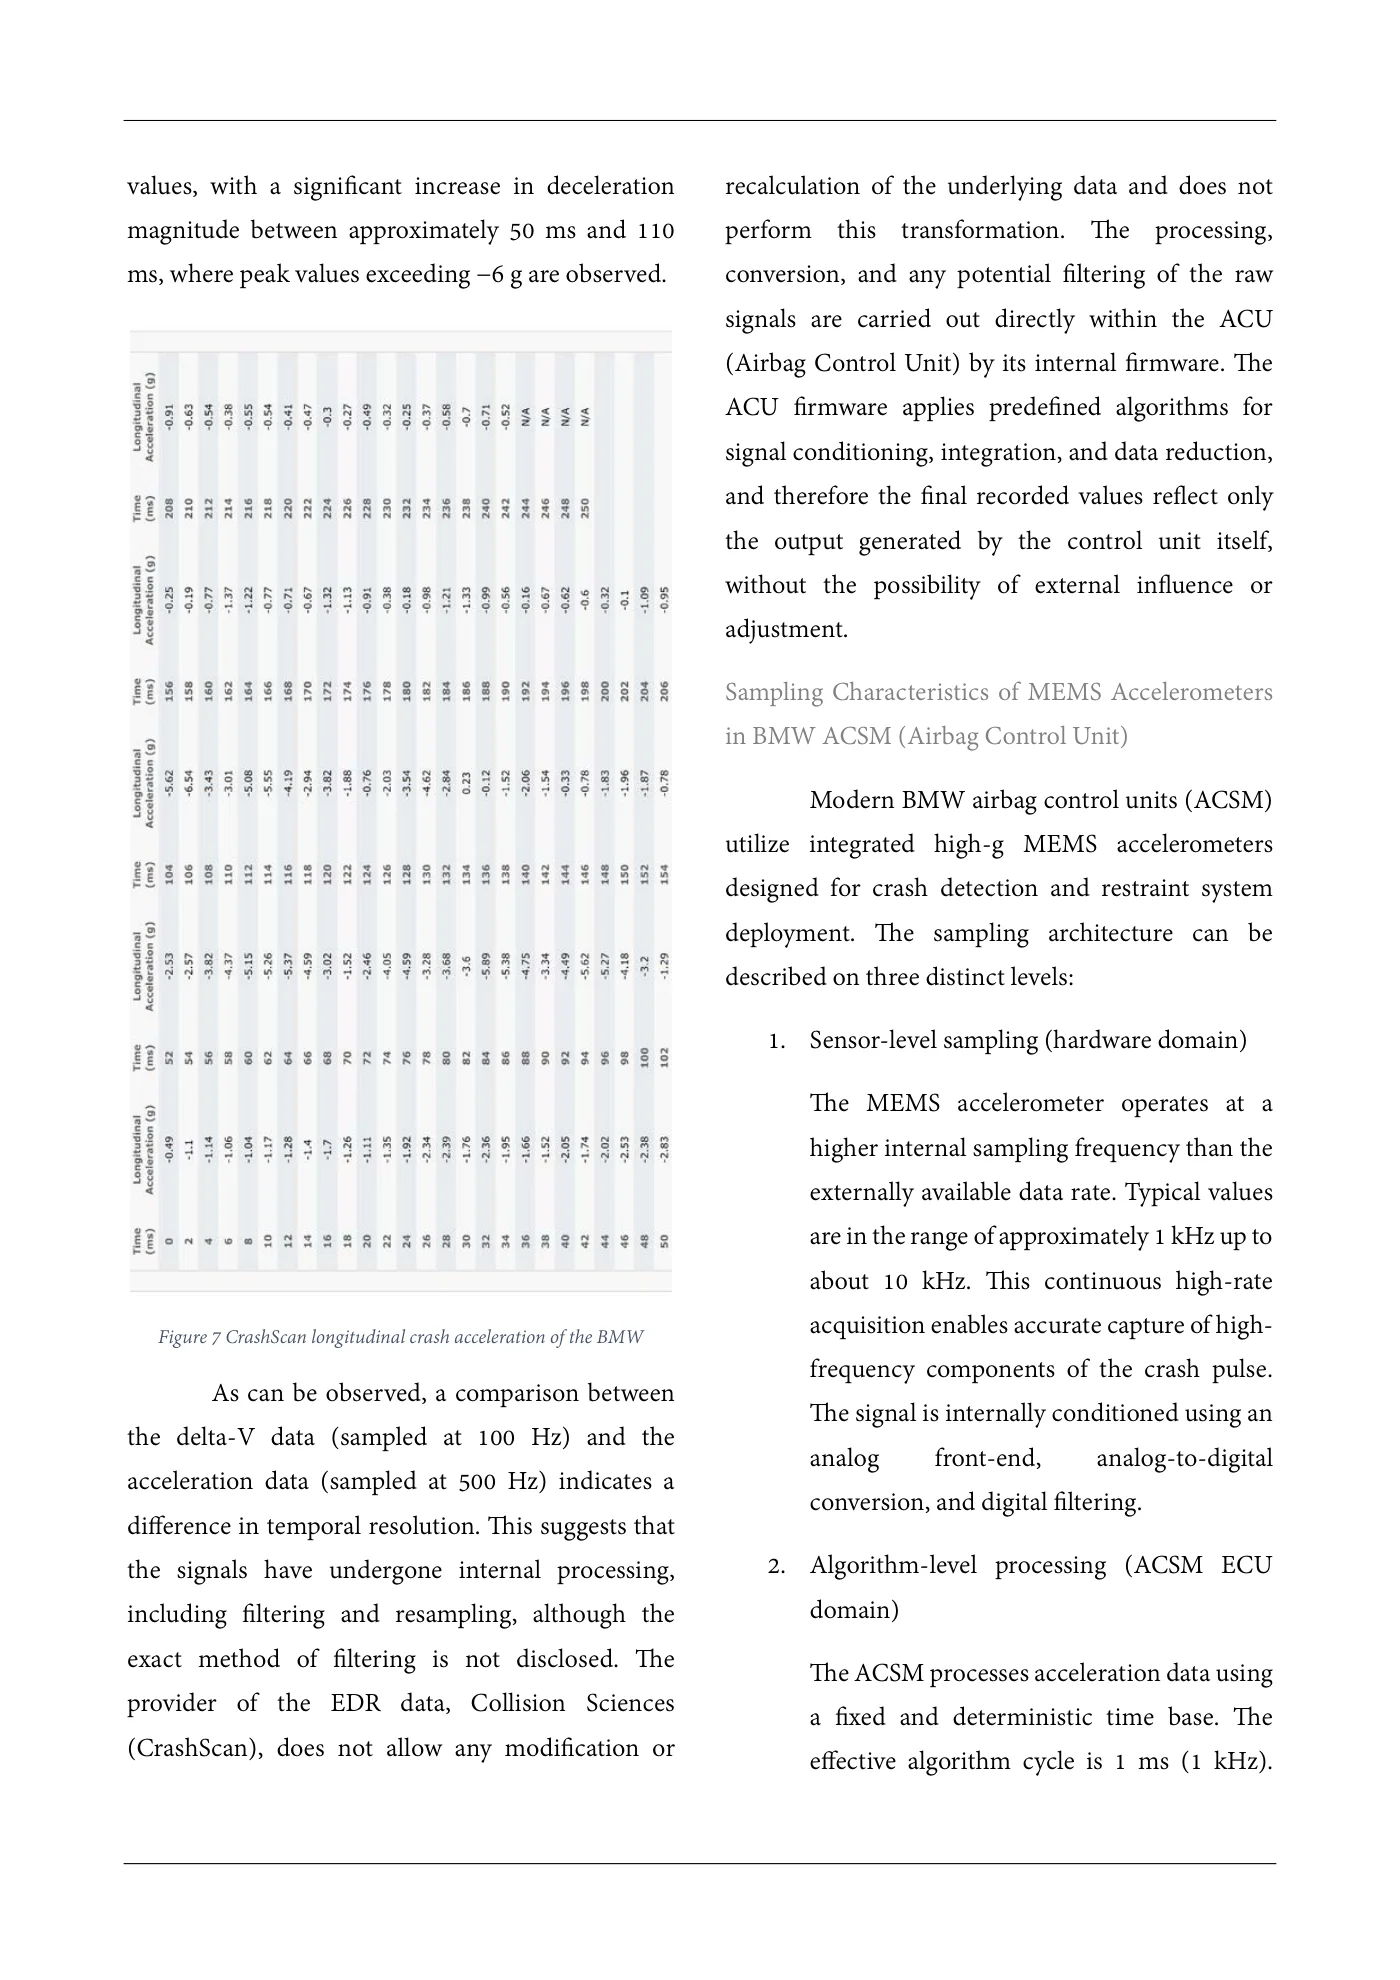
activation of post-crash safety measures to internal processing and conversion of raw signals electrically isolate the vehicle. into delta-V values; therefore, the representation of the data is limited to the format and resolution provided by the control unit, and no alternative or higher-resolution representation is available beyond what the unit outputs. Figure 5 CrashScan airbag status of the BMW The table on fig. 6 presents the longitudinal crash pulse data (delta-V) as a function of time, retrieved from the CrashScan EDR report in a discrete tabular format. The longitudinal delta-V develops progressively from 0 km/h at the initial moment (0 ms), with the onset of measurable deceleration occurring at approximately 20 ms. The magnitude of delta-V increases continuously, reaching −10 km/h at 100 ms and further deepening to −14 km/h between 140–160 ms. The peak value of −16 km/h is achieved in the later phase of the crash pulse, between approximately 210 ms and 240 ms, indicating a relatively prolonged deceleration phase. After 240 ms, no further data are available. The overall shape of the pulse reflects a gradual build-up of deceleration rather than an abrupt spike, which is consistent with progressive Figure 6 CrashScan crash pulse data of the BMW structural deformation and energy absorption. The The figure 7 presents crash pulse data in thereported values in CrashScan report are rounded to form of longitudinal vehicle acceleration (in g)whole numbers. These data were obtained directly recorded at discrete time intervals of 2 ms. Thefrom the hexadecimal data file generated by the ACU acceleration develops progressively from low initial(Airbag Control Unit). The ACU itself performs the
Source page 6
Read page 6 extracted text
Extracted text may not preserve table columns. Refer to the page image or original PDF for data relationships.
values, with a significant increase in deceleration recalculation of the underlying data and does not magnitude between approximately 50 ms and 110 perform this transformation. The processing, ms, where peak values exceeding −6 g are observed. conversion, and any potential filtering of the raw signals are carried out directly within the ACU (Airbag Control Unit) by its internal firmware. The ACU firmware applies predefined algorithms for signal conditioning, integration, and data reduction, and therefore the final recorded values reflect only the output generated by the control unit itself, without the possibility of external influence or adjustment. Sampling Characteristics of MEMS Accelerometers in BMW ACSM (Airbag Control Unit) Modern BMW airbag control units (ACSM) utilize integrated high-g MEMS accelerometers designed for crash detection and restraint system deployment. The sampling architecture can be described on three distinct levels: 1. Sensor-level sampling (hardware domain) The MEMS accelerometer operates at a higher internal sampling frequency than the externally available data rate. Typical values are in the range of approximately 1 kHz up to about 10 kHz. This continuous high-rate Figure 7 CrashScan longitudinal crash acceleration of the BMW acquisition enables accurate capture of high- frequency components of the crash pulse. As can be observed, a comparison between The signal is internally conditioned using an the delta-V data (sampled at 100 Hz) and the analog front-end, analog-to-digital acceleration data (sampled at 500 Hz) indicates a conversion, and digital filtering. difference in temporal resolution. This suggests that the signals have undergone internal processing, 2. Algorithm-level processing (ACSM ECU including filtering and resampling, although the domain) exact method of filtering is not disclosed. The The ACSM processes acceleration data using provider of the EDR data, Collision Sciences a fixed and deterministic time base. The (CrashScan), does not allow any modification or effective algorithm cycle is 1 ms (1 kHz).
Source page 7
Read page 7 extracted text
Extracted text may not preserve table columns. Refer to the page image or original PDF for data relationships.
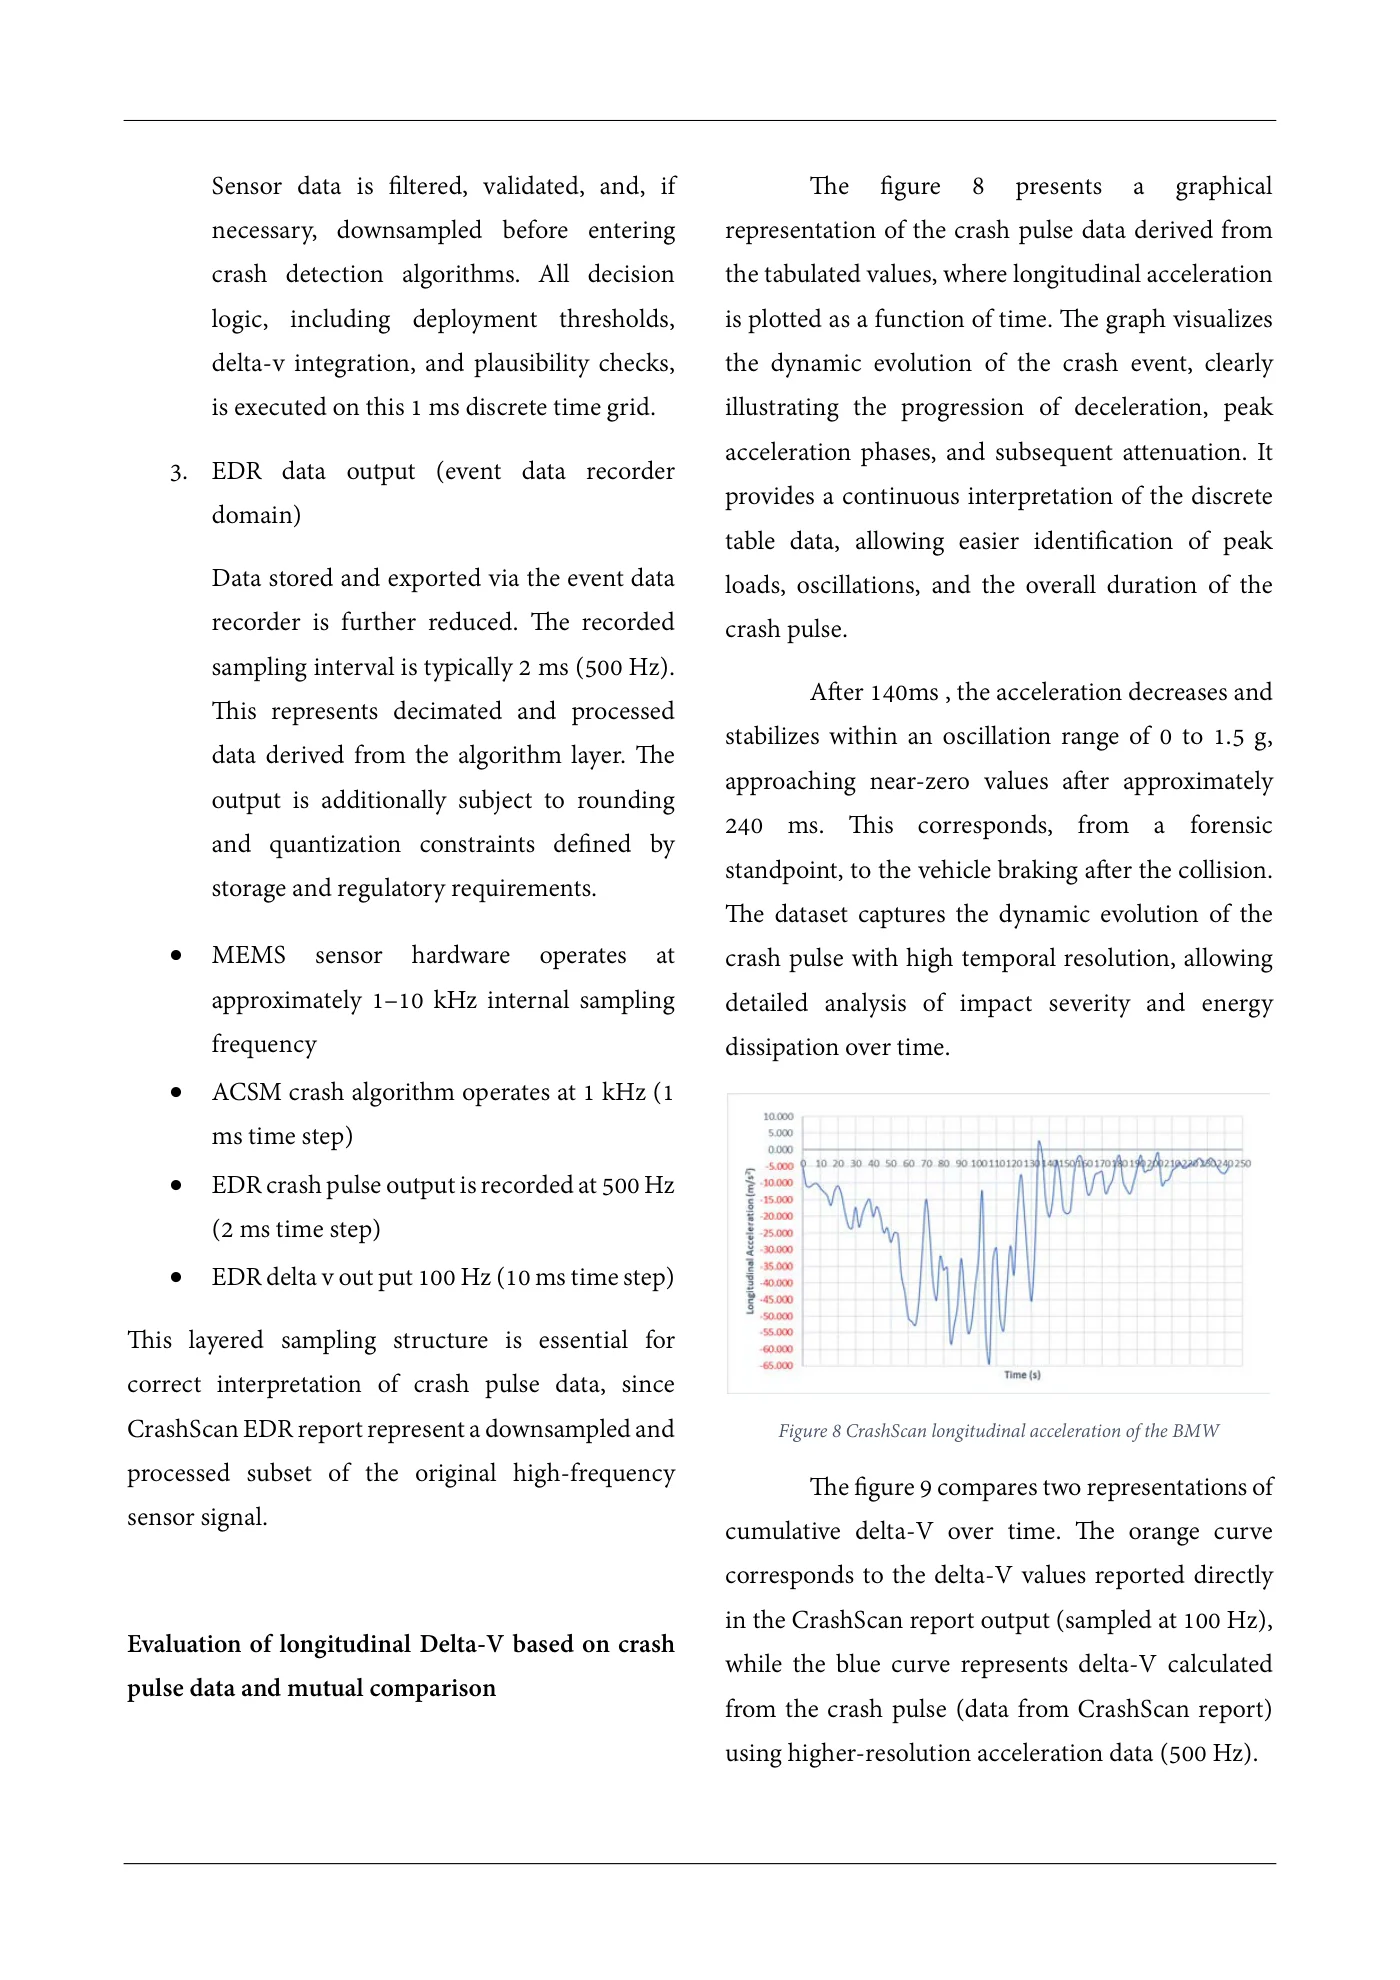
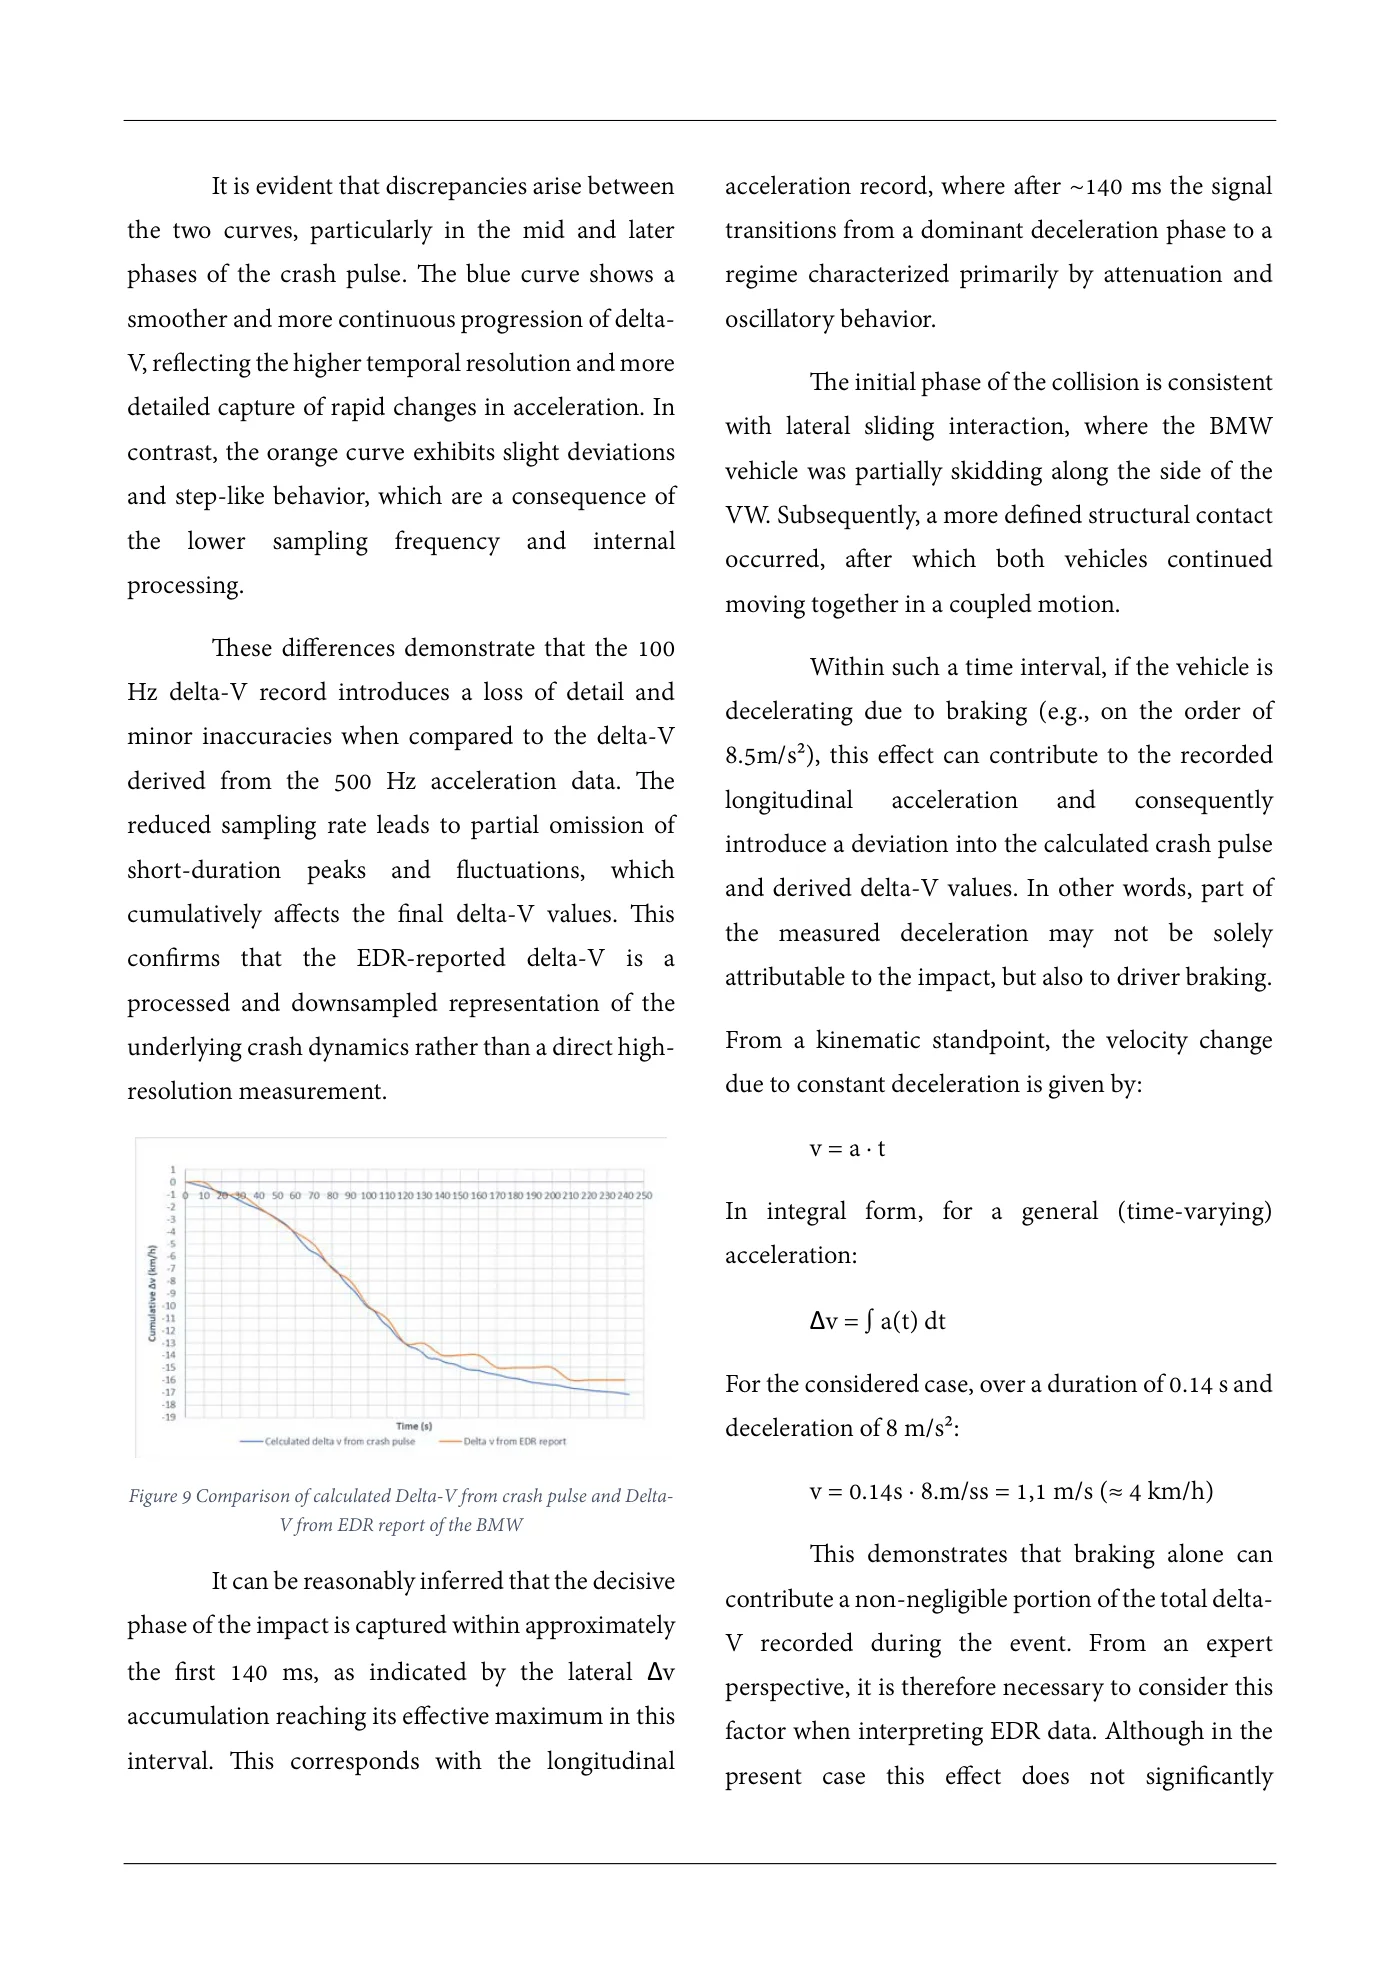
Sensor data is filtered, validated, and, if The figure 8 presents a graphical necessary, downsampled before entering representation of the crash pulse data derived from crash detection algorithms. All decision the tabulated values, where longitudinal acceleration logic, including deployment thresholds, is plotted as a function of time. The graph visualizes delta-v integration, and plausibility checks, the dynamic evolution of the crash event, clearly is executed on this 1 ms discrete time grid. illustrating the progression of deceleration, peak acceleration phases, and subsequent attenuation. It 3. EDR data output (event data recorder provides a continuous interpretation of the discrete domain) table data, allowing easier identification of peak Data stored and exported via the event data loads, oscillations, and the overall duration of the recorder is further reduced. The recorded crash pulse. sampling interval is typically 2 ms (500 Hz). After 140ms , the acceleration decreases and This represents decimated and processed stabilizes within an oscillation range of 0 to 1.5 g, data derived from the algorithm layer. The approaching near-zero values after approximately output is additionally subject to rounding 240 ms. This corresponds, from a forensic and quantization constraints defined by standpoint, to the vehicle braking after the collision. storage and regulatory requirements. The dataset captures the dynamic evolution of the • MEMS sensor hardware operates at crash pulse with high temporal resolution, allowing approximately 1–10 kHz internal sampling detailed analysis of impact severity and energy frequency dissipation over time. • ACSM crash algorithm operates at 1 kHz (1 ms time step) • EDR crash pulse output is recorded at 500 Hz (2 ms time step) • EDR delta v out put 100 Hz (10 ms time step) This layered sampling structure is essential for correct interpretation of crash pulse data, since CrashScan EDR report represent a downsampled and Figure 8 CrashScan longitudinal acceleration of the BMW processed subset of the original high-frequency The figure 9 compares two representations of sensor signal. cumulative delta-V over time. The orange curve corresponds to the delta-V values reported directly in the CrashScan report output (sampled at 100 Hz), Evaluation of longitudinal Delta-V based on crash while the blue curve represents delta-V calculated pulse data and mutual comparison from the crash pulse (data from CrashScan report) using higher-resolution acceleration data (500 Hz).
Source page 8
Read page 8 extracted text
Extracted text may not preserve table columns. Refer to the page image or original PDF for data relationships.
It is evident that discrepancies arise between acceleration record, where after ~140 ms the signal the two curves, particularly in the mid and later transitions from a dominant deceleration phase to a phases of the crash pulse. The blue curve shows a regime characterized primarily by attenuation and smoother and more continuous progression of delta- oscillatory behavior. V, reflecting the higher temporal resolution and more The initial phase of the collision is consistent detailed capture of rapid changes in acceleration. In with lateral sliding interaction, where the BMW contrast, the orange curve exhibits slight deviations vehicle was partially skidding along the side of the and step-like behavior, which are a consequence of VW. Subsequently, a more defined structural contact the lower sampling frequency and internal occurred, after which both vehicles continued processing. moving together in a coupled motion. These differences demonstrate that the 100 Within such a time interval, if the vehicle is Hz delta-V record introduces a loss of detail and decelerating due to braking (e.g., on the order of minor inaccuracies when compared to the delta-V 8.5m/s²), this effect can contribute to the recorded derived from the 500 Hz acceleration data. The longitudinal acceleration and consequently reduced sampling rate leads to partial omission of introduce a deviation into the calculated crash pulse short-duration peaks and fluctuations, which and derived delta-V values. In other words, part of cumulatively affects the final delta-V values. This the measured deceleration may not be solely confirms that the EDR-reported delta-V is a attributable to the impact, but also to driver braking. processed and downsampled representation of the underlying crash dynamics rather than a direct high- From a kinematic standpoint, the velocity change resolution measurement. due to constant deceleration is given by: v = a · t In integral form, for a general (time-varying) acceleration: Δv = ∫ a(t) dt For the considered case, over a duration of 0.14 s and deceleration of 8 m/s²: Figure 9 Comparison of calculated Delta-V from crash pulse and Delta- v = 0.14s · 8.m/ss = 1,1 m/s (≈ 4 km/h) V from EDR report of the BMW This demonstrates that braking alone can It can be reasonably inferred that the decisive contribute a non-negligible portion of the total delta- phase of the impact is captured within approximately V recorded during the event. From an expert the first 140 ms, as indicated by the lateral Δv perspective, it is therefore necessary to consider this accumulation reaching its effective maximum in this factor when interpreting EDR data. Although in the interval. This corresponds with the longitudinal present case this effect does not significantly
Source page 9
Read page 9 extracted text
Extracted text may not preserve table columns. Refer to the page image or original PDF for data relationships.
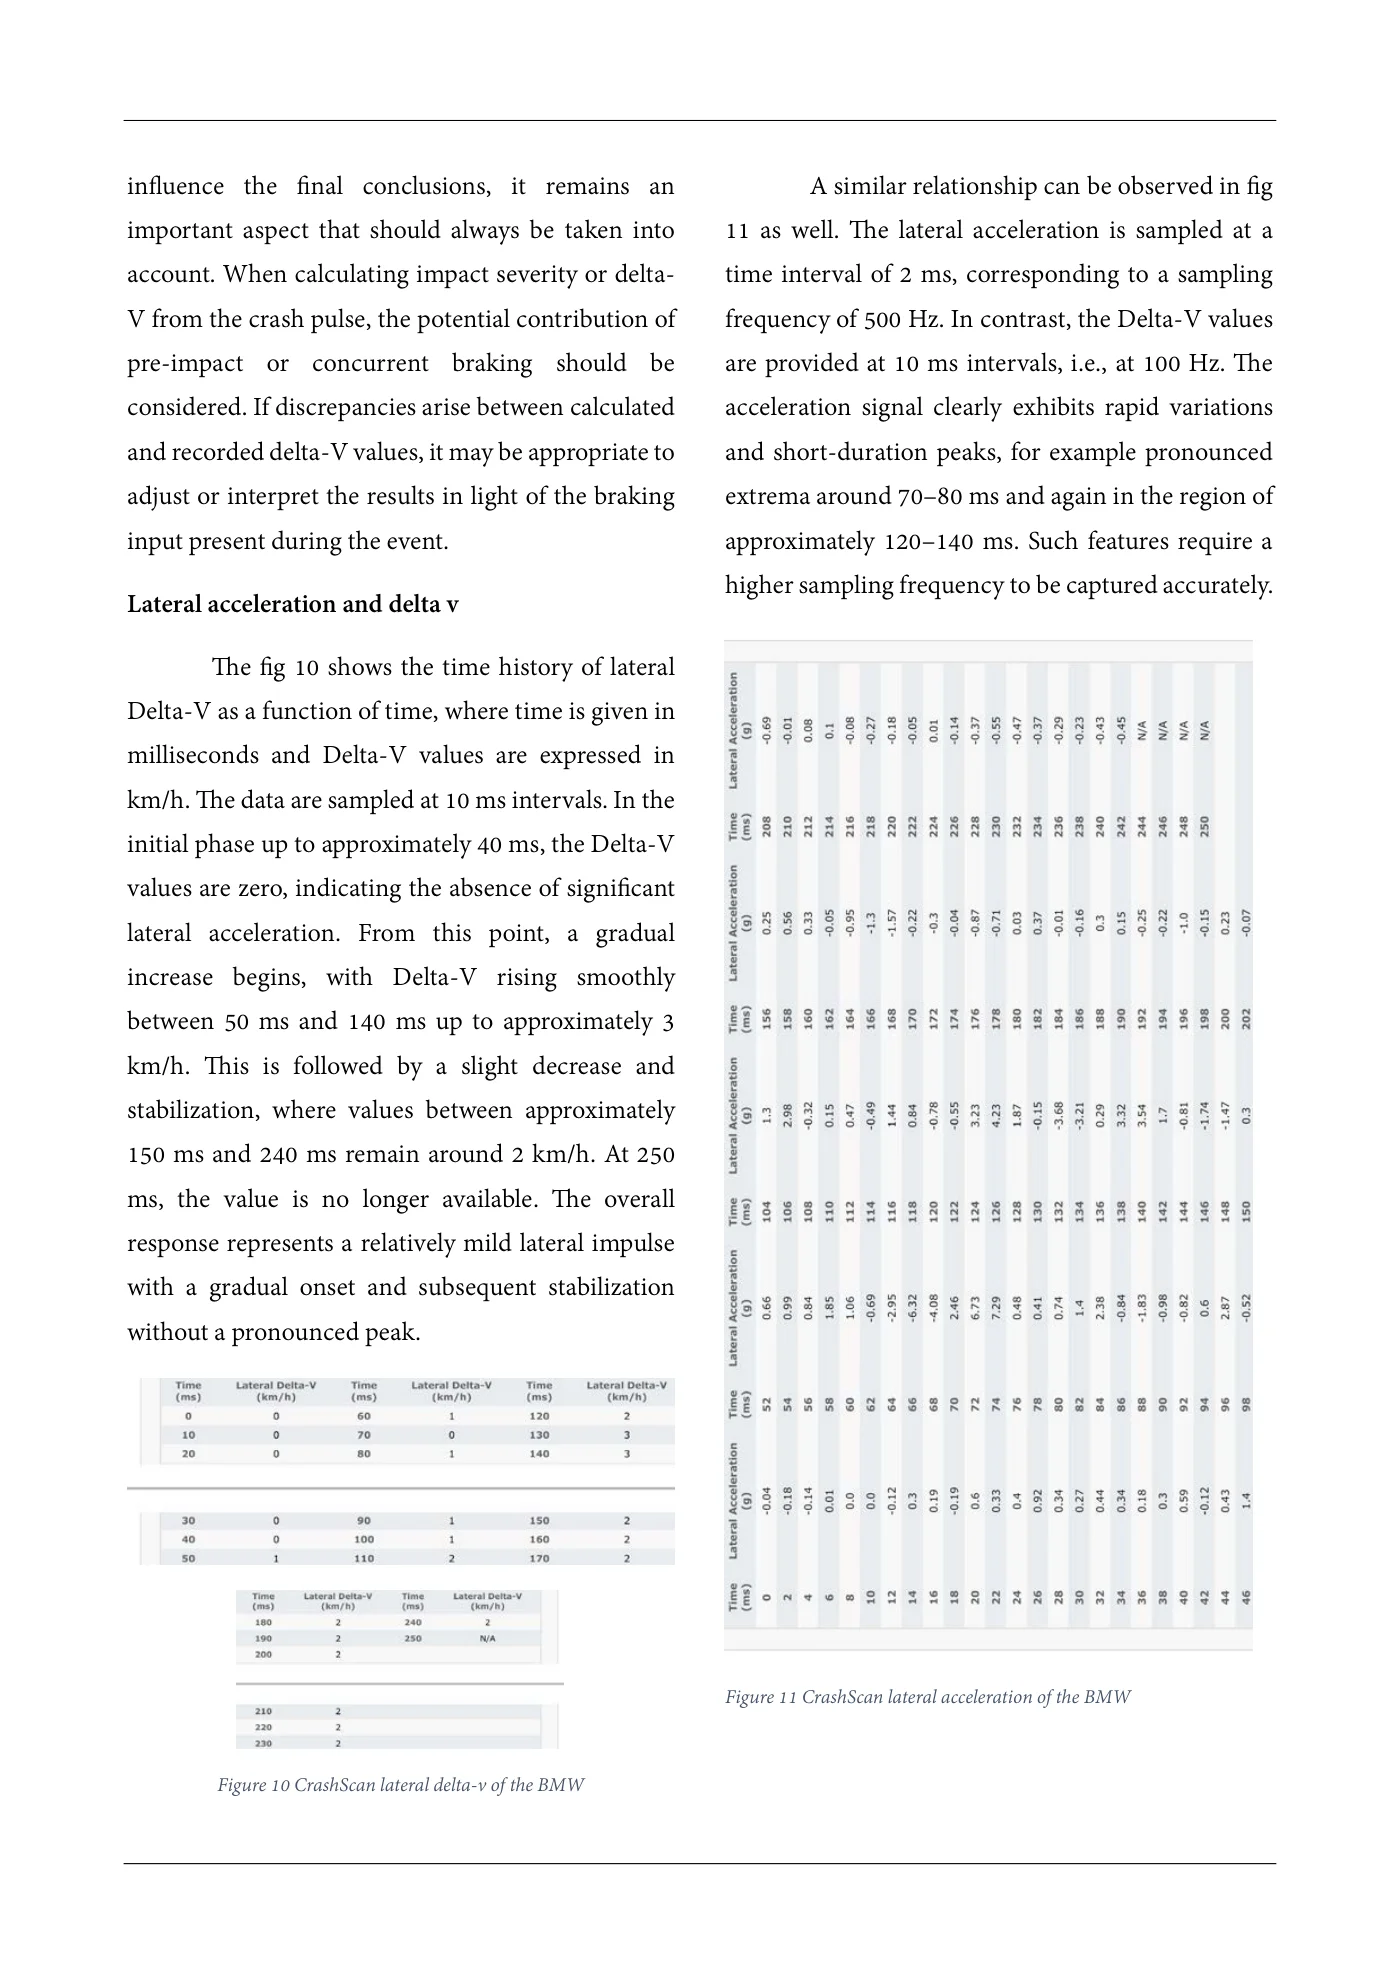
influence the final conclusions, it remains an A similar relationship can be observed in fig important aspect that should always be taken into 11 as well. The lateral acceleration is sampled at a account. When calculating impact severity or delta- time interval of 2 ms, corresponding to a sampling V from the crash pulse, the potential contribution of frequency of 500 Hz. In contrast, the Delta-V values pre-impact or concurrent braking should be are provided at 10 ms intervals, i.e., at 100 Hz. The considered. If discrepancies arise between calculated acceleration signal clearly exhibits rapid variations and recorded delta-V values, it may be appropriate to and short-duration peaks, for example pronounced adjust or interpret the results in light of the braking extrema around 70–80 ms and again in the region of input present during the event. approximately 120–140 ms. Such features require a higher sampling frequency to be captured accurately. Lateral acceleration and delta v The fig 10 shows the time history of lateral Delta-V as a function of time, where time is given in milliseconds and Delta-V values are expressed in km/h. The data are sampled at 10 ms intervals. In the initial phase up to approximately 40 ms, the Delta-V values are zero, indicating the absence of significant lateral acceleration. From this point, a gradual increase begins, with Delta-V rising smoothly between 50 ms and 140 ms up to approximately 3 km/h. This is followed by a slight decrease and stabilization, where values between approximately 150 ms and 240 ms remain around 2 km/h. At 250 ms, the value is no longer available. The overall response represents a relatively mild lateral impulse with a gradual onset and subsequent stabilization without a pronounced peak. Figure 11 CrashScan lateral acceleration of the BMW Figure 10 CrashScan lateral delta-v of the BMW
Source page 10
Read page 10 extracted text
Extracted text may not preserve table columns. Refer to the page image or original PDF for data relationships.
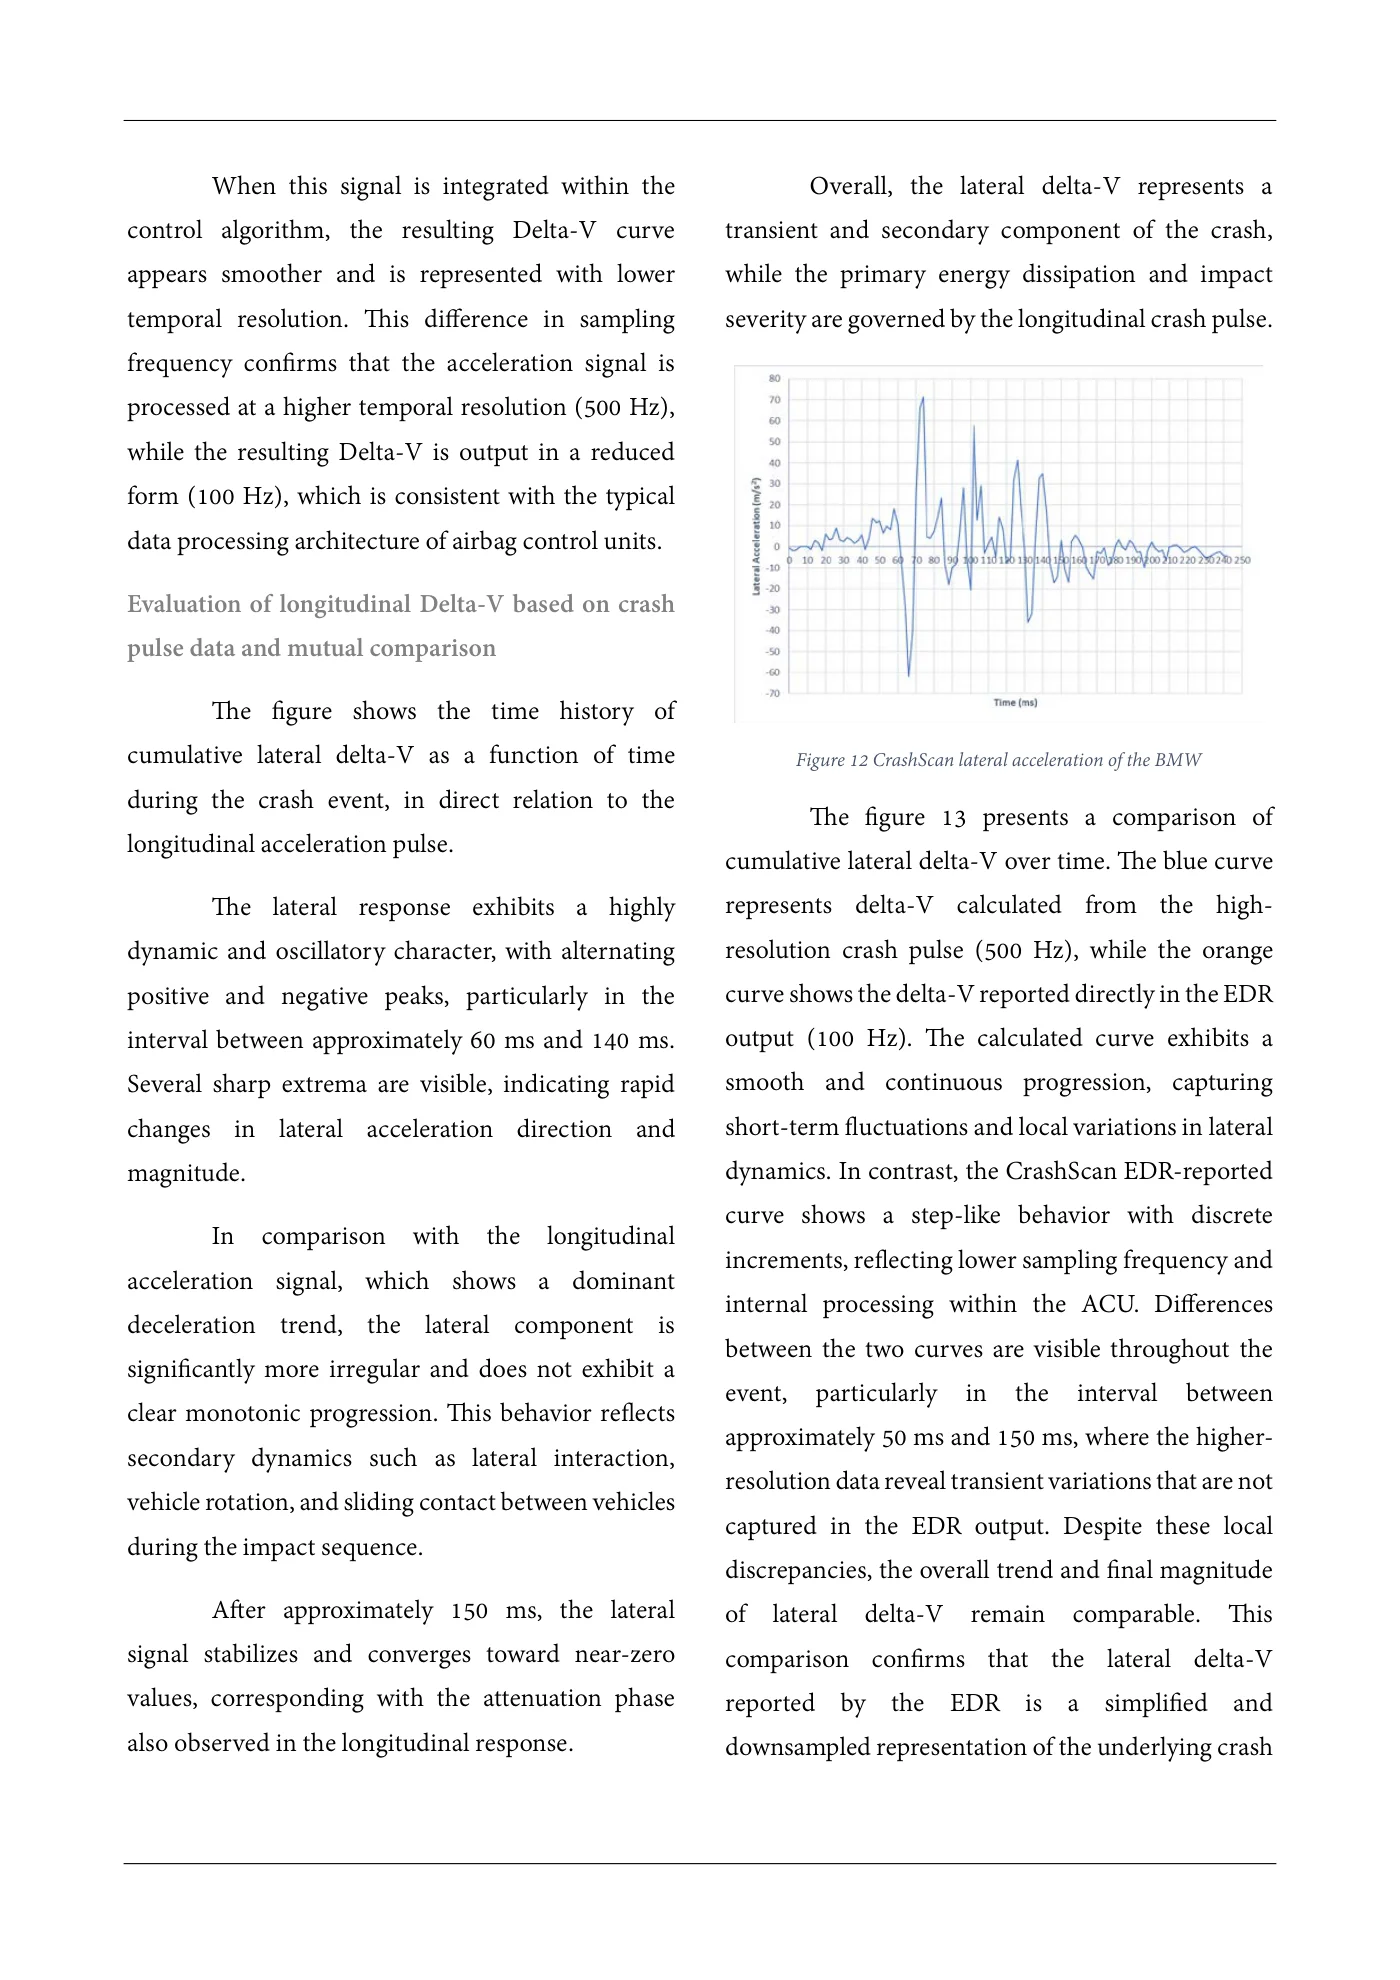
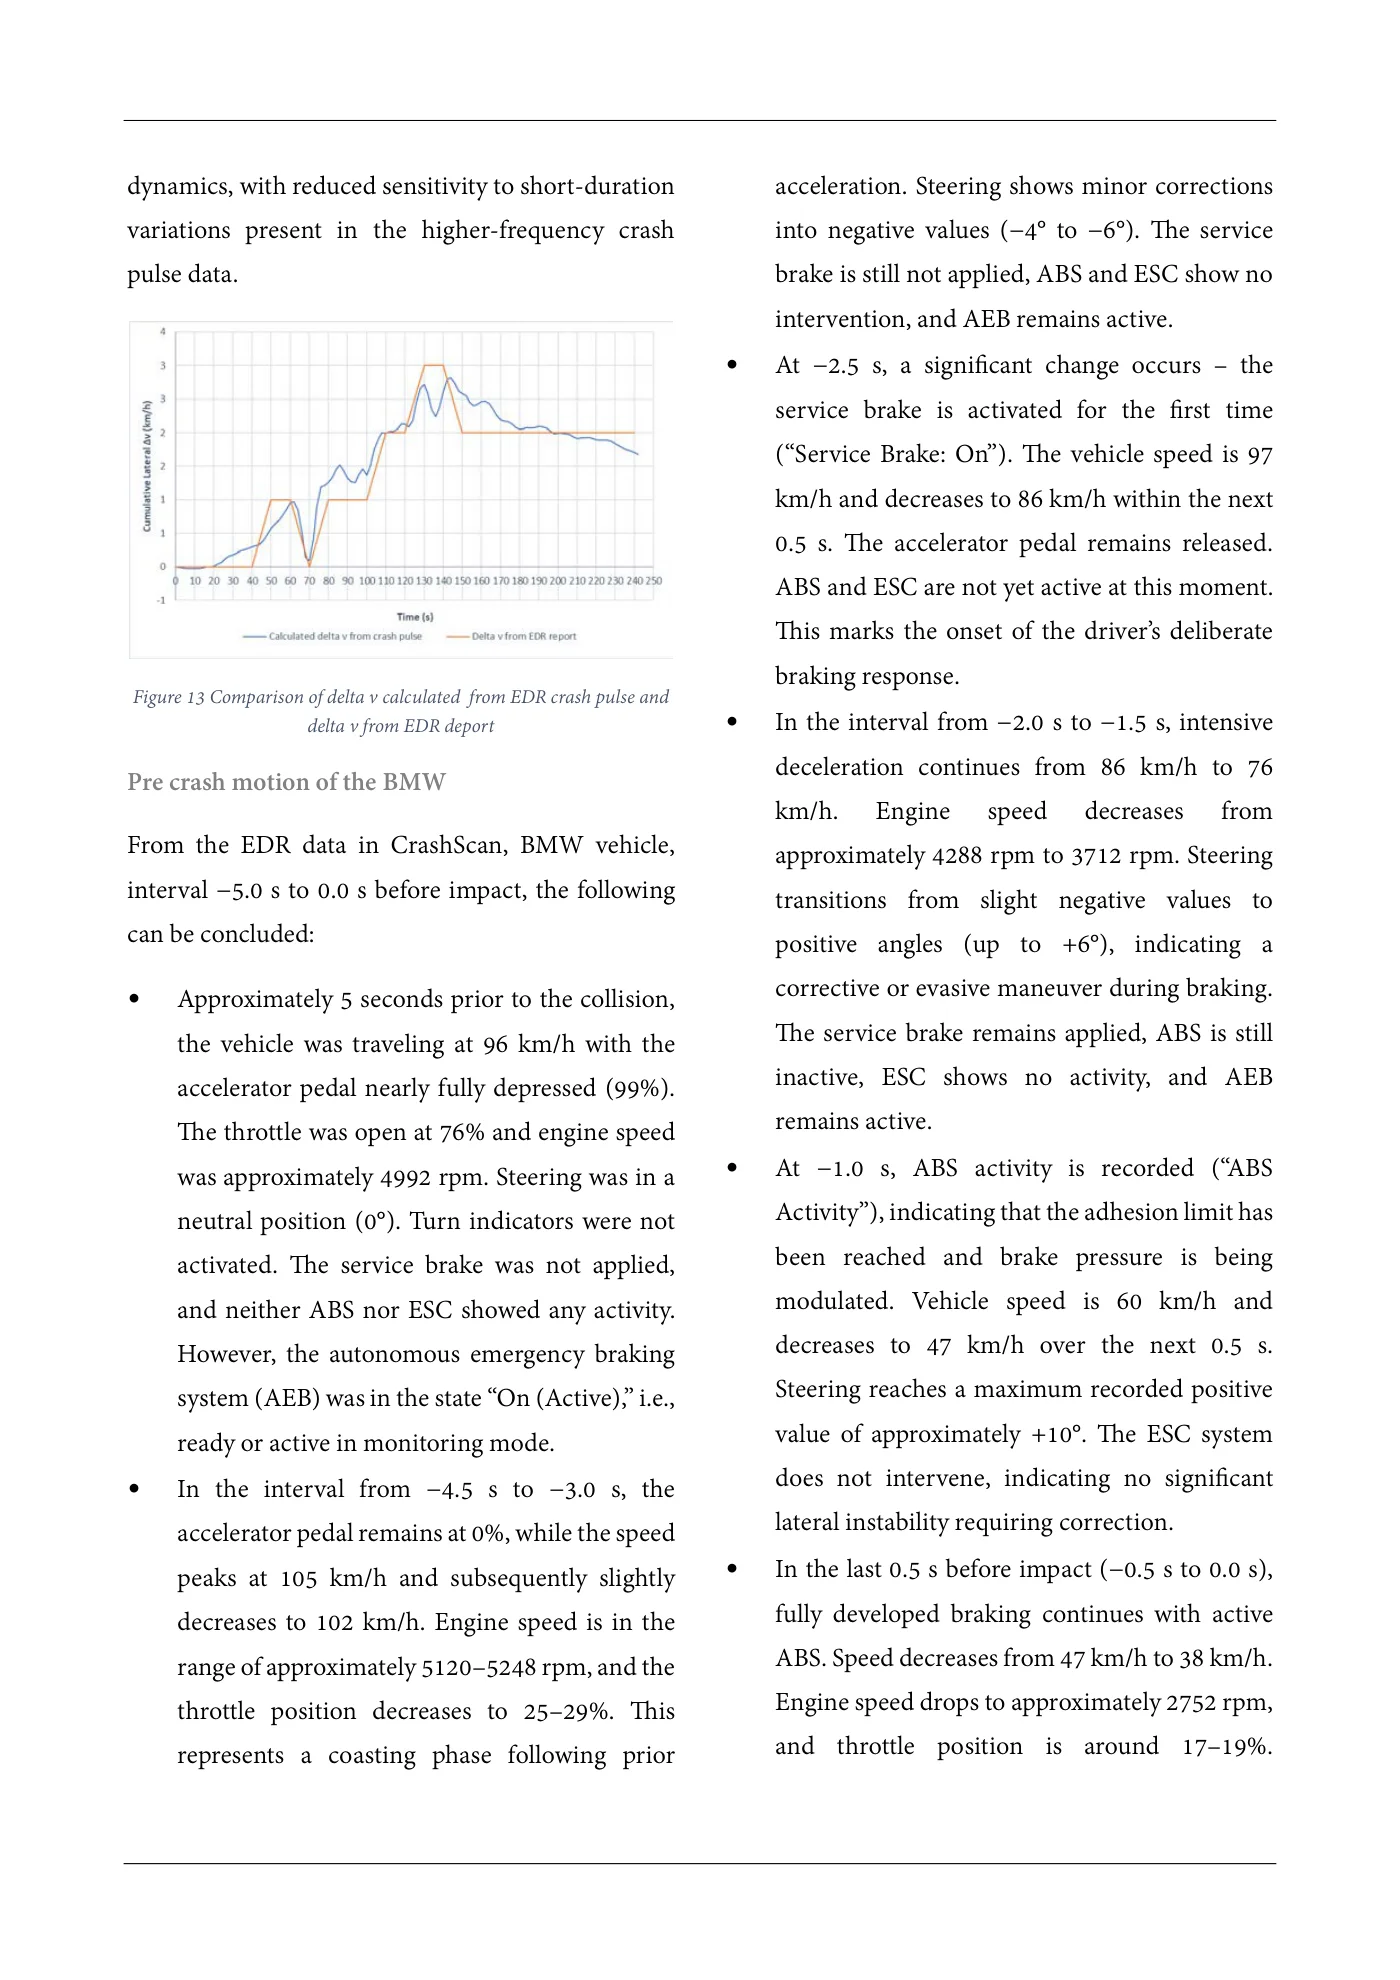
When this signal is integrated within the Overall, the lateral delta-V represents a control algorithm, the resulting Delta-V curve transient and secondary component of the crash, appears smoother and is represented with lower while the primary energy dissipation and impact temporal resolution. This difference in sampling severity are governed by the longitudinal crash pulse. frequency confirms that the acceleration signal is processed at a higher temporal resolution (500 Hz), while the resulting Delta-V is output in a reduced form (100 Hz), which is consistent with the typical data processing architecture of airbag control units. Evaluation of longitudinal Delta-V based on crash pulse data and mutual comparison The figure shows the time history of cumulative lateral delta-V as a function of time Figure 12 CrashScan lateral acceleration of the BMW during the crash event, in direct relation to the The figure 13 presents a comparison of longitudinal acceleration pulse. cumulative lateral delta-V over time. The blue curve The lateral response exhibits a highly represents delta-V calculated from the high- dynamic and oscillatory character, with alternating resolution crash pulse (500 Hz), while the orange positive and negative peaks, particularly in the curve shows the delta-V reported directly in the EDR interval between approximately 60 ms and 140 ms. output (100 Hz). The calculated curve exhibits a Several sharp extrema are visible, indicating rapid smooth and continuous progression, capturing changes in lateral acceleration direction and short-term fluctuations and local variations in lateral magnitude. dynamics. In contrast, the CrashScan EDR-reported curve shows a step-like behavior with discrete In comparison with the longitudinal increments, reflecting lower sampling frequency and acceleration signal, which shows a dominant internal processing within the ACU. Differences deceleration trend, the lateral component is between the two curves are visible throughout the significantly more irregular and does not exhibit a event, particularly in the interval between clear monotonic progression. This behavior reflects approximately 50 ms and 150 ms, where the higher- secondary dynamics such as lateral interaction, resolution data reveal transient variations that are not vehicle rotation, and sliding contact between vehicles captured in the EDR output. Despite these local during the impact sequence. discrepancies, the overall trend and final magnitude After approximately 150 ms, the lateral of lateral delta-V remain comparable. This signal stabilizes and converges toward near-zero comparison confirms that the lateral delta-V values, corresponding with the attenuation phase reported by the EDR is a simplified and also observed in the longitudinal response. downsampled representation of the underlying crash
Source page 11
Read page 11 extracted text
Extracted text may not preserve table columns. Refer to the page image or original PDF for data relationships.
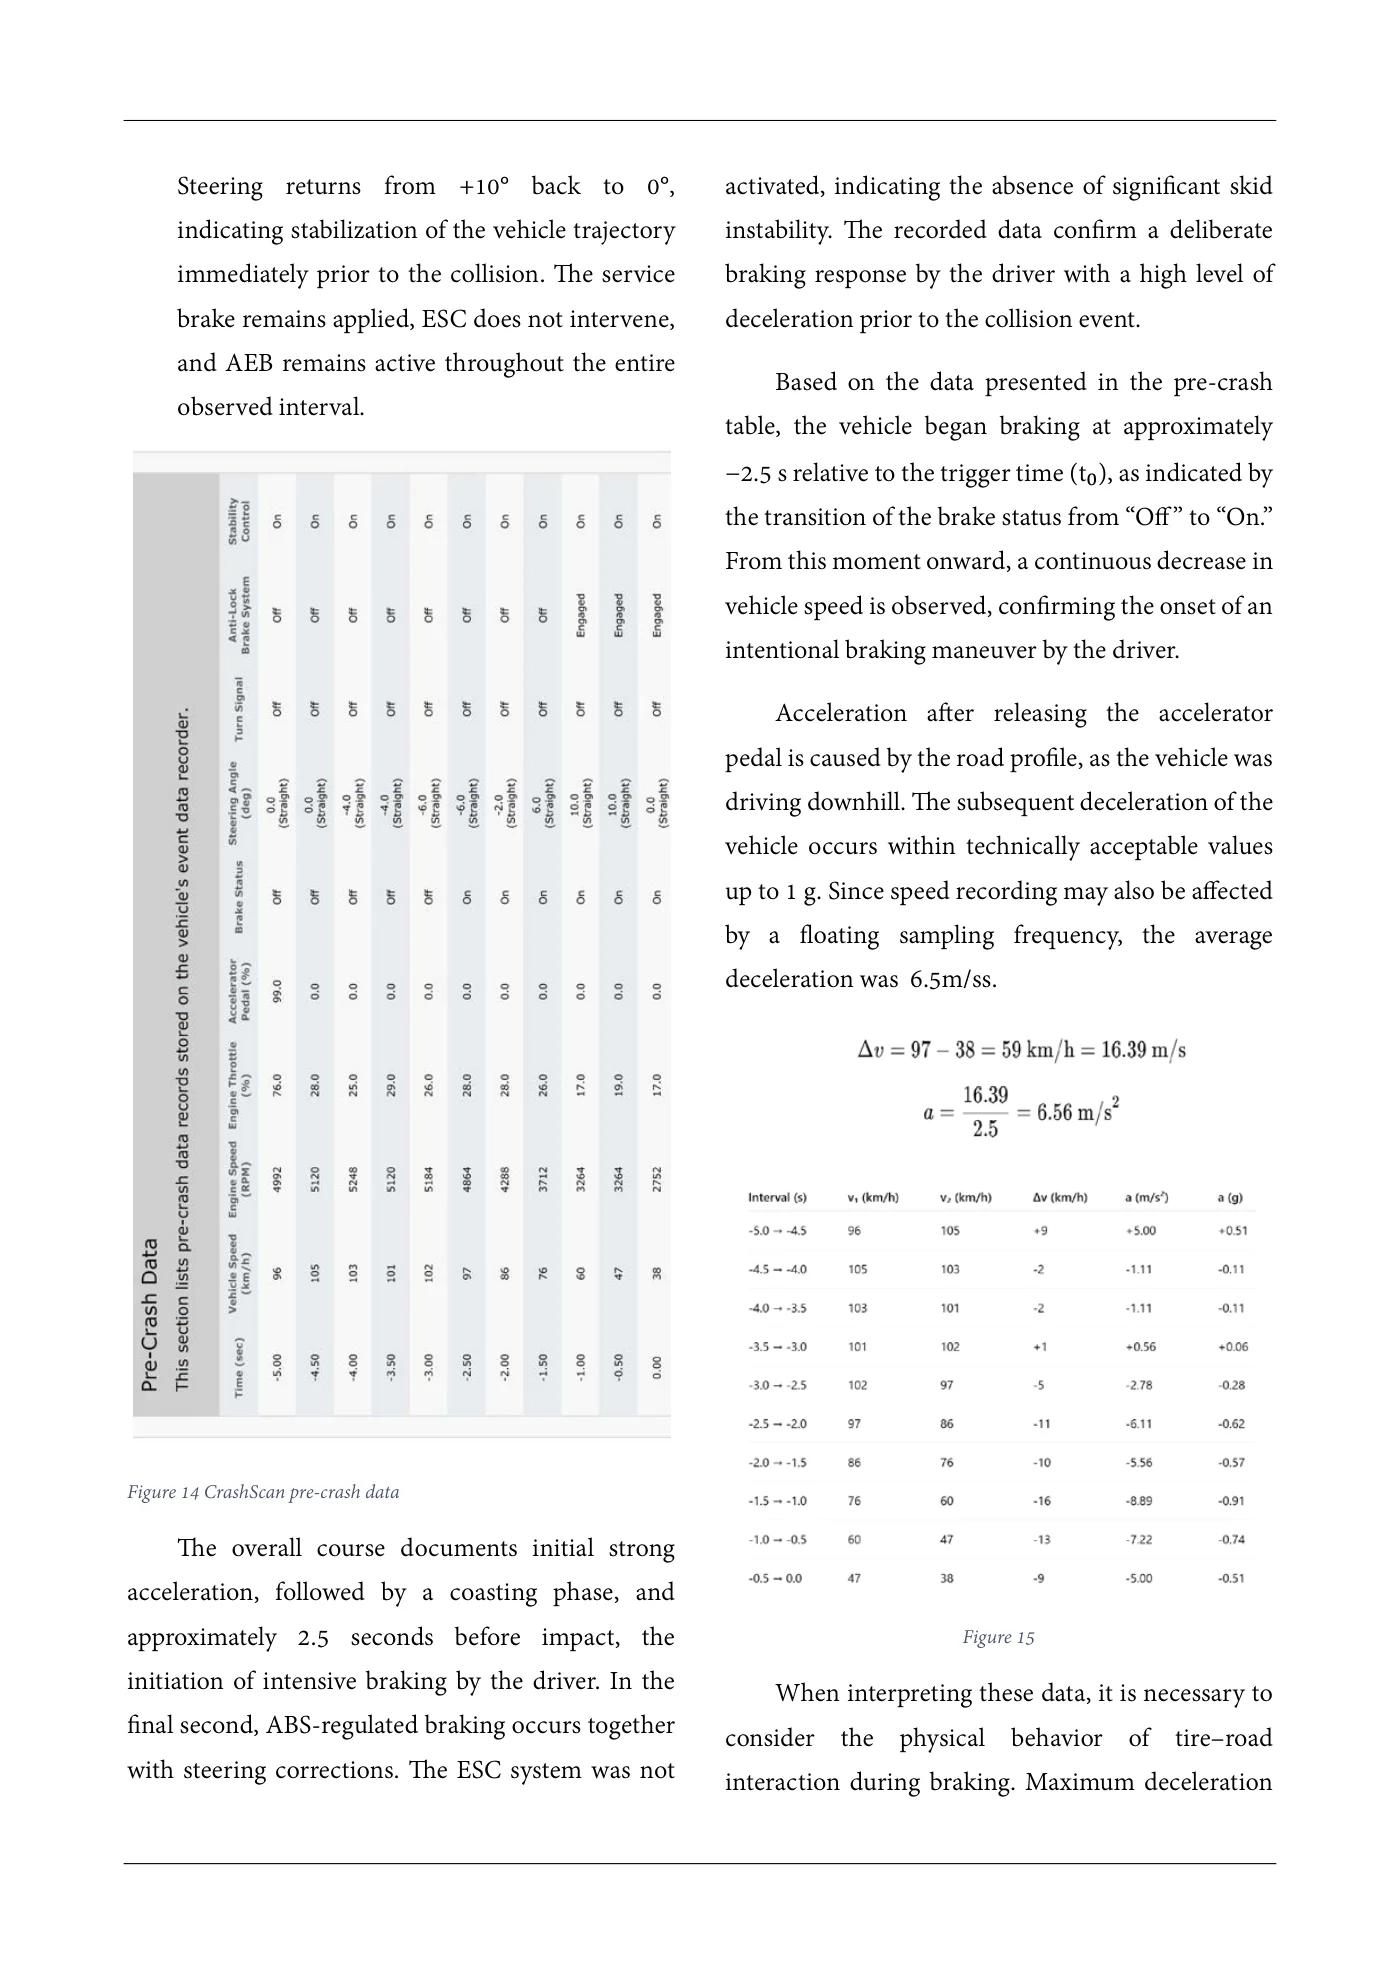
dynamics, with reduced sensitivity to short-duration acceleration. Steering shows minor corrections variations present in the higher-frequency crash into negative values (−4° to −6°). The service pulse data. brake is still not applied, ABS and ESC show no intervention, and AEB remains active. • At −2.5 s, a significant change occurs – the service brake is activated for the first time (“Service Brake: On”). The vehicle speed is 97 km/h and decreases to 86 km/h within the next 0.5 s. The accelerator pedal remains released. ABS and ESC are not yet active at this moment. This marks the onset of the driver’s deliberate braking response. Figure 13 Comparison of delta v calculated from EDR crash pulse and delta v from EDR deport • In the interval from −2.0 s to −1.5 s, intensive deceleration continues from 86 km/h to 76Pre crash motion of the BMW km/h. Engine speed decreases from From the EDR data in CrashScan, BMW vehicle, approximately 4288 rpm to 3712 rpm. Steering interval −5.0 s to 0.0 s before impact, the following transitions from slight negative values to can be concluded: positive angles (up to +6°), indicating a • Approximately 5 seconds prior to the collision, corrective or evasive maneuver during braking. The service brake remains applied, ABS is still the vehicle was traveling at 96 km/h with the inactive, ESC shows no activity, and AEB accelerator pedal nearly fully depressed (99%). remains active. The throttle was open at 76% and engine speed • At −1.0 s, ABS activity is recorded (“ABS was approximately 4992 rpm. Steering was in a Activity”), indicating that the adhesion limit has neutral position (0°). Turn indicators were not been reached and brake pressure is being activated. The service brake was not applied, modulated. Vehicle speed is 60 km/h and and neither ABS nor ESC showed any activity. decreases to 47 km/h over the next 0.5 s. However, the autonomous emergency braking Steering reaches a maximum recorded positive system (AEB) was in the state “On (Active),” i.e., value of approximately +10°. The ESC system ready or active in monitoring mode. • In the interval from −4.5 s to −3.0 s, the does not intervene, indicating no significant lateral instability requiring correction. accelerator pedal remains at 0%, while the speed • In the last 0.5 s before impact (−0.5 s to 0.0 s), peaks at 105 km/h and subsequently slightly fully developed braking continues with active decreases to 102 km/h. Engine speed is in the ABS. Speed decreases from 47 km/h to 38 km/h. range of approximately 5120–5248 rpm, and the Engine speed drops to approximately 2752 rpm, throttle position decreases to 25–29%. This and throttle position is around 17–19%. represents a coasting phase following prior
Source page 12
Read page 12 extracted text
Extracted text may not preserve table columns. Refer to the page image or original PDF for data relationships.
Steering returns from +10° back to 0°, activated, indicating the absence of significant skid indicating stabilization of the vehicle trajectory instability. The recorded data confirm a deliberate immediately prior to the collision. The service braking response by the driver with a high level of brake remains applied, ESC does not intervene, deceleration prior to the collision event. and AEB remains active throughout the entire Based on the data presented in the pre-crash observed interval. table, the vehicle began braking at approximately −2.5 s relative to the trigger time as indicated by the transition of the brake status from “Off” to “On.” (t₀), From this moment onward, a continuous decrease in vehicle speed is observed, confirming the onset of an intentional braking maneuver by the driver. Acceleration after releasing the accelerator pedal is caused by the road profile, as the vehicle was driving downhill. The subsequent deceleration of the vehicle occurs within technically acceptable values up to 1 g. Since speed recording may also be affected by a floating sampling frequency, the average deceleration was 6.5m/ss. Figure 14 CrashScan pre-crash data The overall course documents initial strong acceleration, followed by a coasting phase, and approximately 2.5 seconds before impact, the Figure 15 initiation of intensive braking by the driver. In the When interpreting these data, it is necessary to final second, ABS-regulated braking occurs together consider the physical behavior of tire–road with steering corrections. The ESC system was not interaction during braking. Maximum deceleration
Source page 13
Read page 13 extracted text
Extracted text may not preserve table columns. Refer to the page image or original PDF for data relationships.
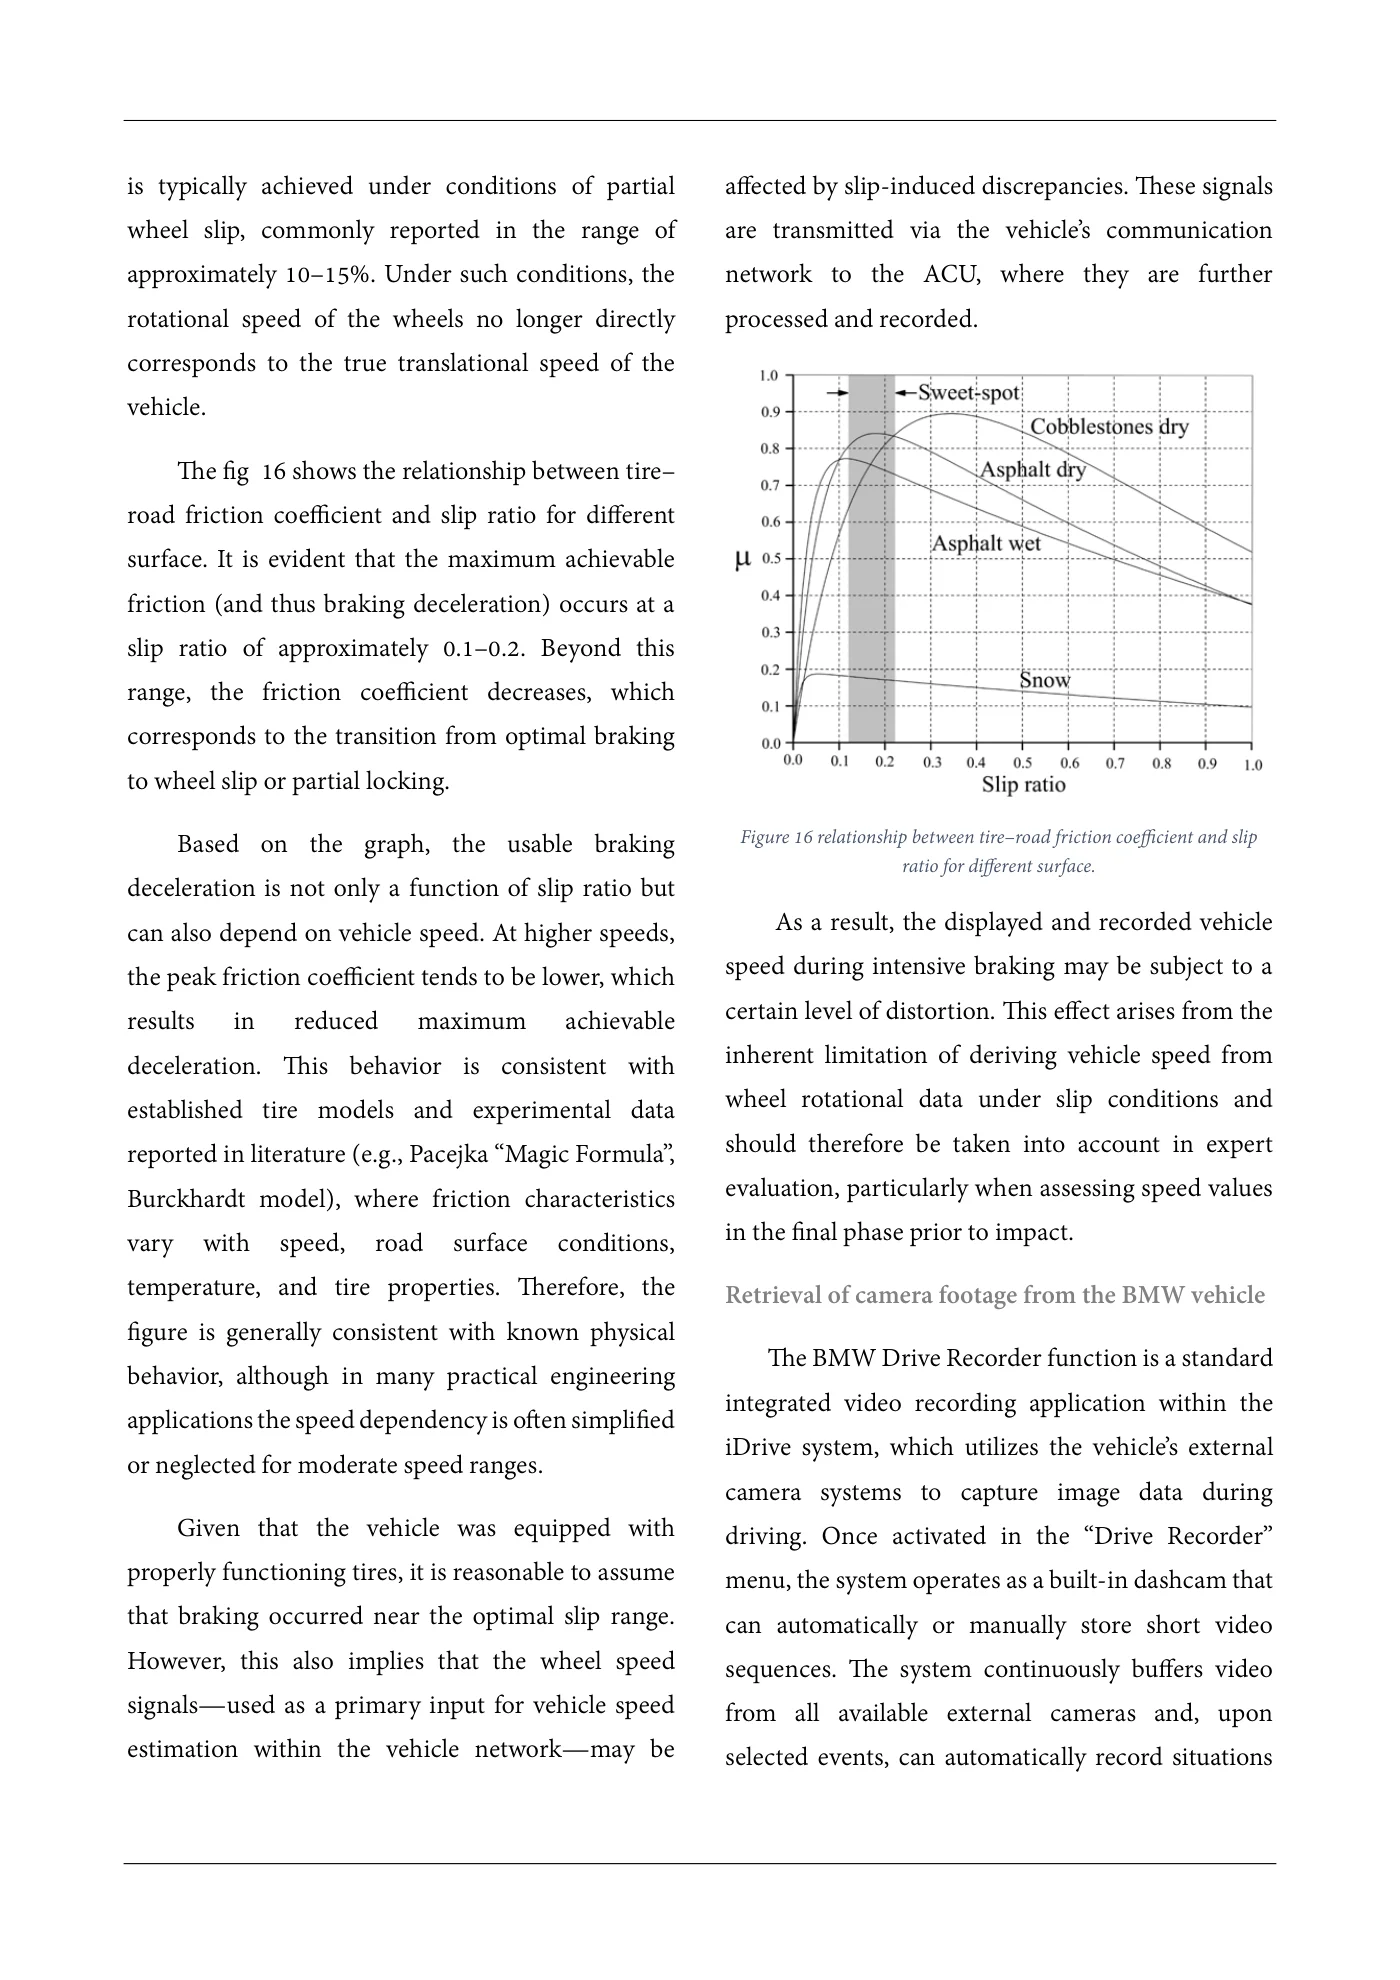
is typically achieved under conditions of partial affected by slip-induced discrepancies. These signals wheel slip, commonly reported in the range of are transmitted via the vehicle’s communication approximately 10–15%. Under such conditions, the network to the ACU, where they are further rotational speed of the wheels no longer directly processed and recorded. corresponds to the true translational speed of the vehicle. The fig 16 shows the relationship between tire– road friction coefficient and slip ratio for different surface. It is evident that the maximum achievable friction (and thus braking deceleration) occurs at a slip ratio of approximately 0.1–0.2. Beyond this range, the friction coefficient decreases, which corresponds to the transition from optimal braking to wheel slip or partial locking. Based on the graph, the usable braking Figure 16 relationship between tire–road friction coefficient and slip ratio for different surface. deceleration is not only a function of slip ratio but As a result, the displayed and recorded vehiclecan also depend on vehicle speed. At higher speeds, speed during intensive braking may be subject to athe peak friction coefficient tends to be lower, which certain level of distortion. This effect arises from theresults in reduced maximum achievable inherent limitation of deriving vehicle speed fromdeceleration. This behavior is consistent with wheel rotational data under slip conditions andestablished tire models and experimental data should therefore be taken into account in expertreported in literature (e.g., Pacejka “Magic Formula”, evaluation, particularly when assessing speed valuesBurckhardt model), where friction characteristics in the final phase prior to impact.vary with speed, road surface conditions, temperature, and tire properties. Therefore, the Retrieval of camera footage from the BMW vehicle figure is generally consistent with known physical The BMW Drive Recorder function is a standardbehavior, although in many practical engineering integrated video recording application within theapplications the speed dependency is often simplified iDrive system, which utilizes the vehicle’s externalor neglected for moderate speed ranges. camera systems to capture image data during Given that the vehicle was equipped with driving. Once activated in the “Drive Recorder” properly functioning tires, it is reasonable to assume menu, the system operates as a built-in dashcam that that braking occurred near the optimal slip range. can automatically or manually store short video However, this also implies that the wheel speed sequences. The system continuously buffers video signals—used as a primary input for vehicle speed from all available external cameras and, upon estimation within the vehicle network—may be selected events, can automatically record situations
Source page 14
Read page 14 extracted text
Extracted text may not preserve table columns. Refer to the page image or original PDF for data relationships.
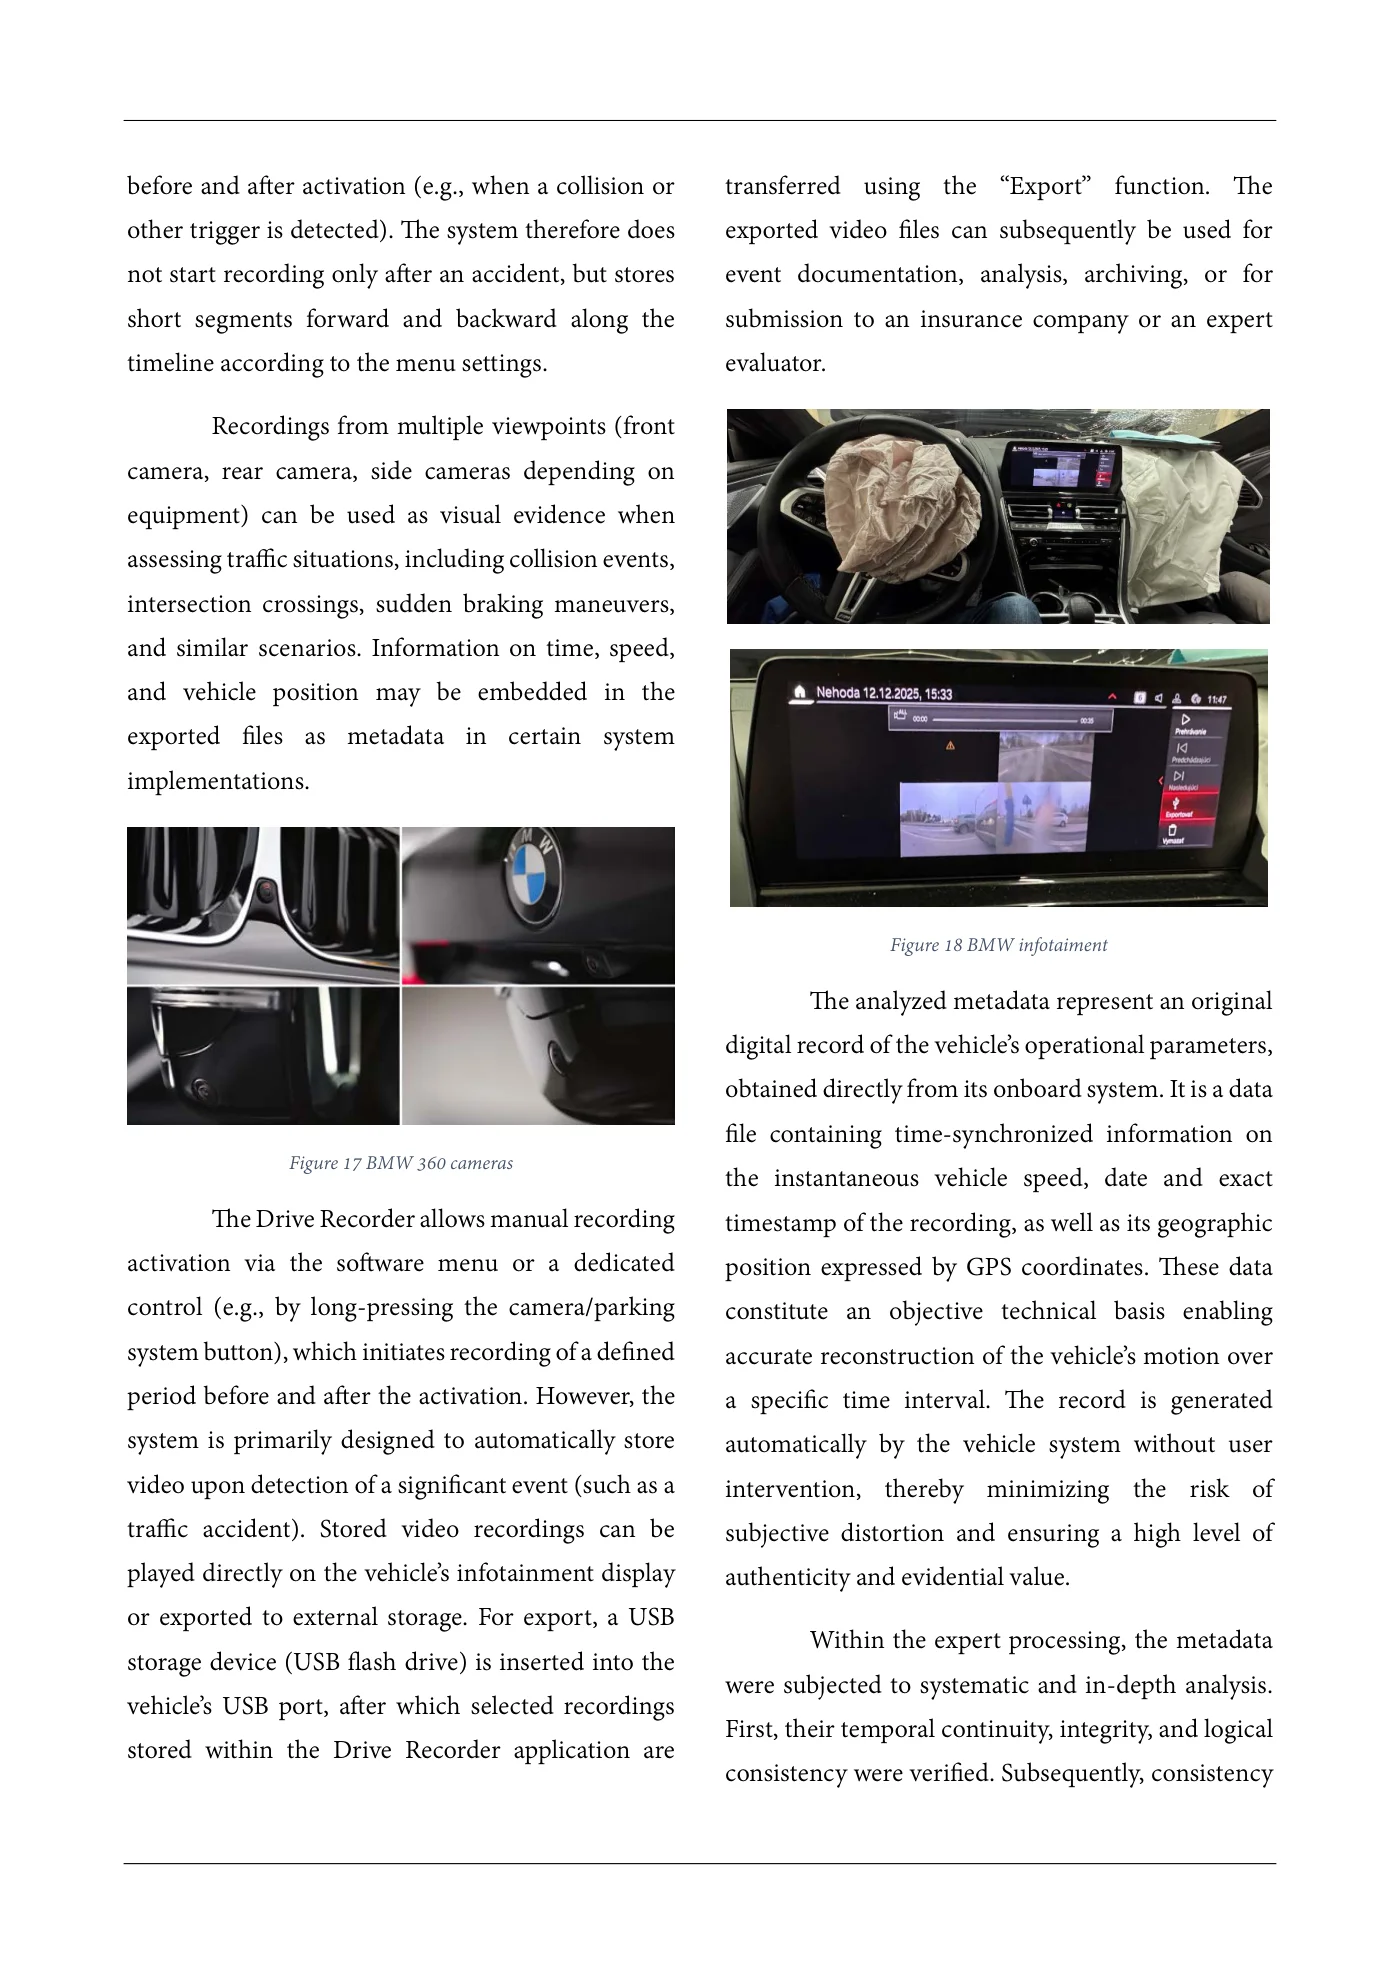
before and after activation (e.g., when a collision or transferred using the “Export” function. The other trigger is detected). The system therefore does exported video files can subsequently be used for not start recording only after an accident, but stores event documentation, analysis, archiving, or for short segments forward and backward along the submission to an insurance company or an expert timeline according to the menu settings. evaluator. Recordings from multiple viewpoints (front camera, rear camera, side cameras depending on equipment) can be used as visual evidence when assessing traffic situations, including collision events, intersection crossings, sudden braking maneuvers, and similar scenarios. Information on time, speed, and vehicle position may be embedded in the exported files as metadata in certain system implementations. Figure 18 BMW infotaiment The analyzed metadata represent an original digital record of the vehicle’s operational parameters, obtained directly from its onboard system. It is a data file containing time-synchronized information on Figure 17 BMW 360 cameras the instantaneous vehicle speed, date and exact The Drive Recorder allows manual recording timestamp of the recording, as well as its geographic activation via the software menu or a dedicated position expressed by GPS coordinates. These data control (e.g., by long-pressing the camera/parking constitute an objective technical basis enabling system button), which initiates recording of a defined accurate reconstruction of the vehicle’s motion over period before and after the activation. However, the a specific time interval. The record is generated system is primarily designed to automatically store automatically by the vehicle system without user video upon detection of a significant event (such as a intervention, thereby minimizing the risk of traffic accident). Stored video recordings can be subjective distortion and ensuring a high level of played directly on the vehicle’s infotainment display authenticity and evidential value. or exported to external storage. For export, a USB Within the expert processing, the metadata storage device (USB flash drive) is inserted into the were subjected to systematic and in-depth analysis. vehicle’s USB port, after which selected recordings First, their temporal continuity, integrity, and logical stored within the Drive Recorder application are consistency were verified. Subsequently, consistency
Source page 15
Read page 15 extracted text
Extracted text may not preserve table columns. Refer to the page image or original PDF for data relationships.
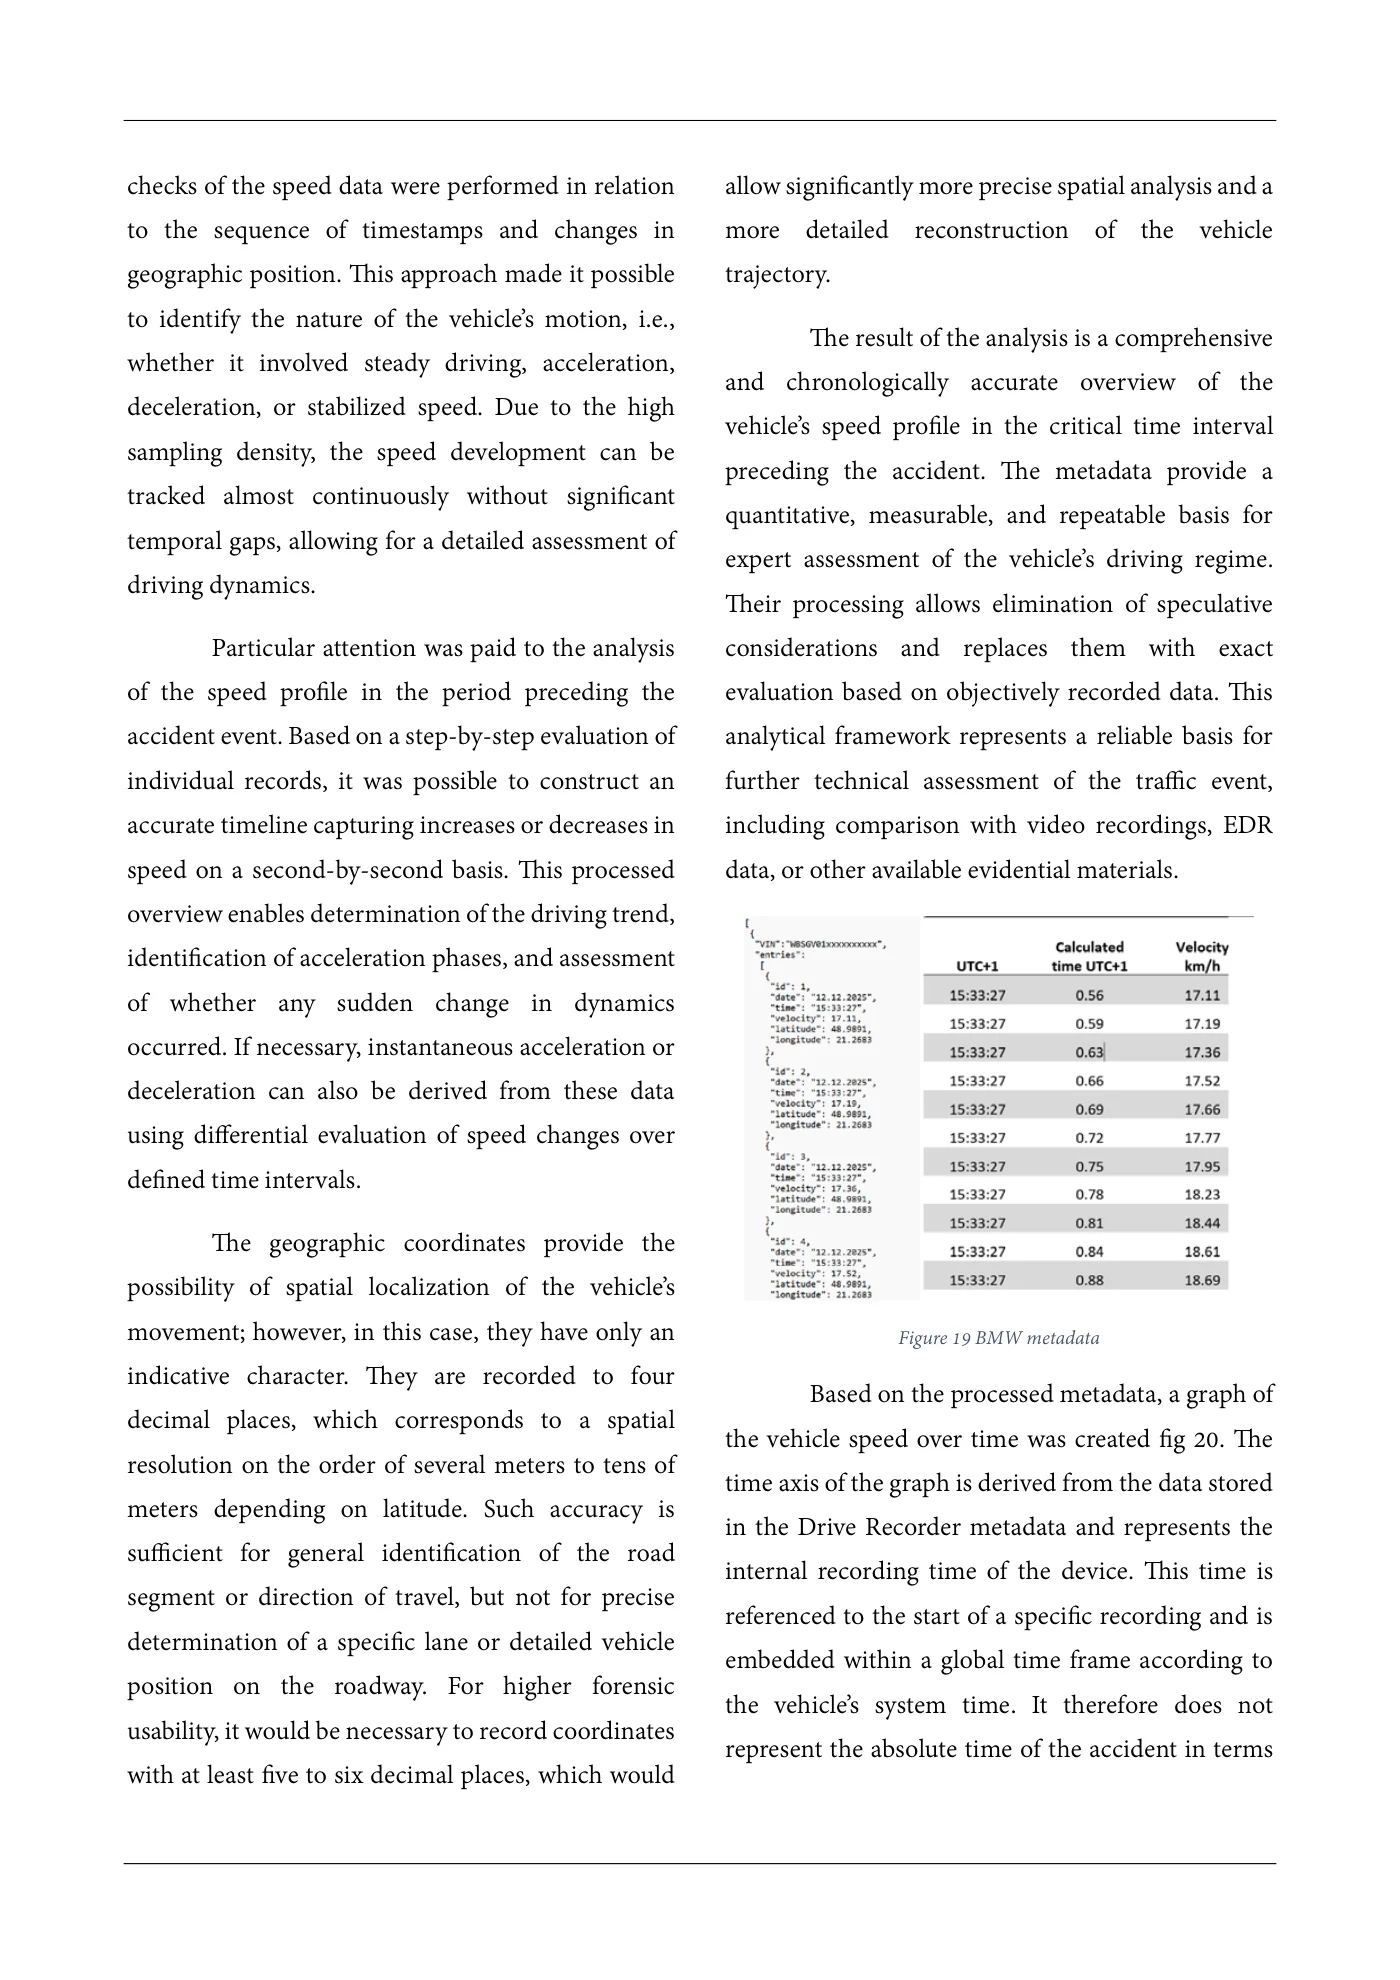
checks of the speed data were performed in relation allow significantly more precise spatial analysis and a to the sequence of timestamps and changes in more detailed reconstruction of the vehicle geographic position. This approach made it possible trajectory. to identify the nature of the vehicle’s motion, i.e., The result of the analysis is a comprehensive whether it involved steady driving, acceleration, and chronologically accurate overview of the deceleration, or stabilized speed. Due to the high vehicle’s speed profile in the critical time interval sampling density, the speed development can be preceding the accident. The metadata provide a tracked almost continuously without significant quantitative, measurable, and repeatable basis for temporal gaps, allowing for a detailed assessment of expert assessment of the vehicle’s driving regime. driving dynamics. Their processing allows elimination of speculative Particular attention was paid to the analysis considerations and replaces them with exact of the speed profile in the period preceding the evaluation based on objectively recorded data. This accident event. Based on a step-by-step evaluation of analytical framework represents a reliable basis for individual records, it was possible to construct an further technical assessment of the traffic event, accurate timeline capturing increases or decreases in including comparison with video recordings, EDR speed on a second-by-second basis. This processed data, or other available evidential materials. overview enables determination of the driving trend, identification of acceleration phases, and assessment of whether any sudden change in dynamics occurred. If necessary, instantaneous acceleration or deceleration can also be derived from these data using differential evaluation of speed changes over defined time intervals. The geographic coordinates provide the possibility of spatial localization of the vehicle’s movement; however, in this case, they have only an Figure 19 BMW metadata indicative character. They are recorded to four Based on the processed metadata, a graph of decimal places, which corresponds to a spatial the vehicle speed over time was created fig 20. The resolution on the order of several meters to tens of time axis of the graph is derived from the data stored meters depending on latitude. Such accuracy is in the Drive Recorder metadata and represents the sufficient for general identification of the road internal recording time of the device. This time is segment or direction of travel, but not for precise referenced to the start of a specific recording and is determination of a specific lane or detailed vehicle embedded within a global time frame according to position on the roadway. For higher forensic the vehicle’s system time. It therefore does not usability, it would be necessary to record coordinates represent the absolute time of the accident in terms with at least five to six decimal places, which would
Source page 16
Read page 16 extracted text
Extracted text may not preserve table columns. Refer to the page image or original PDF for data relationships.
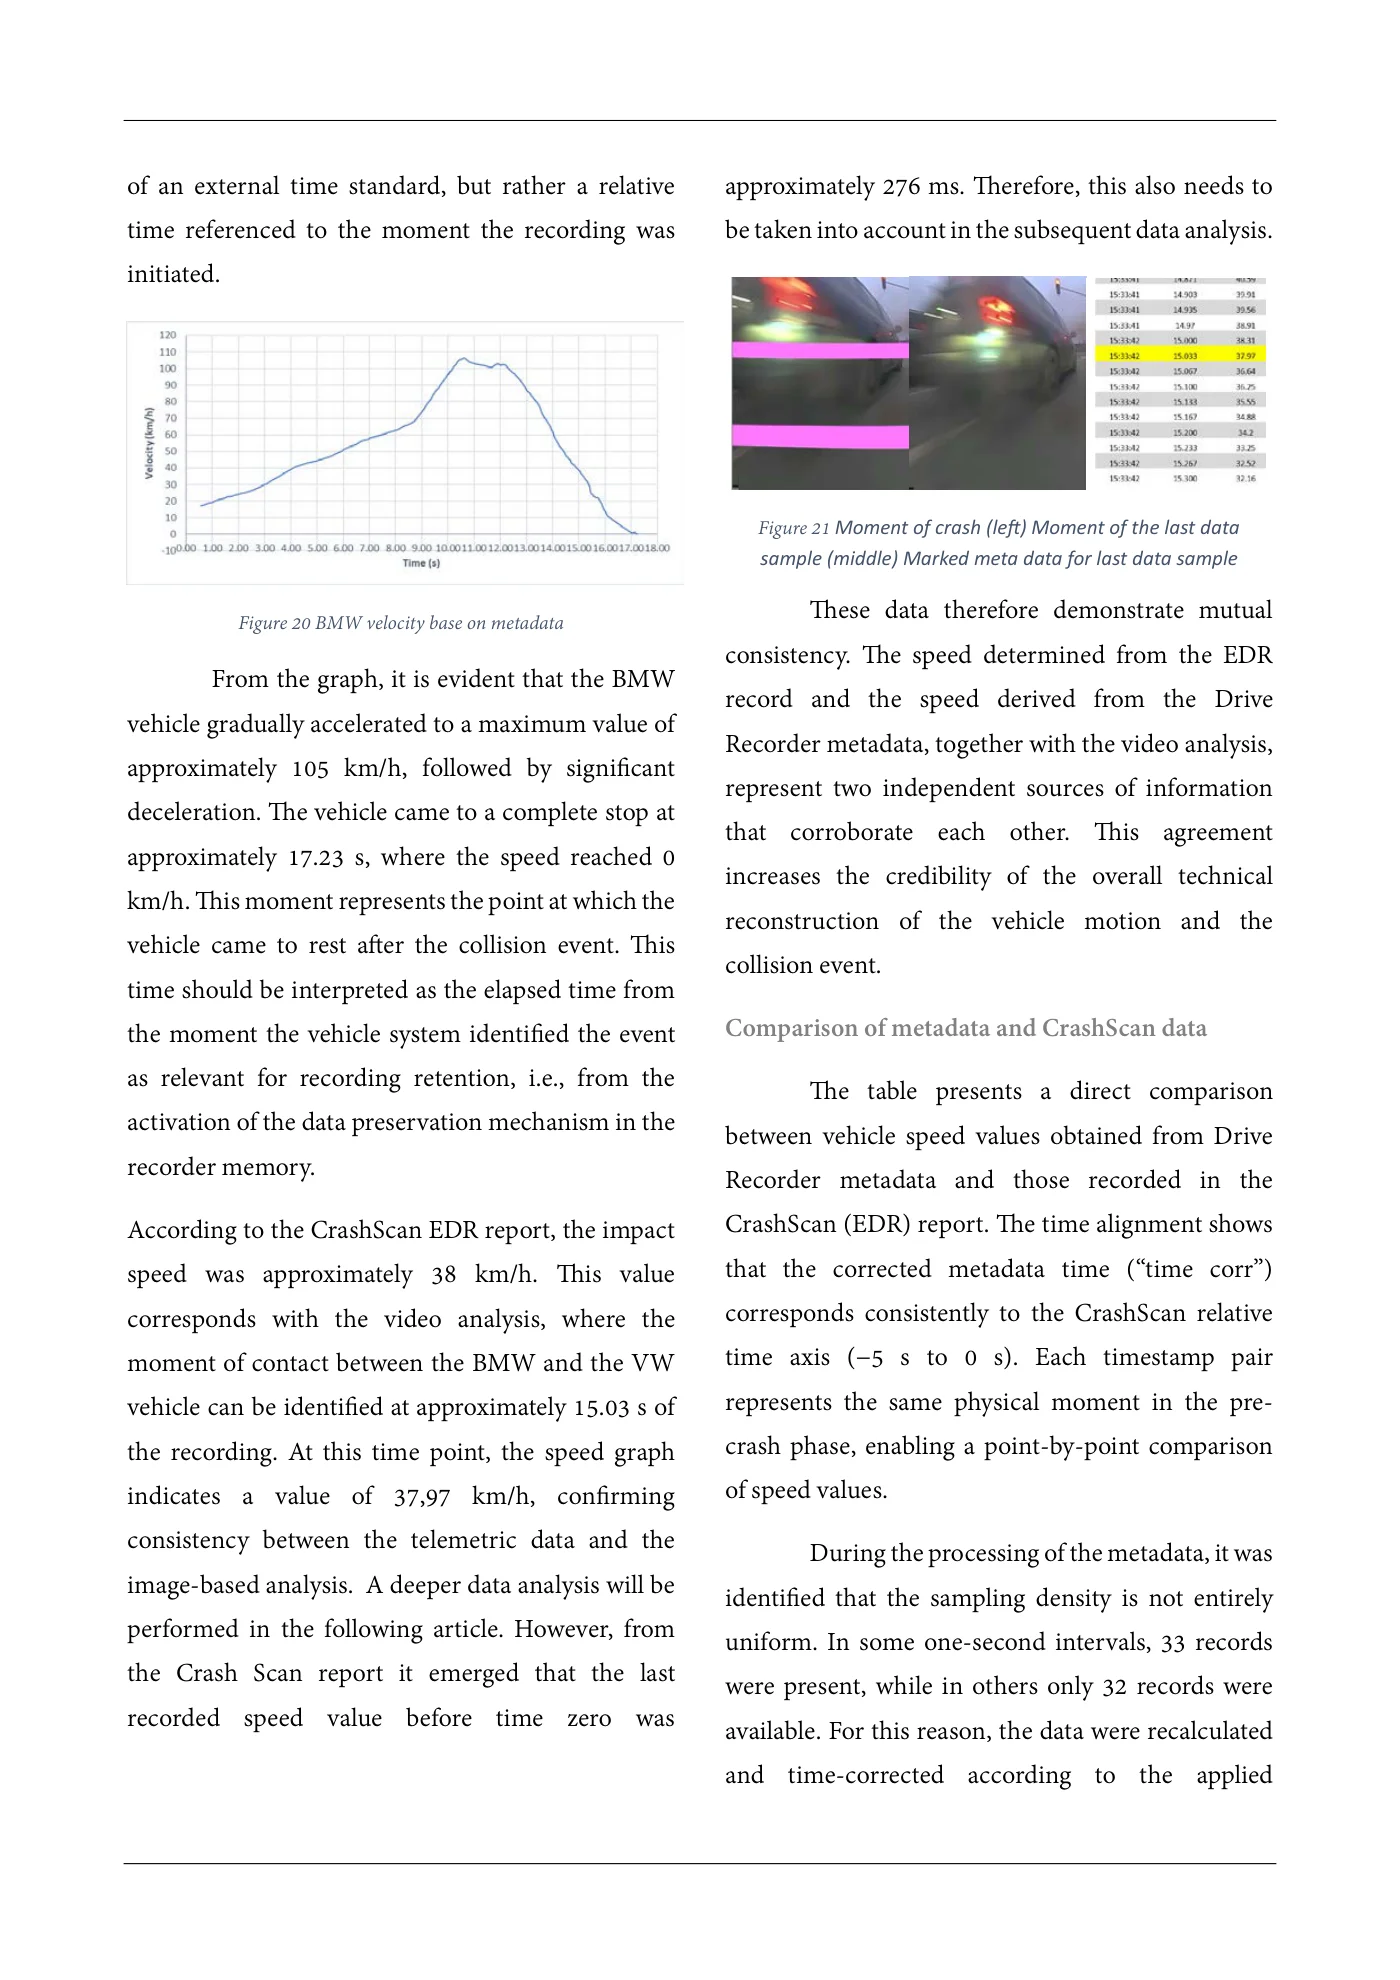
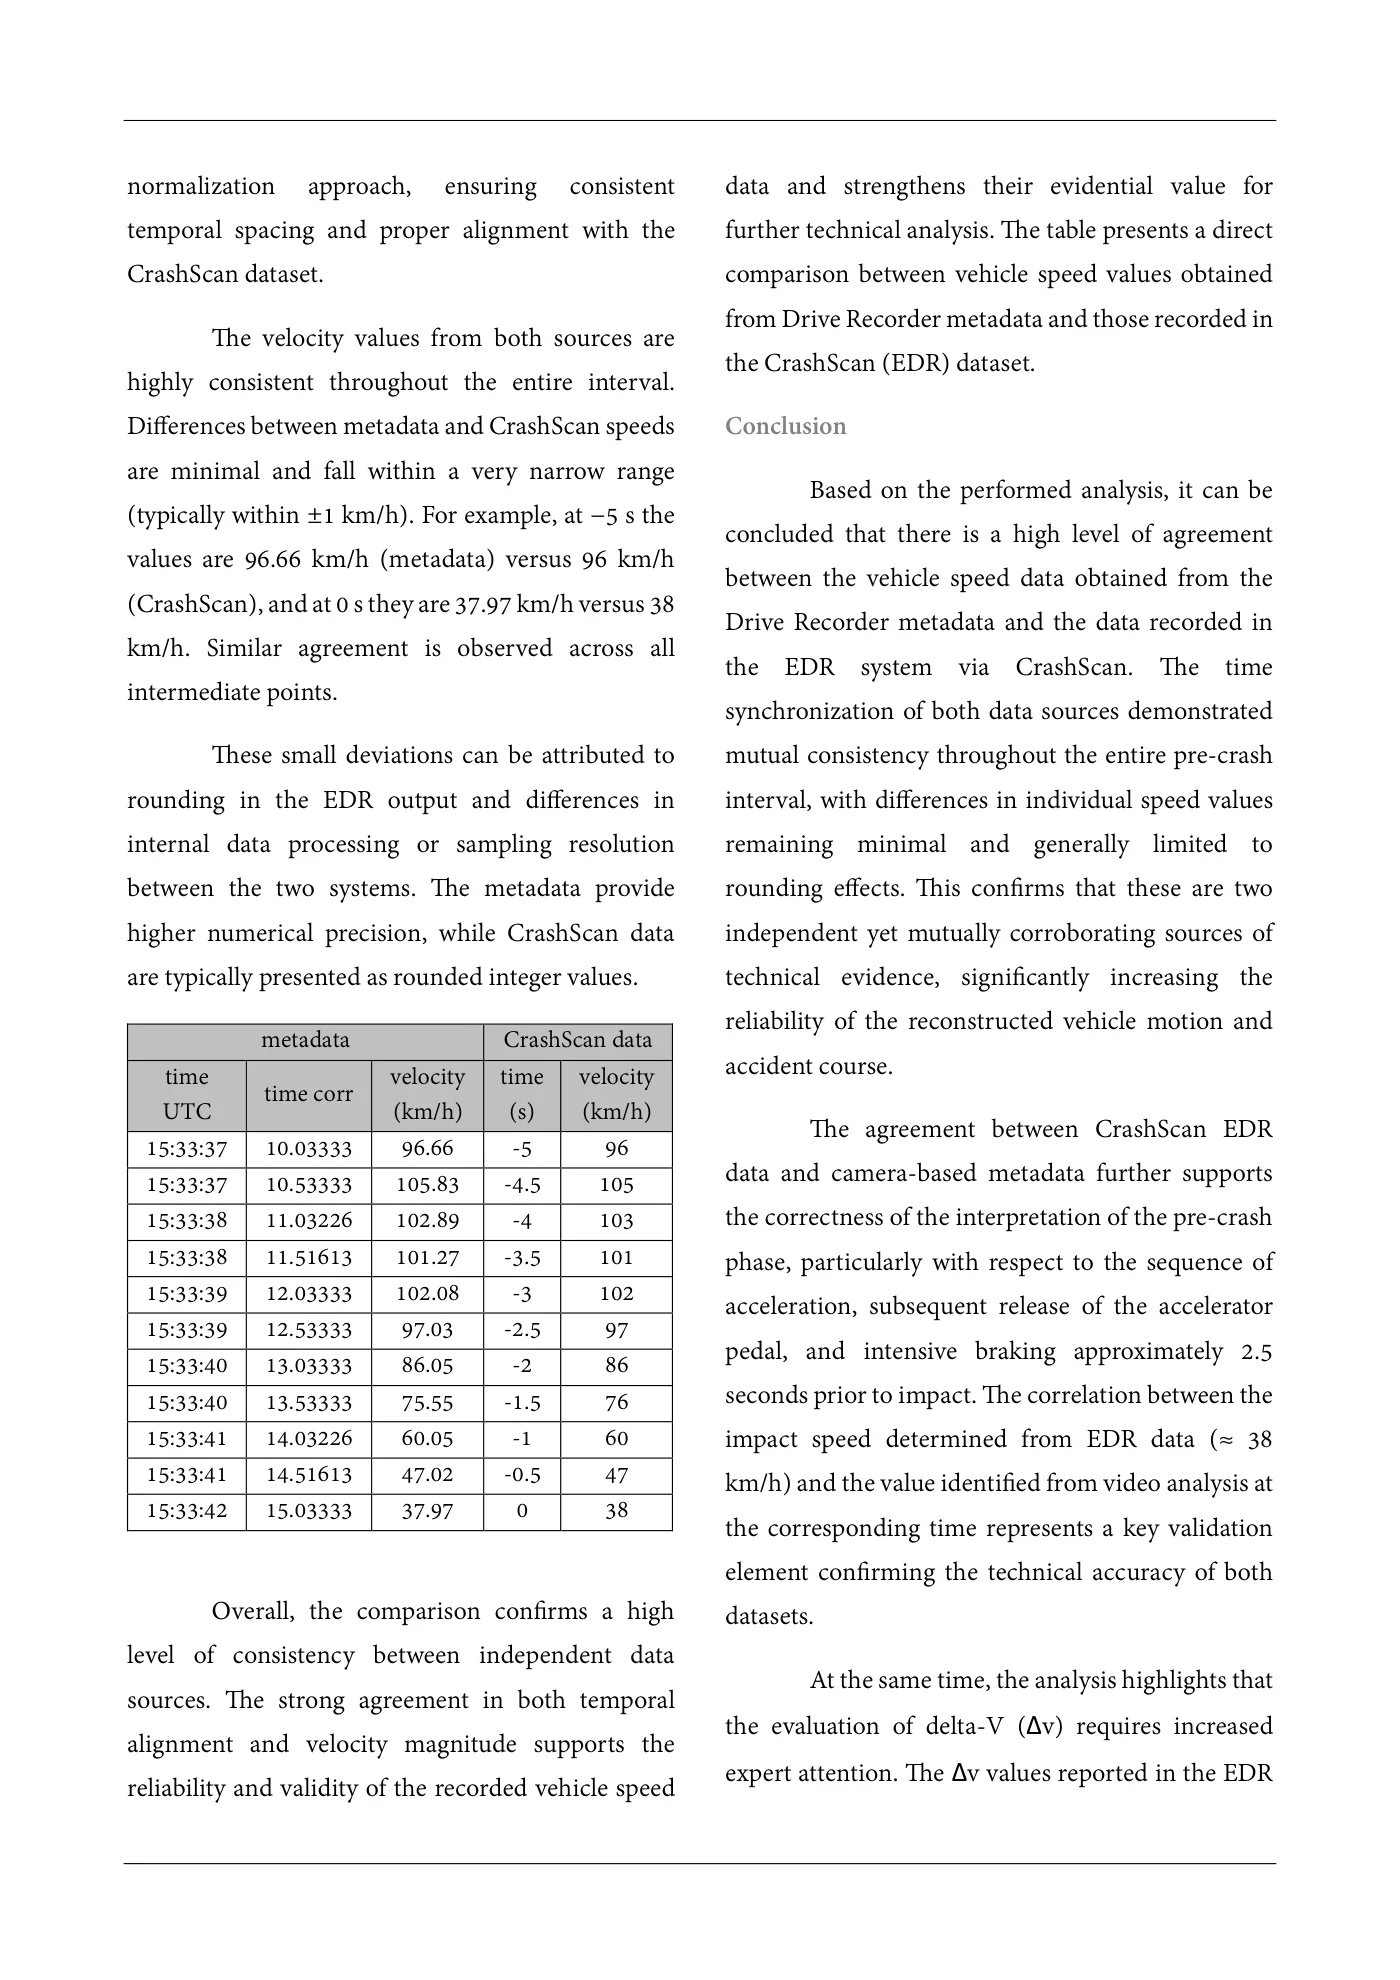
of an external time standard, but rather a relative approximately 276 ms. Therefore, this also needs to time referenced to the moment the recording was be taken into account in the subsequent data analysis. initiated. Figure 21 Moment of crash (left) Moment of the last data sample (middle) Marked meta data for last data sample These data therefore demonstrate mutual Figure 20 BMW velocity base on metadata consistency. The speed determined from the EDR From the graph, it is evident that the BMW record and the speed derived from the Drive vehicle gradually accelerated to a maximum value of Recorder metadata, together with the video analysis, approximately 105 km/h, followed by significant represent two independent sources of information deceleration. The vehicle came to a complete stop at that corroborate each other. This agreement approximately 17.23 s, where the speed reached 0 increases the credibility of the overall technical km/h. This moment represents the point at which the reconstruction of the vehicle motion and the vehicle came to rest after the collision event. This collision event. time should be interpreted as the elapsed time from the moment the vehicle system identified the event Comparison of metadata and CrashScan data as relevant for recording retention, i.e., from the The table presents a direct comparison activation of the data preservation mechanism in the between vehicle speed values obtained from Drive recorder memory. Recorder metadata and those recorded in the According to the CrashScan EDR report, the impact CrashScan (EDR) report. The time alignment shows speed was approximately 38 km/h. This value that the corrected metadata time (“time corr”) corresponds with the video analysis, where the corresponds consistently to the CrashScan relative moment of contact between the BMW and the VW time axis (−5 s to 0 s). Each timestamp pair vehicle can be identified at approximately 15.03 s of represents the same physical moment in the pre- the recording. At this time point, the speed graph crash phase, enabling a point-by-point comparison indicates a value of 37,97 km/h, confirming of speed values. consistency between the telemetric data and the During the processing of the metadata, it was image-based analysis. A deeper data analysis will be identified that the sampling density is not entirely performed in the following article. However, from uniform. In some one-second intervals, 33 records the Crash Scan report it emerged that the last were present, while in others only 32 records were recorded speed value before time zero was available. For this reason, the data were recalculated and time-corrected according to the applied
Source page 17
Read page 17 extracted text
Extracted text may not preserve table columns. Refer to the page image or original PDF for data relationships.
normalization approach, ensuring consistent data and strengthens their evidential value for temporal spacing and proper alignment with the further technical analysis. The table presents a direct CrashScan dataset. comparison between vehicle speed values obtained from Drive Recorder metadata and those recorded in The velocity values from both sources are the CrashScan (EDR) dataset. highly consistent throughout the entire interval. Differences between metadata and CrashScan speeds Conclusion are minimal and fall within a very narrow range Based on the performed analysis, it can be (typically within ±1 km/h). For example, at −5 s the concluded that there is a high level of agreement values are 96.66 km/h (metadata) versus 96 km/h between the vehicle speed data obtained from the (CrashScan), and at 0 s they are 37.97 km/h versus 38 Drive Recorder metadata and the data recorded in km/h. Similar agreement is observed across all the EDR system via CrashScan. The time intermediate points. synchronization of both data sources demonstrated These small deviations can be attributed to mutual consistency throughout the entire pre-crash rounding in the EDR output and differences in interval, with differences in individual speed values internal data processing or sampling resolution remaining minimal and generally limited to between the two systems. The metadata provide rounding effects. This confirms that these are two higher numerical precision, while CrashScan data independent yet mutually corroborating sources of are typically presented as rounded integer values. technical evidence, significantly increasing the reliability of the reconstructed vehicle motion and metadata CrashScan data accident course. time velocity time velocity time corr UTC (km/h) (s) (km/h) The agreement between CrashScan EDR 15:33:37 10.03333 96.66 -5 96 data and camera-based metadata further supports 15:33:37 10.53333 105.83 -4.5 105 15:33:38 11.03226 102.89 -4 103 the correctness of the interpretation of the pre-crash 15:33:38 11.51613 101.27 -3.5 101 phase, particularly with respect to the sequence of 15:33:39 12.03333 102.08 -3 102 acceleration, subsequent release of the accelerator 15:33:39 12.53333 97.03 -2.5 97 pedal, and intensive braking approximately 2.5 15:33:40 13.03333 86.05 -2 86 15:33:40 13.53333 75.55 -1.5 76 seconds prior to impact. The correlation between the 15:33:41 14.03226 60.05 -1 60 impact speed determined from EDR data (≈ 38 15:33:41 14.51613 47.02 -0.5 47 km/h) and the value identified from video analysis at 15:33:42 15.03333 37.97 0 38 the corresponding time represents a key validation element confirming the technical accuracy of both Overall, the comparison confirms a high datasets. level of consistency between independent data At the same time, the analysis highlights that sources. The strong agreement in both temporal the evaluation of delta-V (Δv) requires increasedalignment and velocity magnitude supports the expert attention. The Δv values reported in the EDRreliability and validity of the recorded vehicle speed
Source page 18
Read page 18 extracted text
Extracted text may not preserve table columns. Refer to the page image or original PDF for data relationships.
output represent processed and time-reduced data generated by the internal algorithms of the Airbag Control Unit (ACU), including filtering, integration, and downsampling. When compared with Δv calculated from high-resolution crash pulse data (500 Hz) from CrashScan report, local deviations were identified, resulting from differences in temporal resolution and partial loss of detail due to data reduction to 100 Hz. A particularly important factor is the influence of braking during the impact itself. In cases where the crash pulse duration is relatively long (approximately 240 ms in this case), part of the recorded longitudinal deceleration may be attributable not only to vehicle deformation and interaction, but also to active braking. If not properly considered, this effect may lead to an overestimation of Δv. For these reasons, it is essential that in forensic traffic accident analysis, the Δv value is always verified through independent calculation based on crash pulse data, preferably using higher sampling frequencies. Such an approach allows elimination of the effects of internal ACU signal processing and enables identification of potential deviations caused by external factors such as braking or secondary dynamic interactions during the collision. Ing. Peter Vertal, Ph.D. Institute of Forensic Engineering, VERTAL Consulting info@vertal.sk