
Source page 1
Read extracted page text
The original page preserves equations, table columns and typography. The extracted transcript may contain spacing errors from the source font.
Validation of Event Data Recorder Speed Measurements in Real-World Crashes for Forensic Analysis Alireza Jafari Anarkooli Theunis Botha Jason Bayley Brian Hsu Abstract jective data is invaluable for crash reconstruction, forensic analysis, and ongoing vehicle safety improvements. The There is an increasing interest in leveraging Event Data development and deployment of EDR technology have Recorder (EDR) technology for forensic crash analysis been pursued by government agencies and the automotive and road safety research. While prior studies have largely industry since the late 1990s. The National Transporta- focused on validating EDR speed measurements in con- tion Safety Board (NTSB) formally recommended crash trolled environments, this study presents a real-world data recording in 1997, followed by the National High- evaluation by comparing EDR-recorded vehicle speeds way Traffic Safety Administration (NHTSA) convening with independent data obtained from Global Positioning working groups in 1998 to assess EDR feasibility [1]. A System (GPS) tracking devices. The analysis includes 12 significant regulatory milestone was reached in 2006 when vehicular crashes that occurred in South Africa between NHTSA issued Federal Rulemaking (49 CFR Part 563), 2021 and 2025, including diverse vehicle types and crash effective in 2012. This standard established uniform re- scenarios. EDR data—recorded at fixed 0.5-second inter- quirements for EDRs in vehicles equipped with frontal vals in the five seconds preceding each crash—was syn- airbags, mandating a set of crash-relevant data elements, chronized with GPS measurements with varying intervals. including speed, acceleration, and braking, along with de- Statistical comparisons—including mean absolute error fined durations and sampling rates [2]. The adoption of (MAE), root mean square error (RMSE), and mean ab- EDR technology has since become nearly universal in the solute percentage error (MAPE)—along with speed pro- United States, with approximately 99.5% of new light ve- file visualizations revealed strong alignment between the hicles by model year 2021 incorporating EDRs compli- two datasets. The mean absolute difference in speed ant with Part 563 [2]. Globally, similar mandates have was 1.69 km/h (1.71%), falling well within the accu- emerged, such as the European Union’s General Safety racy thresholds defined by the National Highway Traf- Regulation (EU 2019/2144), which requires EDRs from fic Safety Administration (NHTSA). The results under- mid-2024 for all new vehicles [3]. The widespread gov- score the reliability and robustness of EDR technology for ernmental mandates for EDRs highlight the critical im- reconstructing crash dynamics in real-world conditions. portance of validating the accuracy and reliability of the While occasional discrepancies were observed—primarily data they capture. The main body of existing studies con- due to limitations in GPS recordings during rapid speed cerning EDR validation is primarily based on controlled changes—the overall findings affirm the forensic utility of experimental settings, such as crash tests and linear sled EDRs. This study provides empirical evidence support- tests. While these controlled environments are indispens- ing the integration of EDR data into legal, engineering, able for isolating specific variables and establishing base- and policy frameworks for crash investigation and traffic line performance, they inherently fall short in replicating safety advancement. the intricate complexities of real-world collisions. Such controlled conditions often lack authentic real-world fac- tors, including diverse road surface conditions, driver in- 1. Introduction puts, and the intricate dynamics of multi-vehicle interac- tions. This study endeavors to bridge this critical research Event Data Recorders (EDRs) are specialized onboard de- gap by evaluating the accuracy and reliability of EDR vices integrated into modern vehicles, designed to capture speed measurements within a real-world environment, high-frequency data during the critical seconds surround- drawing data from actual collisions. The primary objec- ing a collision. Functioning similar to ”black boxes” in tive is to compare EDR-recorded speed data with inde- aviation, EDRs record essential information such as pre- pendent speed measurements obtained from GPS track- crash speed, vehicle dynamics, driver inputs, crash sig- ing across a diverse set of real-world crashes. natures, and restraint deployment parameters for a brief period before, during, and after an impact [1]. This ob- 1
Source page 2
Read extracted page text
The original page preserves equations, table columns and typography. The extracted transcript may contain spacing errors from the source font.
Collision Sciences Inc. EDR Validation Paper 2. Literature Review and GPS-derived vehicle speed data from actual crashes across different types of collisions. This includes rear- end, frontal, single-vehicle rollovers, and run-off-road in-Researchers use a variety of methods to validate EDR cidents. The primary aim is to quantitatively assess EDRoutputs. Controlled testing remains the most prevalent accuracy, including offsets and variability, and to identifymethod for validating EDR outputs [4, 5, 6, 7, 8]. This any systematic biases under known real-world conditions.approach typically involves subjecting vehicles equipped with EDRs to instrumented crash tests or deceleration runs, with reference sensors such as accelerometers, opti- 3. Methodology cal speed gauges, GPS, or high-speed cameras providing ”ground truth” data. For instance, Lawrence et al. [9] 3.1 Data Collection conducted tests on three GM cars, driving them at con- stant speeds ranging from 1 to 150 km/h, artificially trig- For each crash investigated in this study, data was primar- gering EDRs, and comparing the readings to a calibrated ily sourced from two distinct sources: EDR reports and 5th-wheel speed sensor. Their findings indicated that independent GPS tracking data. EDR reports were gen- EDR error varied with speed, showing an overestimate erated using the CrashScan App developed by Collision of approximately 1.5 km/h at very low speeds and an un- Sciences company. This application utilizes a Bluetooth derestimate of 3.7 km/h at 150 km/h. Tsoi et al. [10] an- adapter to scan the vehicle’s computer modules, includ- alyzed 41 EDRs from multiple manufacturers subjected ing the EDR, and transmit the collected data to insurer to 56 km/h frontal NHTSA New Car Assessment Pro- systems via a cloud framework. The EDR data encom- gram (NCAP) tests, reporting an average absolute error passed metrics such as impact severity, steering angle, in pre-crash speed of only 0.58 km/h, or approximately braking inputs, vehicle control history (e.g., sudden brak- 1.0%. Similarly, in barrier crash tests conducted at speeds ing, turning, Vehicle Stability Control, Traction Control, between 40 and 64 km/h, Niehoff et al. [11] reported Anti-lock Braking System activations), vehicle specifica- EDR speeds to be ”within 1 mph” of instrumentation tions (e.g., VIN, tire size, mileage), environmental condi- on average, while Gabler et al. [12] found them ”within tions (e.g., road type, speed limits), and calculated stop- 3%” with few outliers. More recently, Nouzovsk´y et al. ping distances. The second data source comprised GPS [13] performed impact tests comparing EDR data with tracking data provided by independent companies. While an independent measurement system. Their results sup- the details of GPS data varied across cases, it generally port the reliability of EDR data for forensic analysis and included timestamped vehicle movements, ignition status, collision reconstruction. In general, previous controlled odometer readings, real-time speeds, latitude and longi- studies consistently demonstrate that in typical driving tude coordinates, and precise street-level location iden- and crash scenarios, EDR-recorded vehicle speed gener- tifiers. The initial dataset for this study consisted of 40 ally closely approximates the actual speed, with errors crashes, all of which consistent EDR speed recording in- typically limited to a few kilometers per hour or a few per- tervals of 0.5 seconds. However, for several cases, it was cent. While controlled experimental studies offer invalu- observed that the GPS data were not sufficiently recorded able insights and establish baseline performance, they in- close to the crash event. To ensure meaningful compar- herently struggle to fully replicate the diverse and unpre- ative analysis, a filtering criteria was applied: only cases dictable nature of real-world crashes. Factors such as sur- where the GPS tracking measurement interval was less face irregularities, varying driver responses, and complex than 2 seconds were selected. Since the majority of the multi-vehicle interactions are difficult to model accurately GPS recordings had been recorded in intervals more than in laboratory settings. For instance, Nouzovsk´y et al. [13] 2 sec, the process led to a final dataset of 12 distinct observed that even in controlled environments, variations crashes that occurred in South Africa between 2021 and in sensor sampling rates and placement can contribute to 2025. The crash types include guardrail impacts, run- discrepancies between EDR data and independent mea- off-road incidents (including ditch impacts, rollovers, and surement systems. Despite the recognized limitations of fixed object collisions), frontal collisions, right-angle col- controlled settings, there are very few studies validating lisions, and rear-end crashes. A summary of the charac- EDR data in real-world crashes. One notable exception is teristics for each of the 12 crashes is provided in Table the work by Han [14], who validated EDR speed in real- 1. world intersection crashes using dual methods. For cases where dashcam video was available, vehicle speed was es- 3.2 Synchronization and Analysis timated from the video, showing close agreement with EDR-reported speed. In instances where video was un- Accurate synchronization of EDR and GPS speed mea- available, a physics-based rigid-body collision model was surements was paramount to ensure meaningful compar- employed to estimate speed, which also matched EDR ative analysis. The process involved aligning the time- speeds with high accuracy. Building upon previous ef- series data from both sources to a common temporal ref- forts and addressing the persistent research gap, the cur- erence point, typically the moment of impact or a defined rent study is among the first to directly compare EDR pre-crash event. EDR speeds are typically recorded at 2
Source page 3
Read extracted page text
The original page preserves equations, table columns and typography. The extracted transcript may contain spacing errors from the source font.
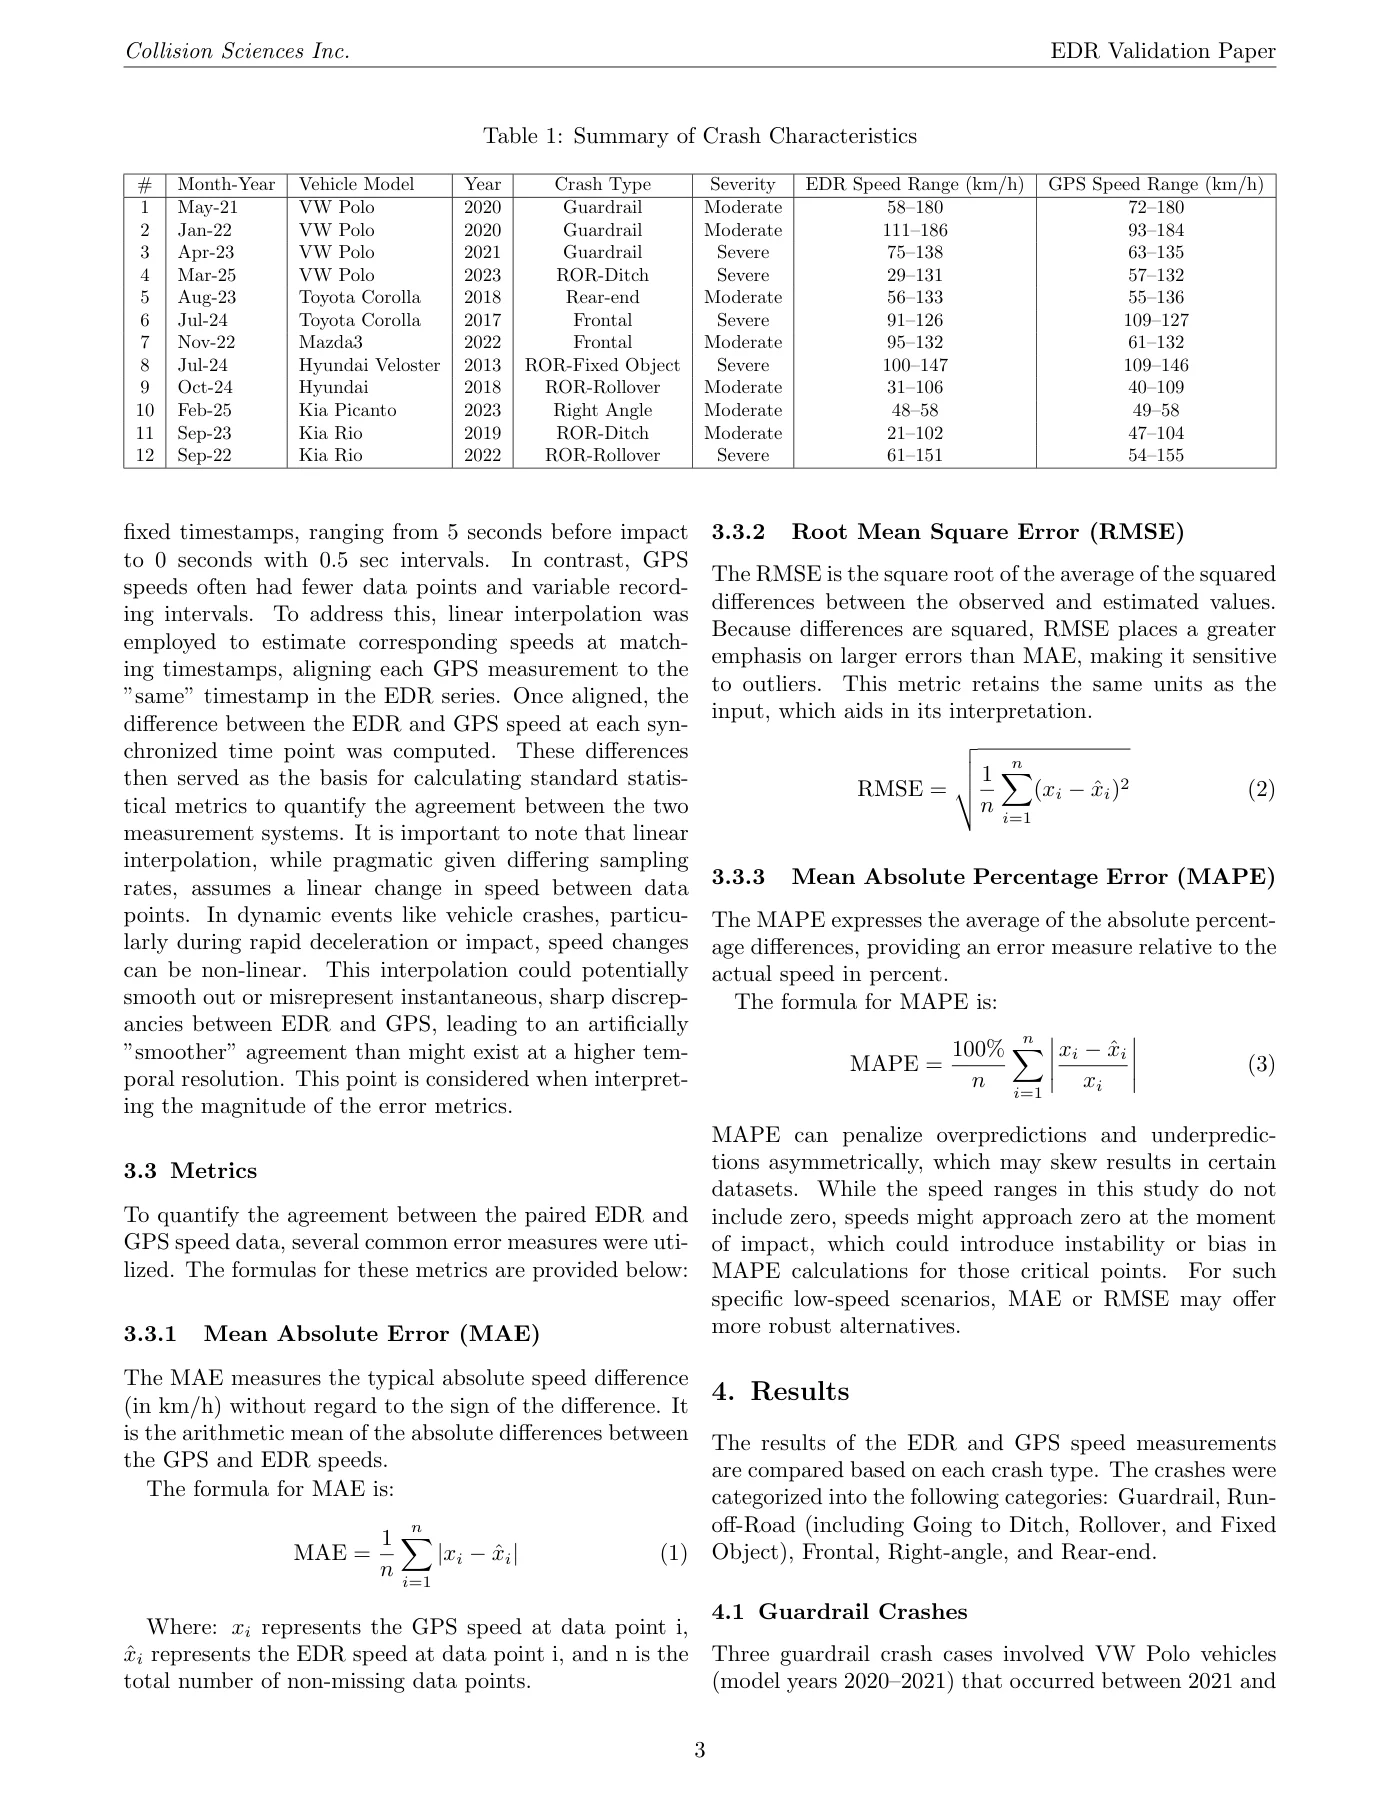
Collision Sciences Inc. EDR Validation Paper Table 1: Summary of Crash Characteristics # Month-Year Vehicle Model Year Crash Type Severity EDR Speed Range (km/h) GPS Speed Range (km/h) 1 May-21 VW Polo 2020 Guardrail Moderate 58–180 72–180 2 Jan-22 VW Polo 2020 Guardrail Moderate 111–186 93–184 3 Apr-23 VW Polo 2021 Guardrail Severe 75–138 63–135 4 Mar-25 VW Polo 2023 ROR-Ditch Severe 29–131 57–132 5 Aug-23 Toyota Corolla 2018 Rear-end Moderate 56–133 55–136 6 Jul-24 Toyota Corolla 2017 Frontal Severe 91–126 109–127 7 Nov-22 Mazda3 2022 Frontal Moderate 95–132 61–132 8 Jul-24 Hyundai Veloster 2013 ROR-Fixed Object Severe 100–147 109–146 9 Oct-24 Hyundai 2018 ROR-Rollover Moderate 31–106 40–109 10 Feb-25 Kia Picanto 2023 Right Angle Moderate 48–58 49–58 11 Sep-23 Kia Rio 2019 ROR-Ditch Moderate 21–102 47–104 12 Sep-22 Kia Rio 2022 ROR-Rollover Severe 61–151 54–155 fixed timestamps, ranging from 5 seconds before impact 3.3.2 Root Mean Square Error (RMSE) to 0 seconds with 0.5 sec intervals. In contrast, GPS The RMSE is the square root of the average of the squared speeds often had fewer data points and variable record- differences between the observed and estimated values. ing intervals. To address this, linear interpolation was Because differences are squared, RMSE places a greater employed to estimate corresponding speeds at match- emphasis on larger errors than MAE, making it sensitive ing timestamps, aligning each GPS measurement to the to outliers. This metric retains the same units as the ”same” timestamp in the EDR series. Once aligned, the input, which aids in its interpretation. difference between the EDR and GPS speed at each syn- chronized time point was computed. These differences v n u 1then served as the basis for calculating standard statis- u RMSE = X(xi −ˆxi)2 (2)tical metrics to quantify the agreement between the two t n i=1 measurement systems. It is important to note that linear interpolation, while pragmatic given differing sampling 3.3.3 Mean Absolute Percentage Error (MAPE)rates, assumes a linear change in speed between data points. In dynamic events like vehicle crashes, particu- The MAPE expresses the average of the absolute percent- larly during rapid deceleration or impact, speed changes age differences, providing an error measure relative to the can be non-linear. This interpolation could potentially actual speed in percent. smooth out or misrepresent instantaneous, sharp discrep- The formula for MAPE is: ancies between EDR and GPS, leading to an artificially n ”smoother” agreement than might exist at a higher tem- 100% xi −ˆxi MAPE = X (3) poral resolution. This point is considered when interpret- n xi i=1 ing the magnitude of the error metrics. MAPE can penalize overpredictions and underpredic- tions asymmetrically, which may skew results in certain3.3 Metrics datasets. While the speed ranges in this study do not To quantify the agreement between the paired EDR and include zero, speeds might approach zero at the moment GPS speed data, several common error measures were uti- of impact, which could introduce instability or bias in lized. The formulas for these metrics are provided below: MAPE calculations for those critical points. For such specific low-speed scenarios, MAE or RMSE may offer more robust alternatives.3.3.1 Mean Absolute Error (MAE) The MAE measures the typical absolute speed difference 4. Results (in km/h) without regard to the sign of the difference. It is the arithmetic mean of the absolute differences between The results of the EDR and GPS speed measurements the GPS and EDR speeds. are compared based on each crash type. The crashes were The formula for MAE is: categorized into the following categories: Guardrail, Run- n off-Road (including Going to Ditch, Rollover, and Fixed 1 MAE = X |xi −ˆxi| (1) Object), Frontal, Right-angle, and Rear-end. n i=1 4.1 Guardrail Crashes Where: xi represents the GPS speed at data point i, ˆxi represents the EDR speed at data point i, and n is the Three guardrail crash cases involved VW Polo vehicles total number of non-missing data points. (model years 2020–2021) that occurred between 2021 and 3
Source page 4
Read extracted page text
The original page preserves equations, table columns and typography. The extracted transcript may contain spacing errors from the source font.
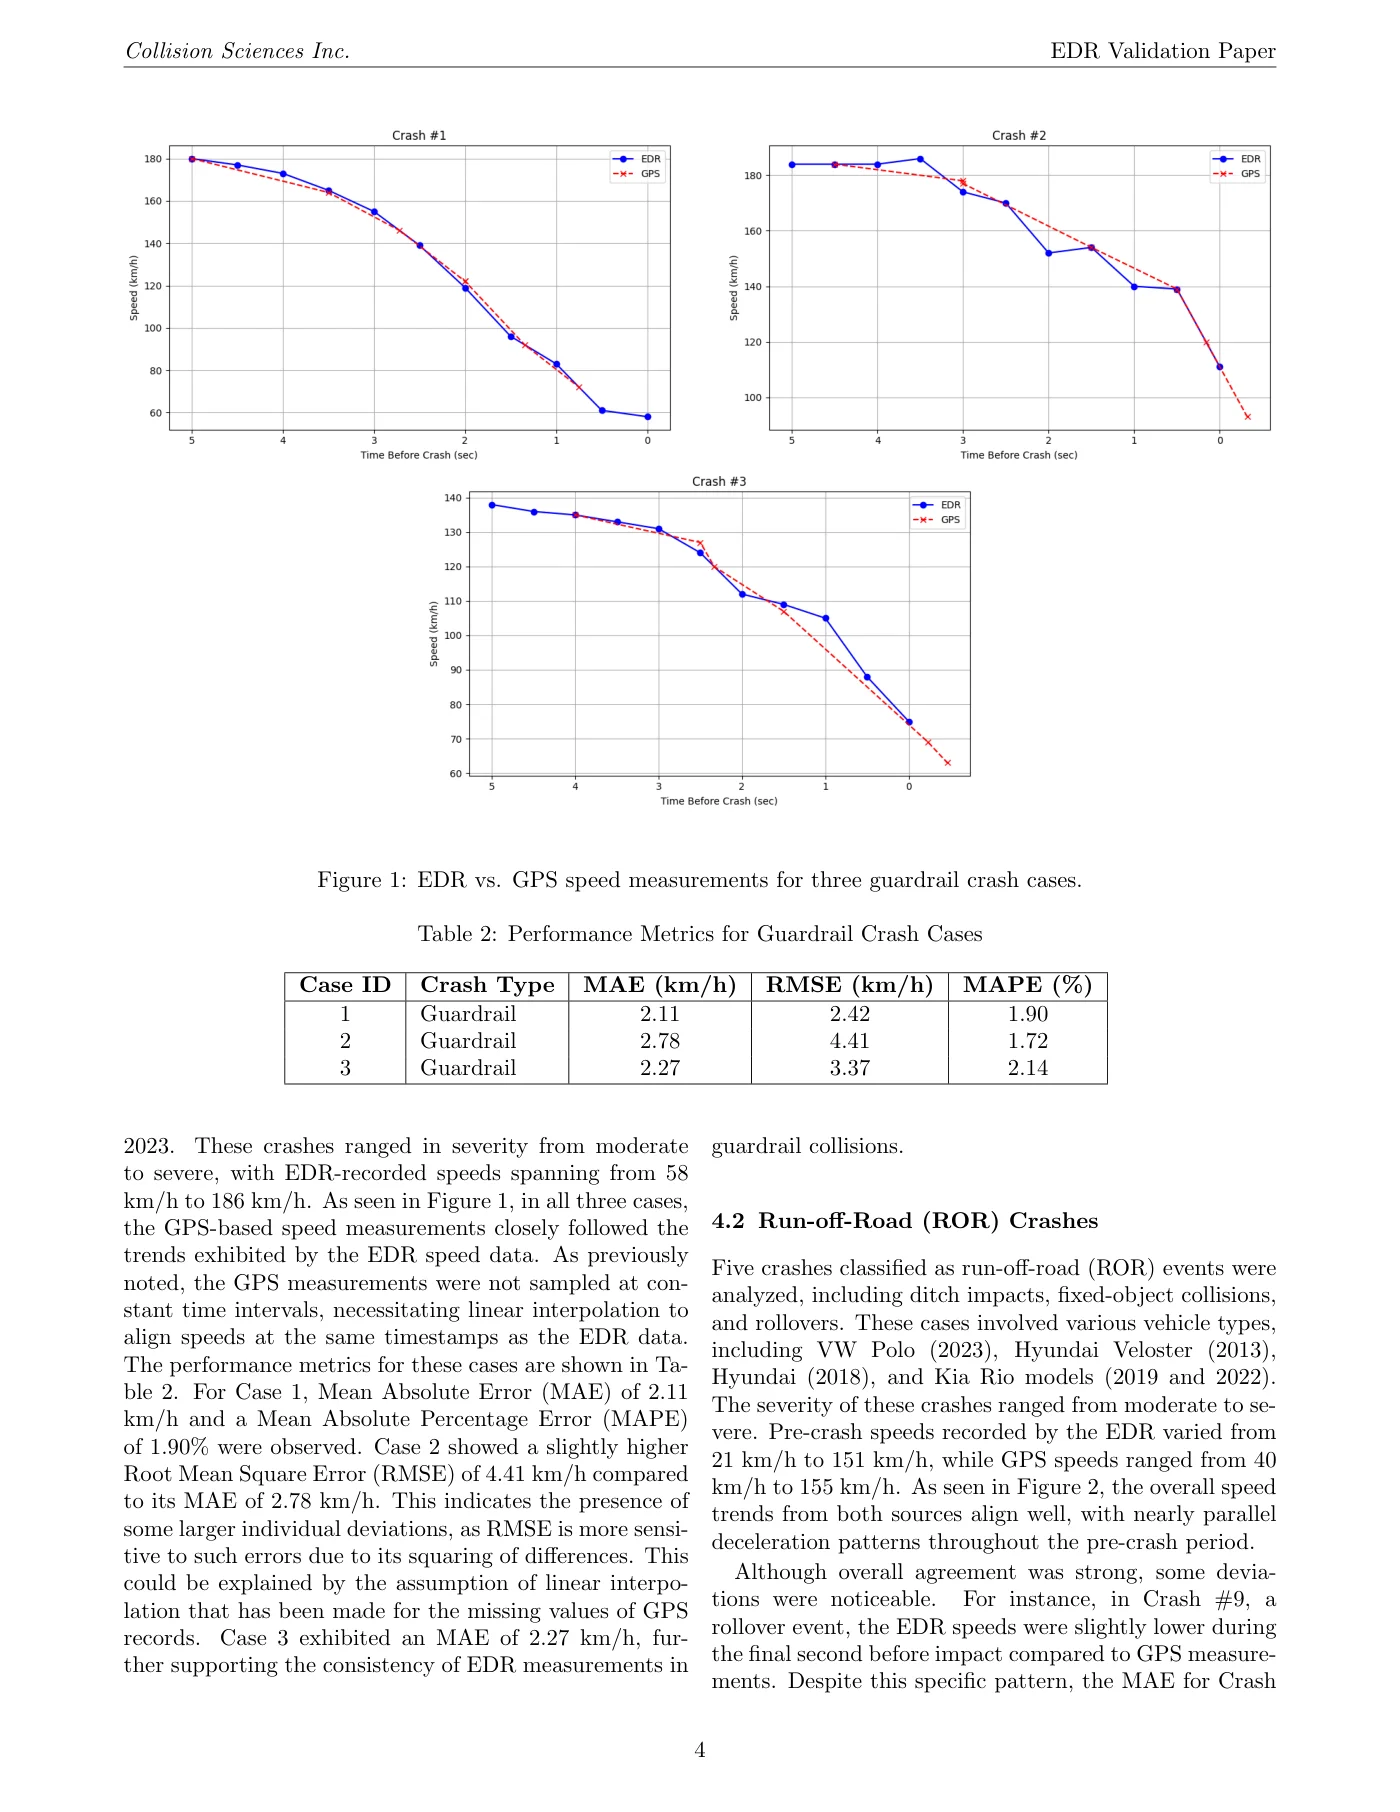
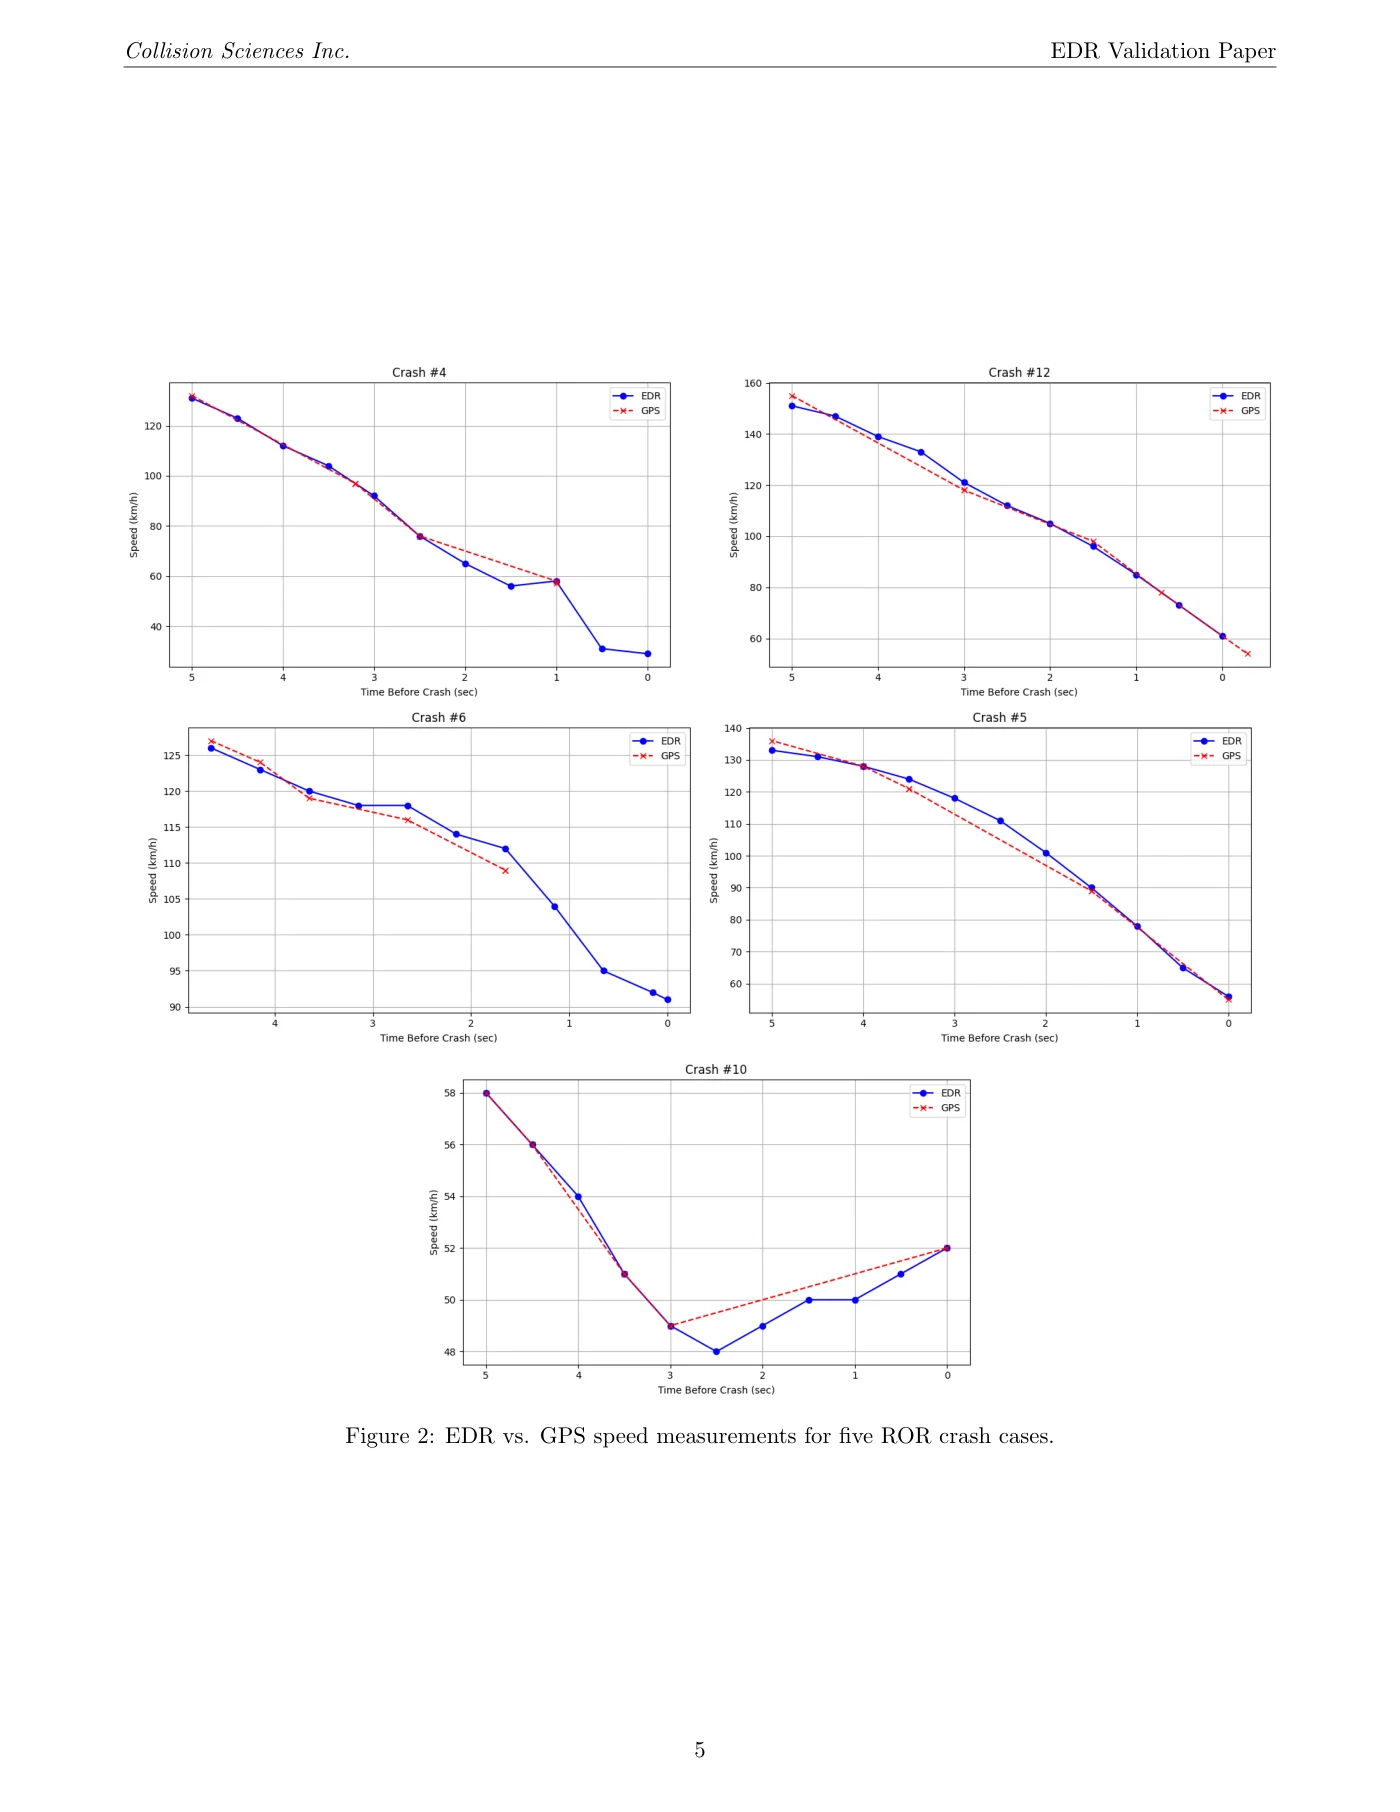
Collision Sciences Inc. EDR Validation Paper Figure 1: EDR vs. GPS speed measurements for three guardrail crash cases. Table 2: Performance Metrics for Guardrail Crash Cases Case ID Crash Type MAE (km/h) RMSE (km/h) MAPE (%) 1 Guardrail 2.11 2.42 1.90 2 Guardrail 2.78 4.41 1.72 3 Guardrail 2.27 3.37 2.14 2023. These crashes ranged in severity from moderate guardrail collisions. to severe, with EDR-recorded speeds spanning from 58 km/h to 186 km/h. As seen in Figure 1, in all three cases, 4.2 Run-off-Road (ROR) Crashesthe GPS-based speed measurements closely followed the trends exhibited by the EDR speed data. As previously Five crashes classified as run-off-road (ROR) events were noted, the GPS measurements were not sampled at con- analyzed, including ditch impacts, fixed-object collisions, stant time intervals, necessitating linear interpolation to and rollovers. These cases involved various vehicle types, align speeds at the same timestamps as the EDR data. including VW Polo (2023), Hyundai Veloster (2013), The performance metrics for these cases are shown in Ta- Hyundai (2018), and Kia Rio models (2019 and 2022). ble 2. For Case 1, Mean Absolute Error (MAE) of 2.11 The severity of these crashes ranged from moderate to se- km/h and a Mean Absolute Percentage Error (MAPE) vere. Pre-crash speeds recorded by the EDR varied from of 1.90% were observed. Case 2 showed a slightly higher 21 km/h to 151 km/h, while GPS speeds ranged from 40 Root Mean Square Error (RMSE) of 4.41 km/h compared km/h to 155 km/h. As seen in Figure 2, the overall speed to its MAE of 2.78 km/h. This indicates the presence of trends from both sources align well, with nearly parallel some larger individual deviations, as RMSE is more sensi- deceleration patterns throughout the pre-crash period. tive to such errors due to its squaring of differences. This Although overall agreement was strong, some devia- could be explained by the assumption of linear interpo- tions were noticeable. For instance, in Crash #9, a lation that has been made for the missing values of GPS rollover event, the EDR speeds were slightly lower during records. Case 3 exhibited an MAE of 2.27 km/h, fur- the final second before impact compared to GPS measure- ther supporting the consistency of EDR measurements in ments. Despite this specific pattern, the MAE for Crash 4
Source page 5
Read extracted page text
The original page preserves equations, table columns and typography. The extracted transcript may contain spacing errors from the source font.
Collision Sciences Inc. EDR Validation Paper Figure 2: EDR vs. GPS speed measurements for five ROR crash cases. 5
Source page 6
Read extracted page text
The original page preserves equations, table columns and typography. The extracted transcript may contain spacing errors from the source font.
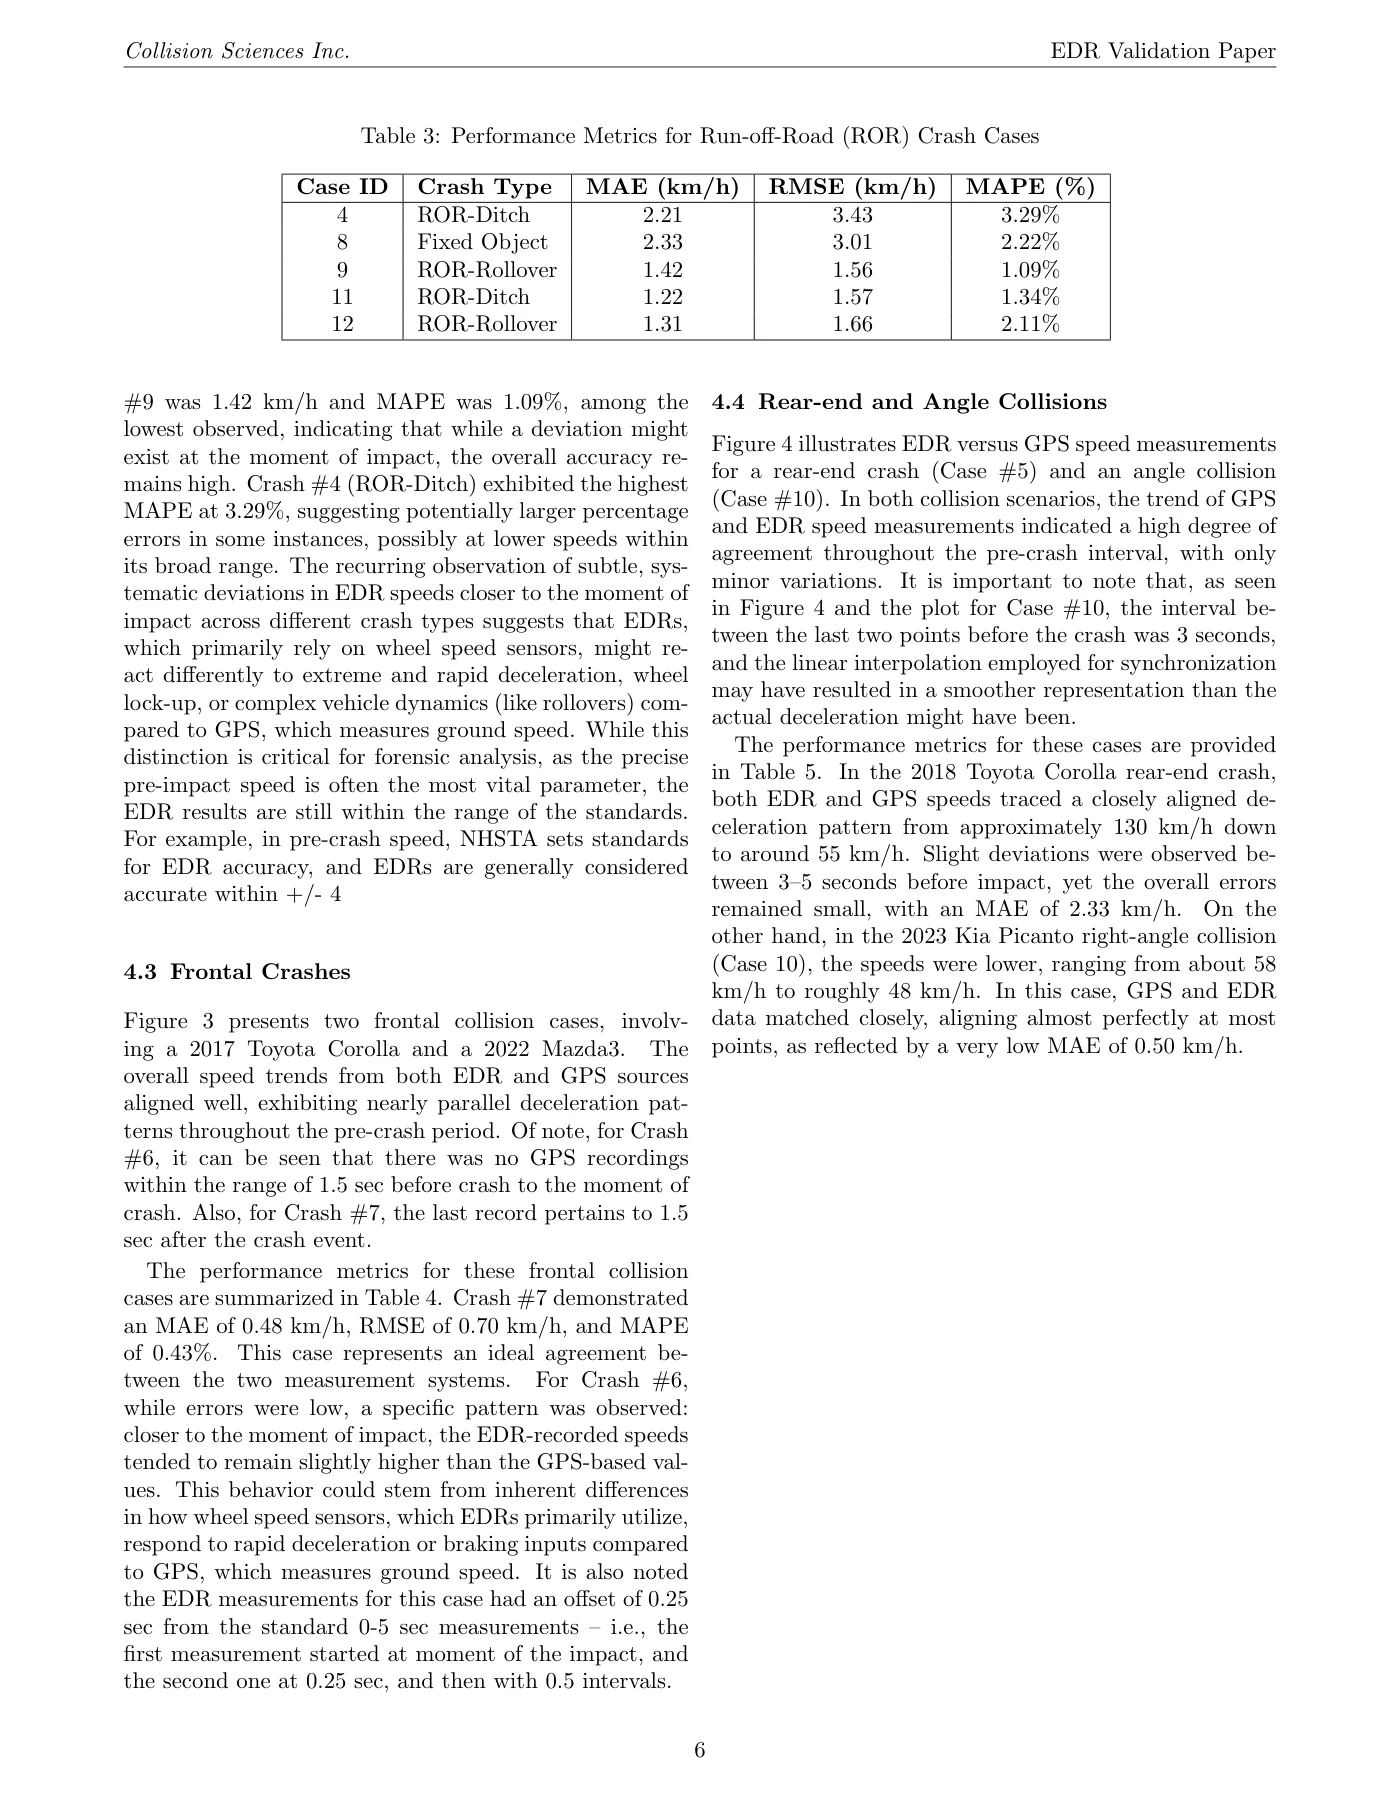
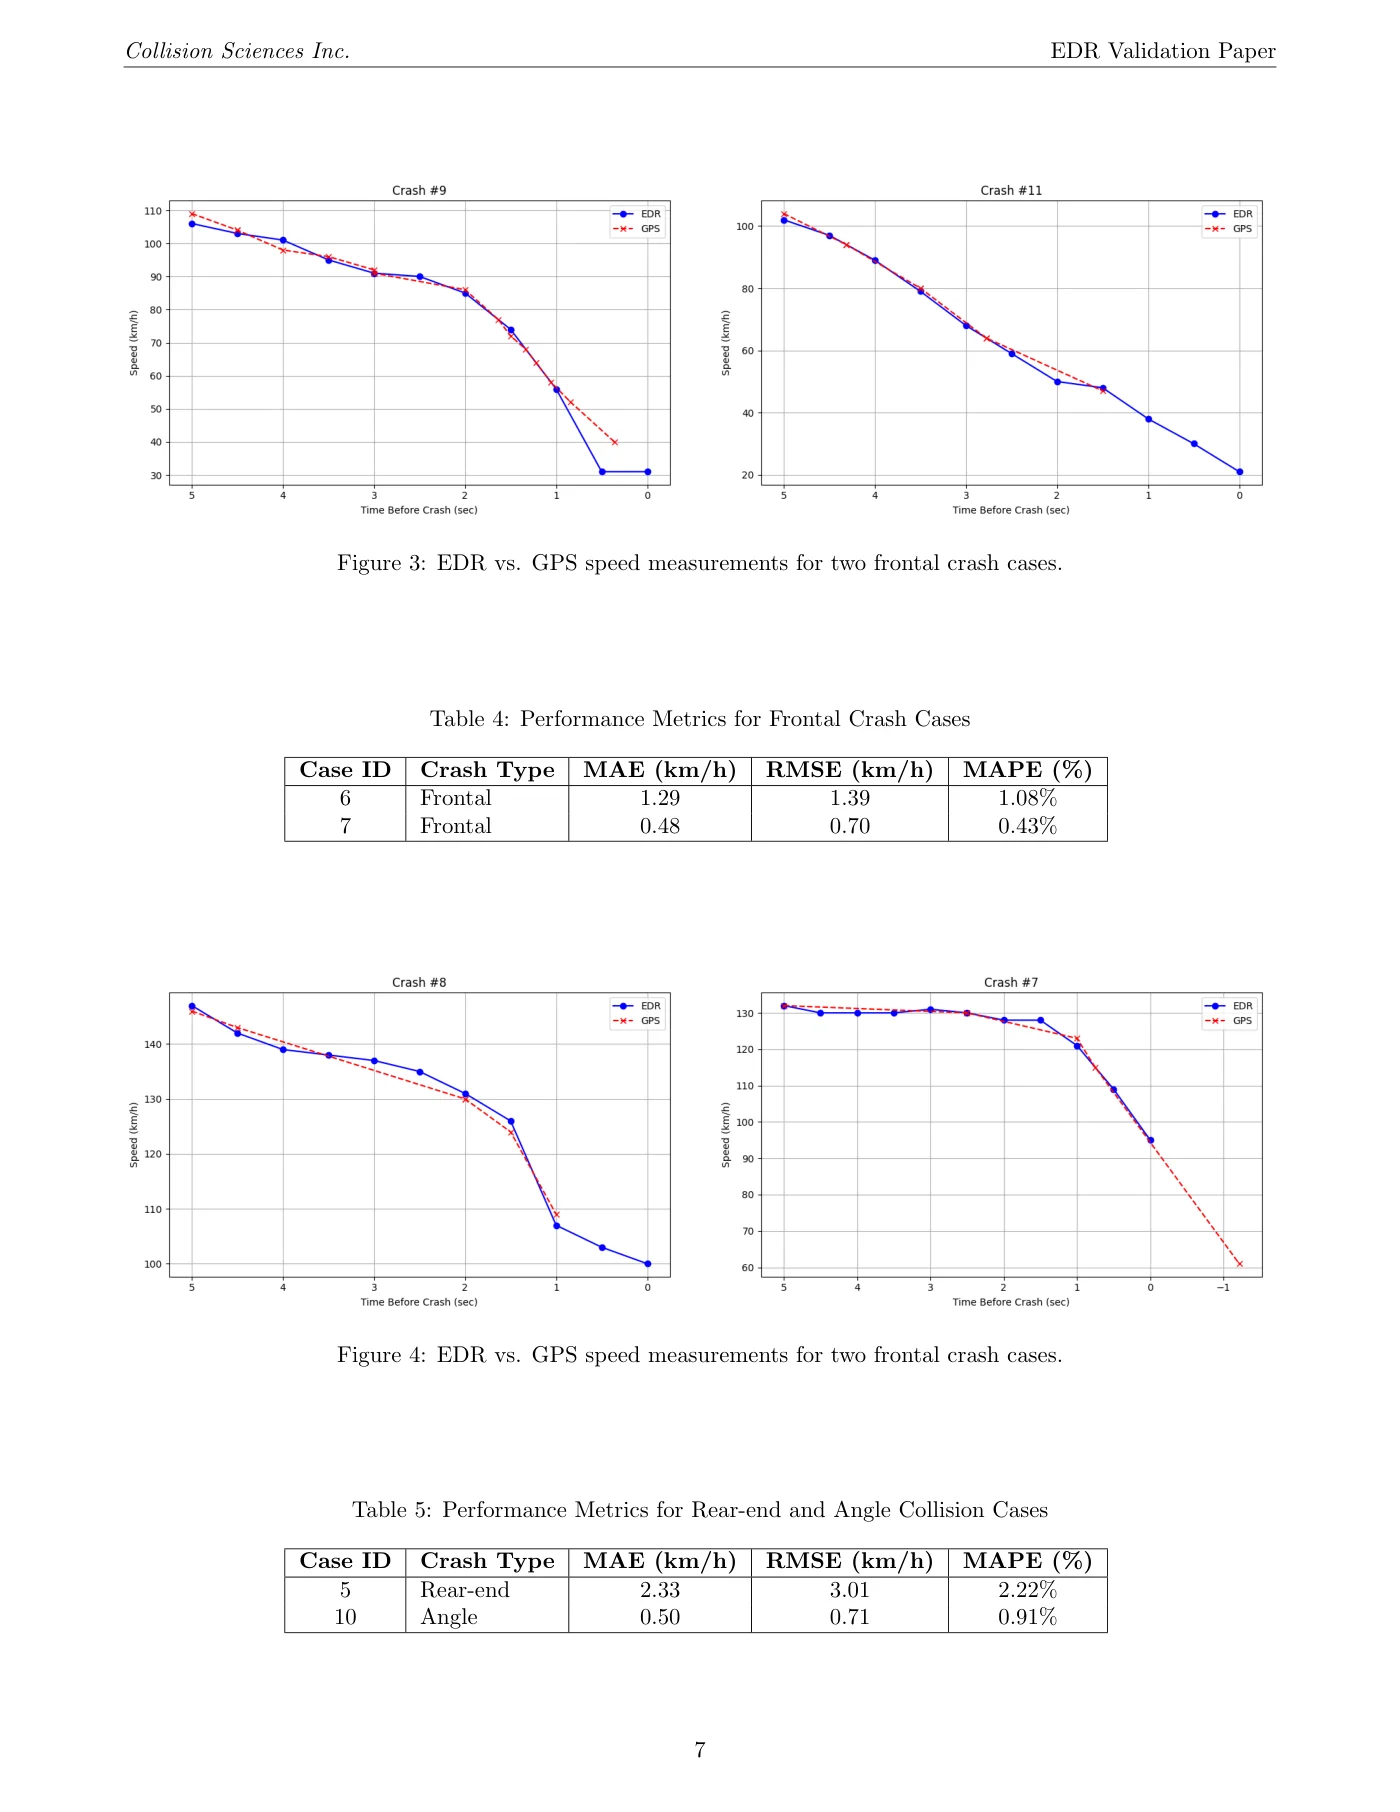
Collision Sciences Inc. EDR Validation Paper Table 3: Performance Metrics for Run-off-Road (ROR) Crash Cases Case ID Crash Type MAE (km/h) RMSE (km/h) MAPE (%) 4 ROR-Ditch 2.21 3.43 3.29% 8 Fixed Object 2.33 3.01 2.22% 9 ROR-Rollover 1.42 1.56 1.09% 11 ROR-Ditch 1.22 1.57 1.34% 12 ROR-Rollover 1.31 1.66 2.11% #9 was 1.42 km/h and MAPE was 1.09%, among the 4.4 Rear-end and Angle Collisions lowest observed, indicating that while a deviation might Figure 4 illustrates EDR versus GPS speed measurements exist at the moment of impact, the overall accuracy re- for a rear-end crash (Case #5) and an angle collision mains high. Crash #4 (ROR-Ditch) exhibited the highest (Case #10). In both collision scenarios, the trend of GPS MAPE at 3.29%, suggesting potentially larger percentage and EDR speed measurements indicated a high degree of errors in some instances, possibly at lower speeds within agreement throughout the pre-crash interval, with only its broad range. The recurring observation of subtle, sys- minor variations. It is important to note that, as seen tematic deviations in EDR speeds closer to the moment of in Figure 4 and the plot for Case #10, the interval be- impact across different crash types suggests that EDRs, tween the last two points before the crash was 3 seconds, which primarily rely on wheel speed sensors, might re- and the linear interpolation employed for synchronization act differently to extreme and rapid deceleration, wheel may have resulted in a smoother representation than the lock-up, or complex vehicle dynamics (like rollovers) com- actual deceleration might have been. pared to GPS, which measures ground speed. While this The performance metrics for these cases are provided distinction is critical for forensic analysis, as the precise in Table 5. In the 2018 Toyota Corolla rear-end crash, pre-impact speed is often the most vital parameter, the both EDR and GPS speeds traced a closely aligned de- EDR results are still within the range of the standards. celeration pattern from approximately 130 km/h down For example, in pre-crash speed, NHSTA sets standards to around 55 km/h. Slight deviations were observed be- for EDR accuracy, and EDRs are generally considered tween 3–5 seconds before impact, yet the overall errors accurate within +/- 4 remained small, with an MAE of 2.33 km/h. On the other hand, in the 2023 Kia Picanto right-angle collision (Case 10), the speeds were lower, ranging from about 584.3 Frontal Crashes km/h to roughly 48 km/h. In this case, GPS and EDR Figure 3 presents two frontal collision cases, involv- data matched closely, aligning almost perfectly at most ing a 2017 Toyota Corolla and a 2022 Mazda3. The points, as reflected by a very low MAE of 0.50 km/h. overall speed trends from both EDR and GPS sources aligned well, exhibiting nearly parallel deceleration pat- terns throughout the pre-crash period. Of note, for Crash #6, it can be seen that there was no GPS recordings within the range of 1.5 sec before crash to the moment of crash. Also, for Crash #7, the last record pertains to 1.5 sec after the crash event. The performance metrics for these frontal collision cases are summarized in Table 4. Crash #7 demonstrated an MAE of 0.48 km/h, RMSE of 0.70 km/h, and MAPE of 0.43%. This case represents an ideal agreement be- tween the two measurement systems. For Crash #6, while errors were low, a specific pattern was observed: closer to the moment of impact, the EDR-recorded speeds tended to remain slightly higher than the GPS-based val- ues. This behavior could stem from inherent differences in how wheel speed sensors, which EDRs primarily utilize, respond to rapid deceleration or braking inputs compared to GPS, which measures ground speed. It is also noted the EDR measurements for this case had an offset of 0.25 sec from the standard 0-5 sec measurements – i.e., the first measurement started at moment of the impact, and the second one at 0.25 sec, and then with 0.5 intervals. 6
Source page 7
Read extracted page text
The original page preserves equations, table columns and typography. The extracted transcript may contain spacing errors from the source font.
Collision Sciences Inc. EDR Validation Paper Figure 3: EDR vs. GPS speed measurements for two frontal crash cases. Table 4: Performance Metrics for Frontal Crash Cases Case ID Crash Type MAE (km/h) RMSE (km/h) MAPE (%) 6 Frontal 1.29 1.39 1.08% 7 Frontal 0.48 0.70 0.43% Figure 4: EDR vs. GPS speed measurements for two frontal crash cases. Table 5: Performance Metrics for Rear-end and Angle Collision Cases Case ID Crash Type MAE (km/h) RMSE (km/h) MAPE (%) 5 Rear-end 2.33 3.01 2.22% 10 Angle 0.50 0.71 0.91% 7
Source page 8
Read extracted page text
The original page preserves equations, table columns and typography. The extracted transcript may contain spacing errors from the source font.
Collision Sciences Inc. EDR Validation Paper 5. Discussion of the ”error” might stem from the limitations of the GPS reference itself. Based on the limitations identified, The findings of this study demonstrate robust consis- future research should explore the integration of multi- tency and accuracy in EDR speed measurements when ple, diverse independent validation methods for ground validated against independent GPS data in real-world truth data to triangulate true EDR accuracy more ro- crashes. The average absolute speed difference of 1.69 bustly. This could include employing high-speed cam- kph and the average error in percentage of 1.7% fall well eras or advanced inertial measurement units, which may within the established precision standards for EDRs and offer greater precision or resilience to environmental in- align favorably with the existing body of validation liter- terference than GPS in certain contexts. Additionally, ature derived from controlled experimental settings. For it is recommended to expand the scope of validation to example, Lawrence et al. [9] reported an overall uncer- include other critical EDR-recorded parameters beyond tainty for GM SDM pre-crash speed ranging from an over- speed, such as DeltaV, steering angle, and braking force. estimation of 1.5 km/h at low speeds to an underestimate Such expanded validation would provide a more compre- of 3.7 km/h at high speeds in controlled experimental hensive assessment of EDR reliability across its full range settings. Similarly, Tsoi et al. [10] found an average ab- of forensic utility and reveal different error profiles asso- solute error of 0.58 km/h (1.0%) for pre-crash speed in ciated with distinct measurement principles. high-severity frontal barrier tests. The approximately 2 km/h average difference observed in this real-world study is comparable to results derived from controlled experi- 6. Conclusion mental conditions. A pivotal aspect of this research is its deliberate focus on real-world crashes, encompassing This research was an attempt to validate EDR speed mea- a wide range of collision types, severities, and speeds as surements against independent GPS data in a diverse set high as 186 km/h. While experimental studies provide of real-world crashes. The study’s findings demonstrate invaluable insights into EDR performance under isolated, the high accuracy and robustness of EDR speed data, ev- controlled conditions, they inherently face limitations in idenced by a low average absolute speed difference of 1.69 replicating the full spectrum of variables present in ac- km/h or average percentage of error of 1.7%. These re- tual accidents. The consistently high accuracy observed sults not only align with established precision standards in this real-world setting suggests that EDRs are robust for EDRs but also underscore their reliability even amidst in maintaining speed measurement integrity even amidst the complex and unpredictable dynamics of actual ve- the diverse complexities and unpredictable dynamics of hicular collisions. The findings significantly strengthen actual collisions. This is critical as prior studies identified the evidentiary value of EDRs, providing increased con- factors such as wheel slip during braking or acceleration fidence for accident reconstructionists, law enforcement as a significant source of pre-crash speed discrepancies. personnel, and legal professionals in relying on EDR speed data for accurate pre-impact speed determination, brak- The compelling findings of this study have direct and ing event analysis, and vehicle trajectory reconstruction.substantial implications for professionals involved in acci- Ultimately, this study reinforces the utility of EDR tech-dent reconstruction, law enforcement, and legal proceed- nology as a reliable and objective source of data for un-ings. The demonstrated high accuracy and reliability of derstanding complex real-world collision events.EDR speed data in real-world scenarios provide increased confidence for accident reconstructionists, law enforce- ment personnel, and legal professionals in relying on EDR References speed data. [1] National Highway Traffic Safety Administra- Limitations tion, “Event data recorder,” NHTSA, Ac- cessed: Jul. 29, 2025. [Online]. Available: Despite the compelling findings, it is important to ac- https://www.nhtsa.gov/research-data/event-data- knowledge certain limitations of the study that may affect recorder the generalizability and precision of its results. The use of GPS as an independent speed reference, while practical [2] Code of Federal Regulations, Title 49, Subtitle B, for real-world scenarios, has inherent limitations. GPS Chapter V, Part 563, “Event data recorders,” eCFR, measurements can be inconsistent and are susceptible to National Highway Traffic Safety Administration, up- various sources of interference, such as signal obstruction dated Jul. 22, 2025. Accessed: Jul. 29, 2025. [On- by buildings or dense foliage, which can degrade accu- line]. Available: https://www.ecfr.gov/current/title- racy. While efforts were made to mitigate these effects, 49/subtitle-B/chapter-V/part-563 such as filtering in for cases not prone to these errors based on crash location, it is plausible that some of the [3] InterRegs, “EU and UN ECE develop new regu- observed discrepancies between EDR and GPS measure- lations on event data recorders,” InterRegs Spot- ments might not solely represent EDR errors, as some light. Accessed: Jul. 29, 2025. [Online]. Available: 8
Source page 9
Read extracted page text
The original page preserves equations, table columns and typography. The extracted transcript may contain spacing errors from the source font.
Collision Sciences Inc. EDR Validation Paper https://www.interregs.com/articles/spotlight/235/eu- no. 5, pp. 897–902, Oct. 2019, doi: 10.1007/s12239- and-un-ece-develop-new-regulations-on-event-data- 019-0083-y. recorders [4] C. Wilkinson, J. Lawrence, B. Heinrichs, and D. King, “The accuracy and sensitivity of 2003 and 2004 General Motors event data recorders in low-speed barrier and vehicle collisions,” SAE Technical Paper 2005-01-1190, 2005, doi: 10.4271/2005-01-1190. [5] R. Ruth, C. King, A. Rich, and H. Sadrnia, “Ac- curacy of 2016–2022 EDRs in IIHS crash tests,” SAE Technical Paper 2024-01-2890, 2024, doi: 10.4271/2024-01-2890. [6] C. Gabler, C. Thor, and J. Hinch, “Preliminary eval- uation of advanced air bag field performance using event data recorders,” NHTSA, Report No. DOT HS 811 015, Aug. 2008. [7] R. Ruth, C. King, A. Rich, and H. Sadrnia, “Ac- curacy of powertrain control module (PCM) event data recorders,” SAE Technical Paper 2008-01-0162, 2008, doi: 10.4271/2008-01-0162. [8] S. Haight and R. Haight, “Analysis of event data recorder delta-V reporting in the IIHS small overlap crash test,” Collision Magazine, vol. 8, no. 2, pp. 8–23, 2013. [9] J. M. Lawrence, C. C. Wilkinson, B. E. Heinrichs, and D. J. King, “The accuracy of pre-crash speed captured by event data recorders,” SAE Technical Paper 2003-01-0889, Mar. 2003. [10] A. H. Tsoi, J. Hinch, R. Ruth, and H. Gabler, “Val- idation of event data recorders in high severity full frontal crash tests,” SAE Technical Paper 2013-01- 1265, Jul. 2013. [11] P. Niehoff, H. C. Gabler, C. Ragland, and C. Chidester, “Evaluation of event data recorders in full-system crash tests,” in Proc. 19th Int. Tech. Conf. Enhanced Safety of Vehicles (ESV), Washing- ton, DC, USA, Jun. 2005. [12] H. C. Gabler, J. Hinch, J. Brophy, C. Chidester, and C. Ragland, “Accuracy of event data recorders in full-system crash tests,” in Proc. 21st Int. Tech. Conf. Enhanced Safety of Vehicles (ESV), Stuttgart, Germany, Jun. 2009. [13] L. Nouzovsk´y, T. Kohout, P. Vrtal, and K. Ko- cian, “Validation of EDR data for the purpose of the forensic expertise,” in Proc. 2022 Smart City Symp. Prague (SCSP), Prague, Czech Republic, May 2022, pp. 1–6, doi: 10.1109/SCSP53804.2022.9866323. [14] I. Han, “Verification and complement of EDR speed data through the analysis of real-world vehicle col- lision accidents,” Int. J. Automot. Technol., vol. 20, 9