INSURANCE CLAIMS RESEARCH / 2026
Objective vehicle evidence. Better claims decisions.
The economic, operational and evidentiary case for integrating Event Data Recorder (EDR) data into auto insurance claims Comprehensive insurer white paper | U.S. market | October 2026 Collision Sciences Inc. | CrashScan EDR retrieval, contextual reporting and technical support
The opportunity is not simply to read a black box. It is to bring objective vehicle evidence into a claim early enough to confirm or change a decision, expedite a justified resolution, and document the financial result.
Prepared for claims leadership, special investigations, subrogation, technical claims, legal, operations and innovation teams. For methodology, public studies and detailed case examples, see Appendices A-D. The financial illustrations are scenarios, not claims of measured CrashScan savings. Contact: support@collisionsciences.ca | www.collision-sciences.com
01 / In this resource
Executive summary
Every disputed auto claim contains a decision problem: what happened, which event is relevant, what the available evidence supports, and whether that evidence can confirm, correct or accelerate a justified decision. Vehicle Event Data Recorders provide a distinctive answer: short-duration, vehicle-resident recordings of crash-related dynamics and selected driver and restraint-system states. CrashScan makes that evidence accessible through a supported-vehicle retrieval workflow, organized reporting, source-data support and engineering expertise. [R10] [R15]
CrashScan can contribute through three complementary outcomes: confirming the facts and supporting a justified payment; changing a material decision when the evidence warrants it; or accelerating a defensible resolution without necessarily changing the payment. The five measurable claims-value functions remain SIU triage, liability and subrogation, indemnity accuracy, litigation and expert expense, and handling efficiency. An evidence-supported confirmation can be just as operationally valuable as a correction when it avoids needless escalation. Financial gains must be measured separately from faster or fairer customer outcomes.
The industry research case is substantial, but it must be interpreted correctly. A major LexisNexis analysis of early claims data found lower expense, reduced attorney involvement and faster resolution across relevant claims cohorts. Verisk illustrates the economic importance of recovery opportunities. Deloitte and the Coalition quantify the scale of fraud-related exposure. CCC documents rising total-loss and bodily-injury complexity. These are industry context and mechanisms - not studies measuring CrashScan-specific returns. [R01-R07]
What the opportunity can look like
A hypothetical 1,000-attempt EDR program with 80% usable retrievals, 16% actionable findings among usable results and $5,000 in incremental realized value per actionable finding generates $640,000 in claim-related benefit. Adding $48,000 of independently measured handling savings and subtracting $175,000 in illustrative acquisition and program costs yields approximately $513,000 of modeled net value. This is an illustrative base scenario, not a forecast or a proposed price. Lower-case scenarios can be near breakeven or negative; favorable targeted cohorts can exceed $1 million per 1,000 attempts. Section 8 supplies the full calculation, guardrails and sensitivity.
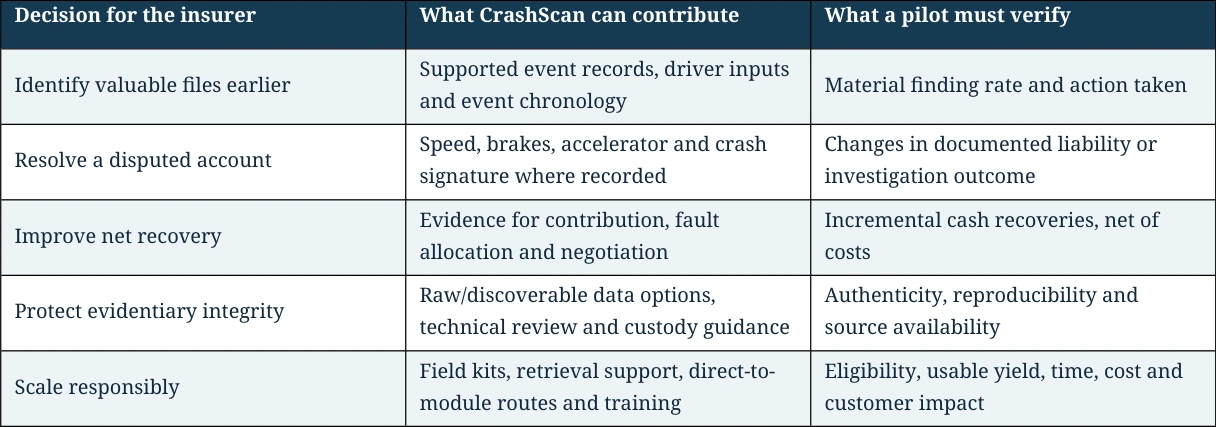
Read table as text
| Decision for the insurer | What CrashScan can contribute | What a pilot must verify |
| Identify valuable files earlier | Supported event records, driver inputs and event chronology | Material finding rate and action taken |
| Resolve a disputed account | Speed, brakes, accelerator and crash signature where recorded | Changes in documented liability or investigation outcome |
| Improve net recovery | Evidence for contribution, fault allocation and negotiation | Incremental cash recoveries, net of costs |
| Protect evidentiary integrity | Raw/discoverable data options, technical review and custody guidance | Authenticity, reproducibility and source availability |
| Scale responsibly | Field kits, retrieval support, direct-to- module routes and training | Eligibility, usable yield, time, cost and customer impact |
The recommended next step is a disciplined, consent-led pilot focused on claims whose outcomes are genuinely uncertain, with a comparison cohort and documented counterfactual. The investment case should be based on actual collected recoveries, verified avoided payments and measured staff/expense efficiencies - never on the gross face value of every flagged claim.
02 / In this resource
1. Why objective vehicle data matters now
Insurers face persistent claim-cost complexity even as some market-level underwriting metrics improve. CCC's 2026 research reports record total-loss frequency of 23.1% in its March study, a 10.3% year-over-year increase in average paid bodily-injury severity and rising repair complexity. A subsequent October 2026 industry update cited total-loss frequency of 23.5% through the second quarter of 2026. These figures are measures of market conditions, not caused or solved by EDR. [R04] [R05]
Claim narratives, scene photographs, witness accounts, damage patterns, police reports, repairs and outside vehicle histories are important evidence. But each is incomplete. Vehicle-resident EDR data can add a recorded view of movement, driver input and impact characteristics during a short period around an event. Where supported, it allows more precise questions: does the stored event match this loss, what was recorded before impact, how many events were stored, and how do the signals compare with the reported account?
For high-volume insurers the important innovation is process design, not merely technical capability. If an EDR is only accessed after a late litigation dispute, much of its operational value has already been lost. A well-designed claims pathway preserves the opportunity to read relevant data during inspection, appraisal, total loss, repair or salvage, with suitable authorization and safety protocols.
The value of early data - and the distinction that matters
LexisNexis Risk Solutions reviewed more than 10 million features associated with leading-carrier claims. The white paper reports, for studied third-party bodily-injury cohorts, 15-25% lower claims expenses, 25-49% lower attorney involvement and 5-15% shorter cycle times; for third-party property damage, 10-15% lower claims expenses and 8-15% shorter cycle times. The study evaluated broader early third-party data, not CrashScan or vehicle EDR data. Its proper role is to show that actionable information earlier in the life of a claim can materially affect outcomes. [R01]
The insurance proposition for EDR is narrower and more testable: when a vehicle actually records relevant data and that data is retrieved and interpreted correctly, does the resulting objective evidence improve decisions relative to normal handling?
03 / In this resource
2. What an EDR records - and what it does not
The U.S. National Highway Traffic Safety Administration defines vehicle EDRs as systems storing technical vehicle and occupant information for a short period immediately before, during or after a crash. Depending on the manufacturer, vehicle, year, market, module and specific event, fields may include: [R10]

Read table as text
| Information category | Examples of available signals | Claims questions |
| Event and chronology | Deployment/non-deployment records, event sequence, ignition cycles | Is this the incident at issue? One impact or several? |
| Pre-crash state | Indicated speed, service brake, throttle/accelerator, steering | Does the recorded maneuver fit the loss account? |

Read table as text
| Crash signature | Longitudinal/lateral delta-V, acceleration trace, recording duration | What is the measured change in velocity, subject to sensor limits? |
| Restraints and occupant data | Buckle state, deployment status, selected occupant classifications | What restraint-related information exists in this system? |
| Metadata and diagnostics | Vehicle identification, odometer/cycle indicators, module metadata | How can event recency and acquisition integrity be assessed? |
Important boundaries are part of the value proposition. An EDR does not inherently establish traffic-signal color, legal fault, driver intent, occupant injury, repair pricing or whether a claim is fraudulent. A recorded speed sample is not necessarily impact speed; a delta-V measure is not automatically impact speed; absence of a stored event is not proof that no contact occurred. Timing, sample rate, quantization, clipped channels, axis conventions and OEM definitions must be considered. [R12] [R13] [R14]
EDR data also is not synonymous with continuous vehicle telematics, dash-cam video, GPS route history, driver-score programs or connected-car cloud feeds. Those systems can be complementary, but commercial and scientific results from them should not be relabeled as EDR-specific performance.
04 / In this resource
3. What CrashScan provides
CrashScan is a managed EDR evidence-access and reporting service for authorized professional users. The deliverable is broader than a handheld scan: a supported-vehicle acquisition pathway, contextual EDR report, source-data and evidentiary support where applicable, and access to engineering and advanced processing services. [R15]
From vehicle to decision
1. Confirm vehicle support and legal authority. Vehicle support must be checked for the exact year, make, model and market; not all vehicles or events are supported. 2. Acquire relevant module data. Field personnel follow the correct supported-vehicle connection method and record acquisition identifiers, warnings, equipment and vehicle condition. 3. Preserve and process the evidence. Relevant original records, raw/discoverable outputs where available, connection documentation and chain-of-custody evidence are retained as the assignment requires. 4. Receive a usable claims view. Contextual reports organize technical values, event sequence and relevant caveats so an investigator can identify the appropriate next question. 5. Interpret and act. Adjusters, SIU teams, subrogation specialists and reconstruction professionals correlate the EDR with other evidence. Technical/forensic support addresses difficult fields and challenges. 6. Escalate when required. Advanced direct-to-module, bench or specialist processing may be available when routine retrieval is impractical and the vehicle/module supports the route. Case Spotlights 11 and 12 illustrate access-path and chain-of-custody decisions.
The service can support vehicle inspection and appraisal networks, insurer staff, independent investigators, approved repair/salvage partners, litigation/engineering teams and approved specialist laboratories. Actual deployment choices depend on procurement, training, authority, model support, cybersecurity, privacy and consent. The general technical guide and Master Resources provide field-level detail. [R15] [R17]
Evidence to action - an example
A file may be referred because the account describes a parking-lot impact. If the subject vehicle contains a candidate event, a claims reviewer can test its chronology and recorded speed against damage, photographs, statements and other evidence. A material mismatch can justify targeted follow-up; a consistent record can help close an unnecessary dispute. In either case the effect must be documented rather than presumed.
05 / In this resource
4. Five claims-value pillars
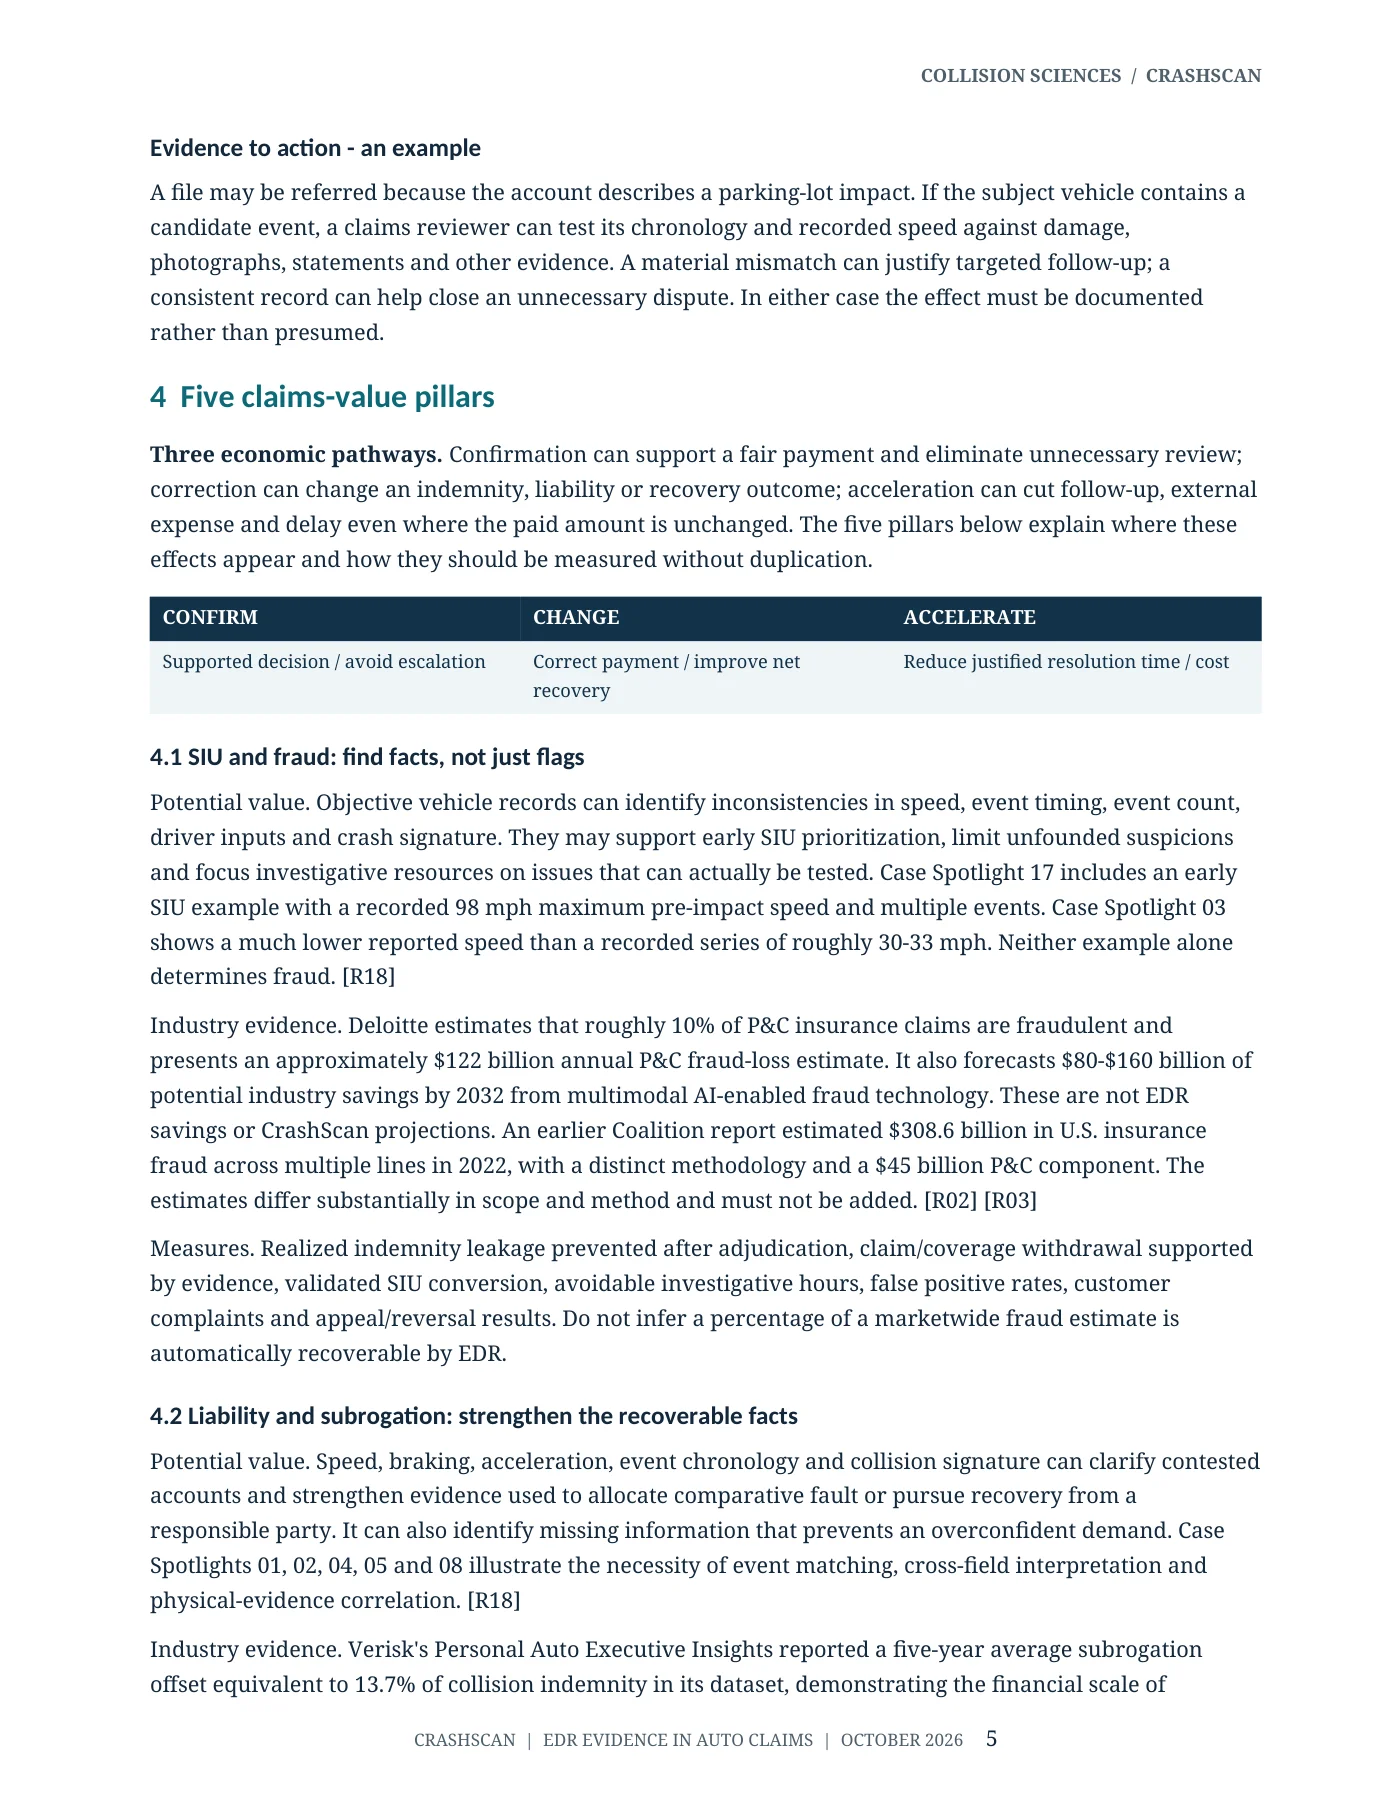
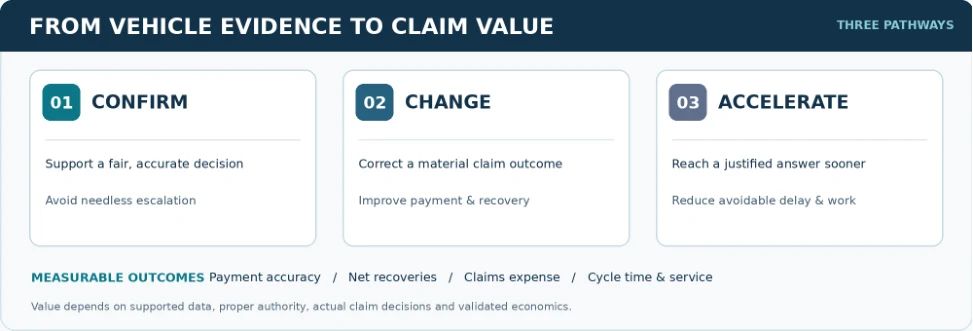
Three economic pathways. Confirmation can support a fair payment and eliminate unnecessary review; correction can change an indemnity, liability or recovery outcome; acceleration can cut follow-up, external expense and delay even where the paid amount is unchanged. The five pillars below explain where these effects appear and how they should be measured without duplication.
Confirm change accelerate
Supported decision / avoid escalation Correct payment / improve net recovery Reduce justified resolution time / cost
4.1. SIU and fraud: find facts, not just flags
Potential value. Objective vehicle records can identify inconsistencies in speed, event timing, event count, driver inputs and crash signature. They may support early SIU prioritization, limit unfounded suspicions and focus investigative resources on issues that can actually be tested. Case Spotlight 17 includes an early SIU example with a recorded 98 mph maximum pre-impact speed and multiple events. Case Spotlight 03 shows a much lower reported speed than a recorded series of roughly 30-33 mph. Neither example alone determines fraud. [R18]
Industry evidence. Deloitte estimates that roughly 10% of P&C insurance claims are fraudulent and presents an approximately $122 billion annual P&C fraud-loss estimate. It also forecasts $80-$160 billion of potential industry savings by 2032 from multimodal AI-enabled fraud technology. These are not EDR savings or CrashScan projections. An earlier Coalition report estimated $308.6 billion in U.S. insurance fraud across multiple lines in 2022, with a distinct methodology and a $45 billion P&C component. The estimates differ substantially in scope and method and must not be added. [R02] [R03]
Measures. Realized indemnity leakage prevented after adjudication, claim/coverage withdrawal supported by evidence, validated SIU conversion, avoidable investigative hours, false positive rates, customer complaints and appeal/reversal results. Do not infer a percentage of a marketwide fraud estimate is automatically recoverable by EDR.
4.2. Liability and subrogation: strengthen the recoverable facts
Potential value. Speed, braking, acceleration, event chronology and collision signature can clarify contested accounts and strengthen evidence used to allocate comparative fault or pursue recovery from a responsible party. It can also identify missing information that prevents an overconfident demand. Case Spotlights 01, 02, 04, 05 and 08 illustrate the necessity of event matching, cross-field interpretation and physical-evidence correlation. [R18]
Industry evidence. Verisk's Personal Auto Executive Insights reported a five-year average subrogation offset equivalent to 13.7% of collision indemnity in its dataset, demonstrating the financial scale of recoveries; this is NOT a projected percentage uplift from CrashScan. Verisk's Subrogation Solutions describes the role of early data and efficient workflows in identifying recoveries, and the NASP benchmarking program supports carrier-specific performance comparisons. [R06] [R07] [R26]
Measures. Incremental recovery opportunity identification and acceptance; net collected recovery after fees; changes in disputed liability; demand-to-payment cycle; and post-resolution appeals. Avoid double-counting recovery and first-party avoided indemnity relating to the same dollars.
4.3. Indemnity accuracy and severity: make the payment fit the evidence
Potential value. Recorded crash severity and event characteristics can inform whether a described loss mechanism is physically consistent with other evidence. They can help identify claims deserving deeper expert review or cases where objective information supports a straightforward settlement. EDR is not an injury diagnosis, an actuarial severity oracle or a substitute for medical causation analysis.
Industry evidence. CCC's 2026 analysis documents rising bodily-injury severity, higher total losses and increasing vehicle complexity - creating a strong incentive to improve the factual basis of claim decisions. LexisNexis demonstrates that additional early data was associated with favorable expense and other outcomes in studied cohorts. Neither report isolates EDR as the cause. [R04] [R01]
Measures. Matched-cohort paid and incurred severity, reopened claims, reserve development, documentation of changed payment decisions and independent expert review. Distinguish objective evidence-led corrections from changes caused by claims mix, policy terms, defense strategy or settlement timing.
4.4. Litigation, expert and dispute cost: make evidence defensible
Potential value. A well-documented acquisition can support early technical disclosure, more focused engineering instructions, fewer avoidable factual disputes and narrower expert issues. Where court proceedings occur, preserving the original data, source definitions, method, chain of custody and limitations is essential. EDR admissibility is jurisdiction- and case-specific; it is not automatic. [R23] [R24]
Industry evidence. LexisNexis reported lower attorney involvement in a broader early-data study, while EDR accuracy research published through SAE demonstrates both useful accuracy and material limitations. These are complementary evidentiary considerations, not proof of reduced litigation expense from CrashScan alone. [R01] [R12-R14]
Measures. External legal and expert spend per comparable litigated claim, retained experts, issue count, settlement stage, authenticity challenges and documented preservation compliance. Never treat a predicted avoided lawsuit as a realized dollar saving without a credible counterfactual.
4.5. Cycle time, administrative work and customer outcomes
Potential value. Early objective evidence may confirm a valid account and permit an appropriate claim to close sooner even when the ultimate payment does not change. Fewer repeat contacts, inspections, document requests, unnecessary specialist referrals and reopened investigations can reduce handling effort. Where causally supported and actually incurred by the carrier, earlier resolution can also reduce rental, storage, towing or salvage-delay charges. These are potential cost pathways, not automatic consequences of a shorter cycle. Prompt, fair decisions may improve claimant experience without implying a monetized retention benefit.
Industry evidence. LexisNexis reported a 5-15% reduction in cycle time for studied third-party bodily-injury claims and an 8-15% reduction for property-damage cohorts receiving more early data. An IMS vendor article cites a 60% life-cycle reduction for certain connected-car/soft-tissue cases and 30% fewer touchpoints. IMS observations concern connected-car/telematics data, not post-loss EDR extraction, and should be treated as a directional adjacent reference with limited generalizability. CCC's Moments of Truth research emphasizes the significance of claims experience for customer perceptions and retention. [R01] [R08] [R09]
Measures. Paid working hours, vendor/referral costs, repeat inspections, claim reopens, additional touches, supported rental/storage/salvage-delay expenses, days to evidence, days to liability decision, days to close, complaints and customer experience. Record the elapsed-time improvement even when no cash expense can be verified. Report separately by claims cohort; do not count an avoided expert invoice twice as both handling and legal savings.
06 / In this resource
5. Why retrieval quality and validation matter
An insurer only benefits if the event is actually recorded, acquired, interpreted and attributable to the subject loss. These are distinct technical questions. NHTSA's definition and Part 563 framework establish the structure of EDR evidence; published SAE studies show impressive performance in some measured channels but also demonstrate event-trigger variability, sampling limitations and differences in lateral delta-V with rotational impacts. [R10-R14]
For example, an SAE study comparing EDR records with 2016-2022 IIHS tests across 15 brands reported strong pre-crash speed agreement and generally good longitudinal delta-V agreement in specified test configurations, with greater variability under small-overlap impacts and in lateral channels. Another SAE study of 189 real-world front/rear collisions found that approximately 10-13% of the evaluated reported speed changes may exceed a +/-10% error threshold under its analytical approach. These are reasons for technically informed use, not to reject the evidence. [R12] [R13]
Collision Sciences maintains a nine-item technical corpus spanning multi-tool comparisons, OEM tool cross-checks, instrumented crash tests, bench retrieval, real-world speed comparison, BMW metadata consistency and 2026 DSD controlled testing. Two DSD publications analyze the same underlying testing program and should not be mistaken for independent datasets. A full annotated index appears in Appendix C. [R16]
07 / In this resource
6. Authorization, privacy and evidence governance
For U.S. cases, the Driver Privacy Act of 2015 generally characterizes EDR-recorded data as property of the owner or lessee and restricts access absent a recognized legal pathway, including applicable consent, order or statutory exception. State-specific requirements, policy language and the facts of a case must also be assessed. [R19]
A well-designed program should establish clear role-based permissions, consent and authority documentation, vendor/data-processing terms, secure transmission/storage, retention and deletion schedules, original-source preservation, support escalation, version provenance and a process for honoring discovery obligations. These controls should apply equally to results that support the claimant and those that raise questions.
Policy decisions, fraud allegations, injury conclusions and legal opinions remain with appropriately authorized insurer staff and specialists. A no-data result can have many causes - unsupported vehicle, non-recording event, threshold, system state, module condition or retrieval failure - and requires a documented reason category.
08 / In this resource
7. Practical deployment in the claims lifecycle
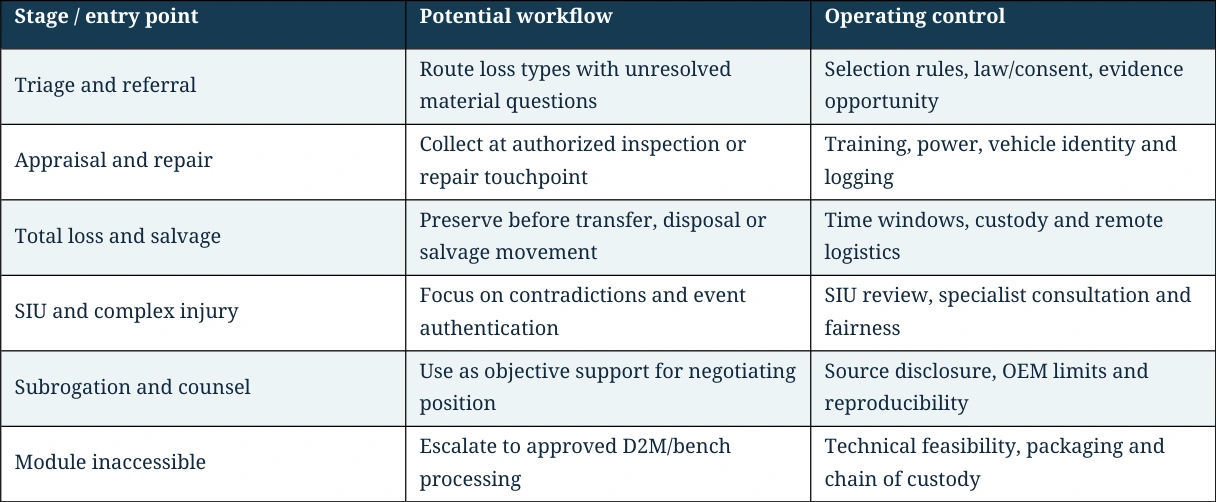
Read table as text
| Stage / entry point | Potential workflow | Operating control |
| Triage and referral | Route loss types with unresolved material questions | Selection rules, law/consent, evidence opportunity |
| Appraisal and repair | Collect at authorized inspection or repair touchpoint | Training, power, vehicle identity and logging |
| Total loss and salvage | Preserve before transfer, disposal or salvage movement | Time windows, custody and remote logistics |
| SIU and complex injury | Focus on contradictions and event authentication | SIU review, specialist consultation and fairness |
| Subrogation and counsel | Use as objective support for negotiating position | Source disclosure, OEM limits and reproducibility |
| Module inaccessible | Escalate to approved D2M/bench processing | Technical feasibility, packaging and chain of custody |
Deployment can be phased by state, vehicle family, claim segment, handling partner and use case. Insurers should avoid blanket scanning requirements that create high cost or low yield: the economic logic favors a focused, observable cohort first, followed by calibrated scale-up.
09 / In this resource
8. Financial opportunity and a transparent savings model
8.1. What the model counts
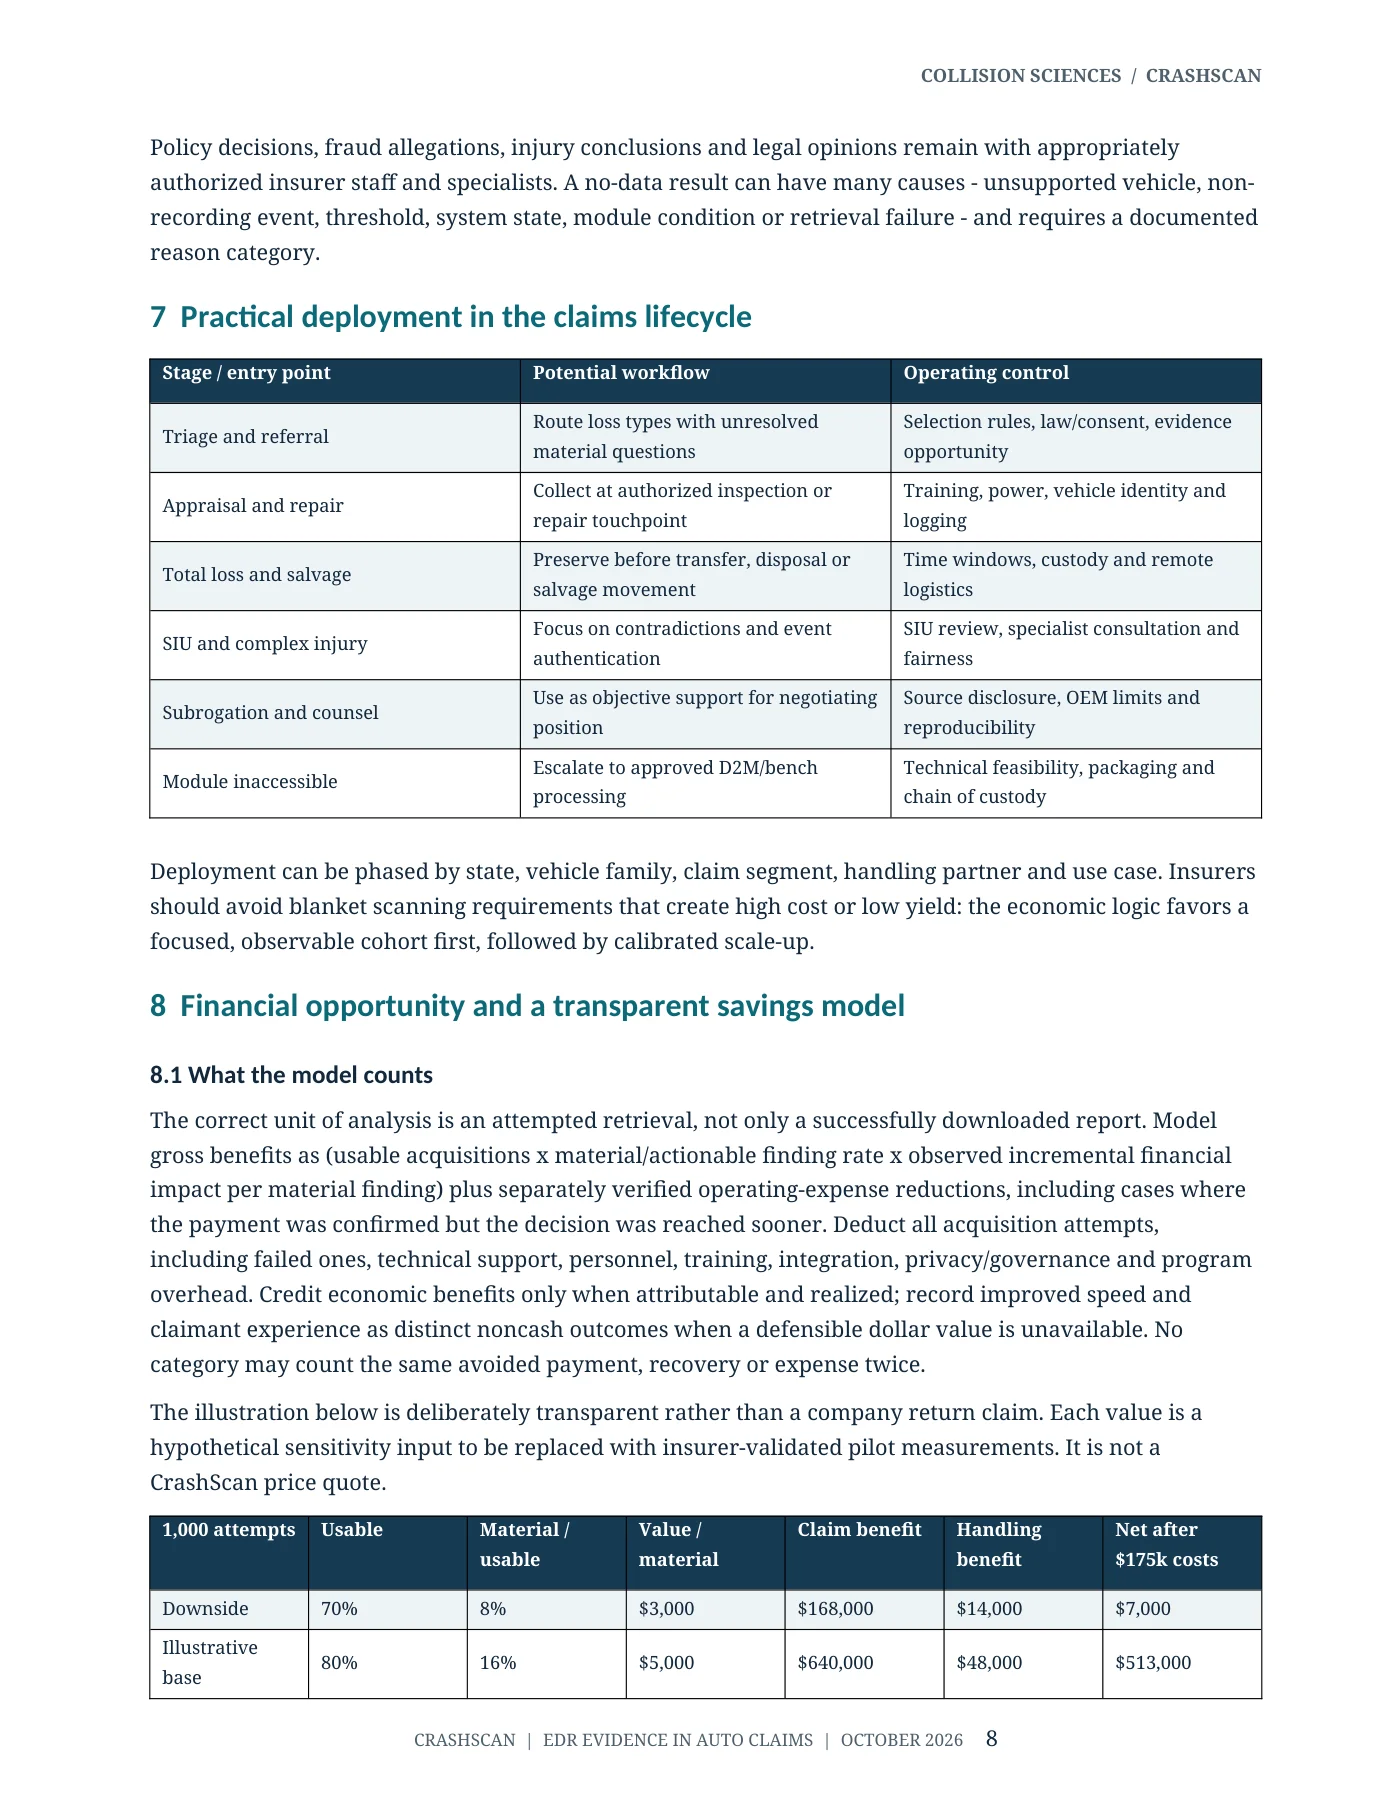
The correct unit of analysis is an attempted retrieval, not only a successfully downloaded report. Model gross benefits as (usable acquisitions x material/actionable finding rate x observed incremental financial impact per material finding) plus separately verified operating-expense reductions, including cases where the payment was confirmed but the decision was reached sooner. Deduct all acquisition attempts, including failed ones, technical support, personnel, training, integration, privacy/governance and program overhead. Credit economic benefits only when attributable and realized; record improved speed and claimant experience as distinct noncash outcomes when a defensible dollar value is unavailable. No category may count the same avoided payment, recovery or expense twice.
The illustration below is deliberately transparent rather than a company return claim. Each value is a hypothetical sensitivity input to be replaced with insurer-validated pilot measurements. It is not a CrashScan price quote.

Read table as text
| 1,000 attempts | Usable | Material / usable | Value / material | Claim benefit | Handling benefit | Net after $175k costs |
| Downside | 70% | 8% | $3,000 | $168,000 | $14,000 | $7,000 |
| Illustrative base | 80% | 16% | $5,000 | $640,000 | $48,000 | $513,000 |
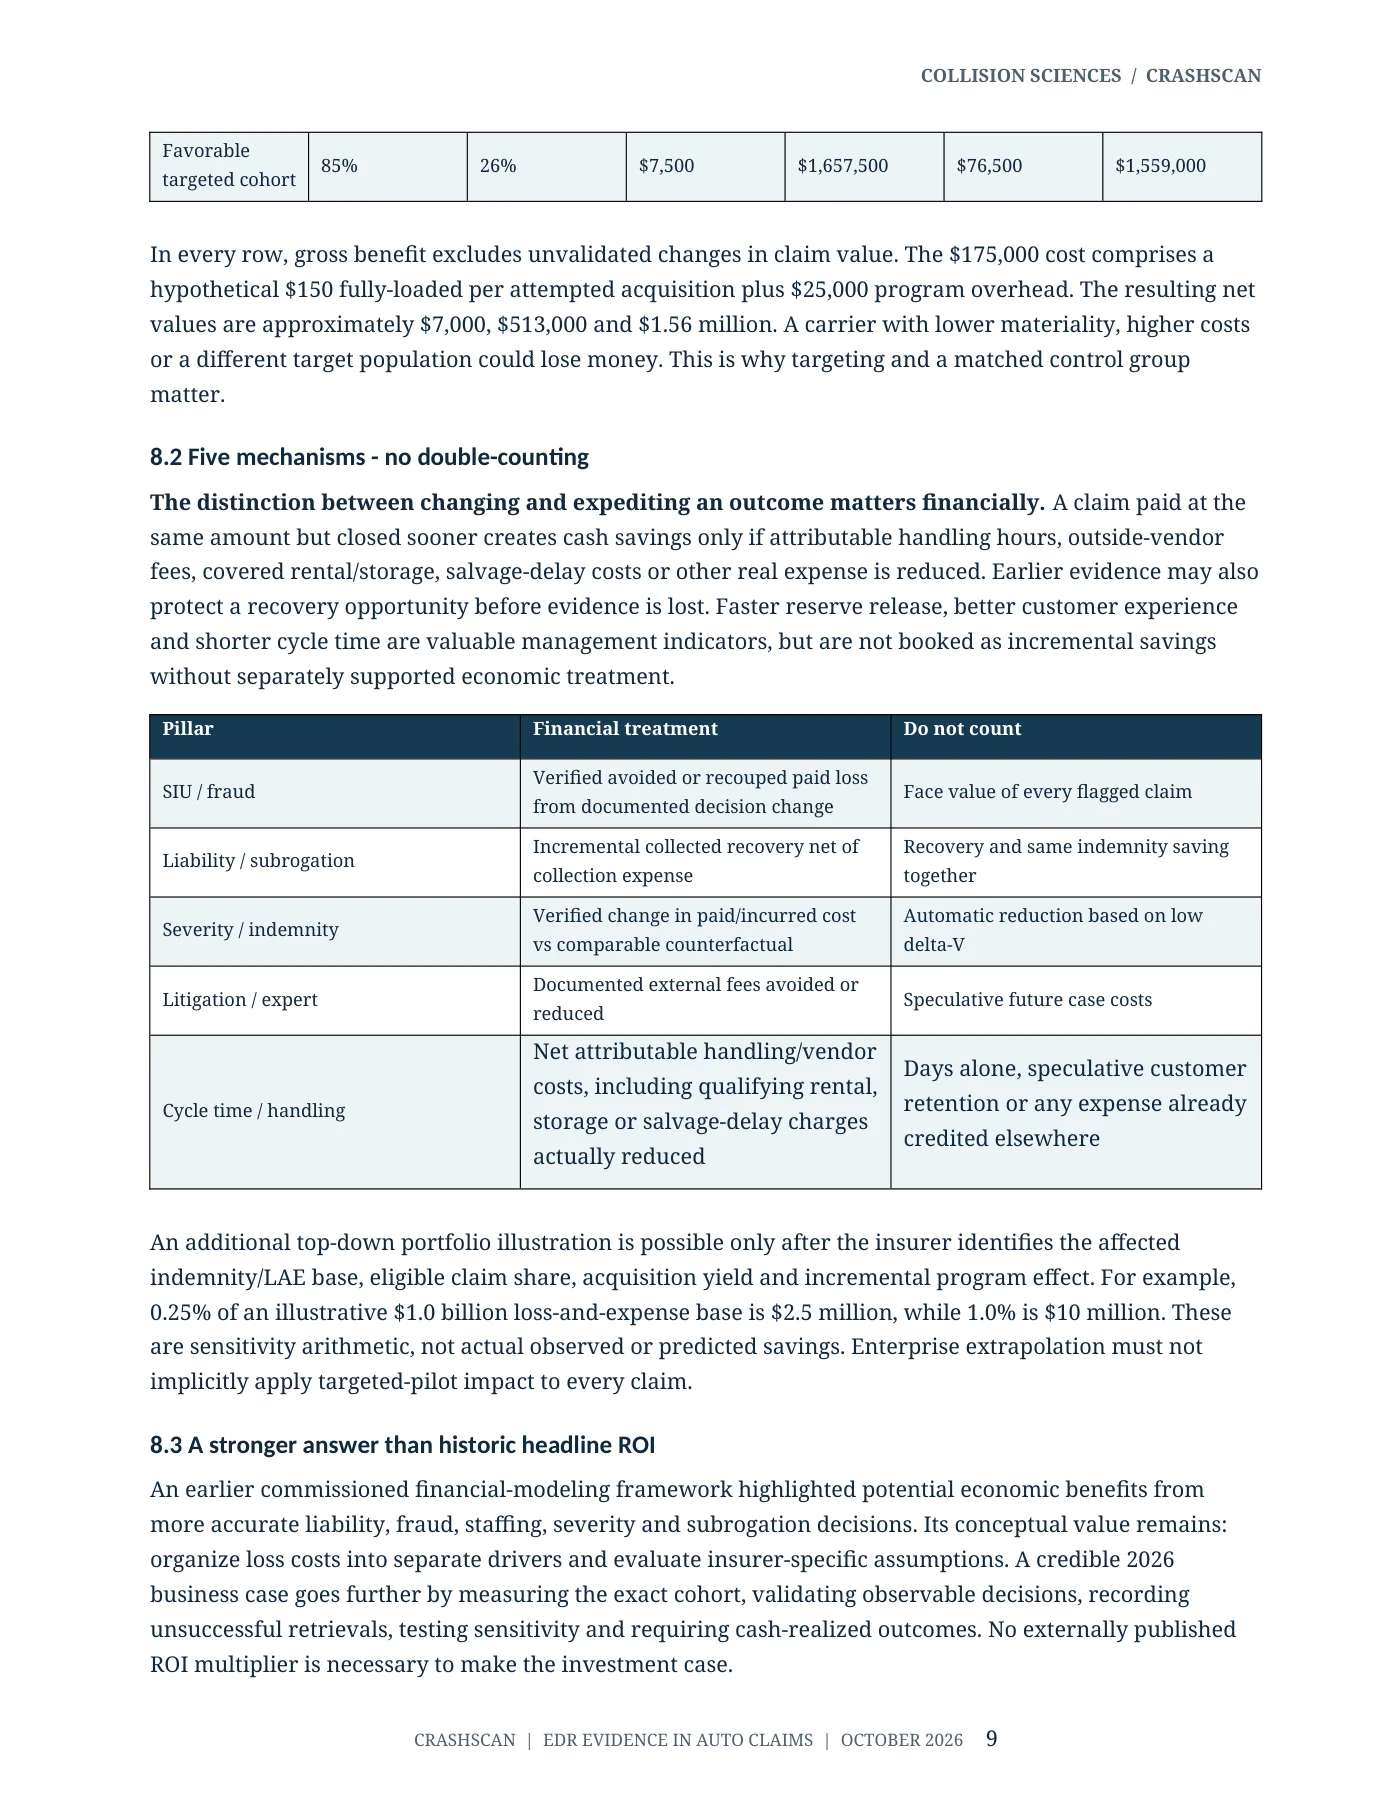
Favorable targeted cohort 85% 26% $7,500 $1,657,500 $76,500 $1,559,000
In every row, gross benefit excludes unvalidated changes in claim value. The $175,000 cost comprises a hypothetical $150 fully-loaded per attempted acquisition plus $25,000 program overhead. The resulting net values are approximately $7,000, $513,000 and $1.56 million. A carrier with lower materiality, higher costs or a different target population could lose money. This is why targeting and a matched control group matter.
8.2. Five mechanisms - no double-counting
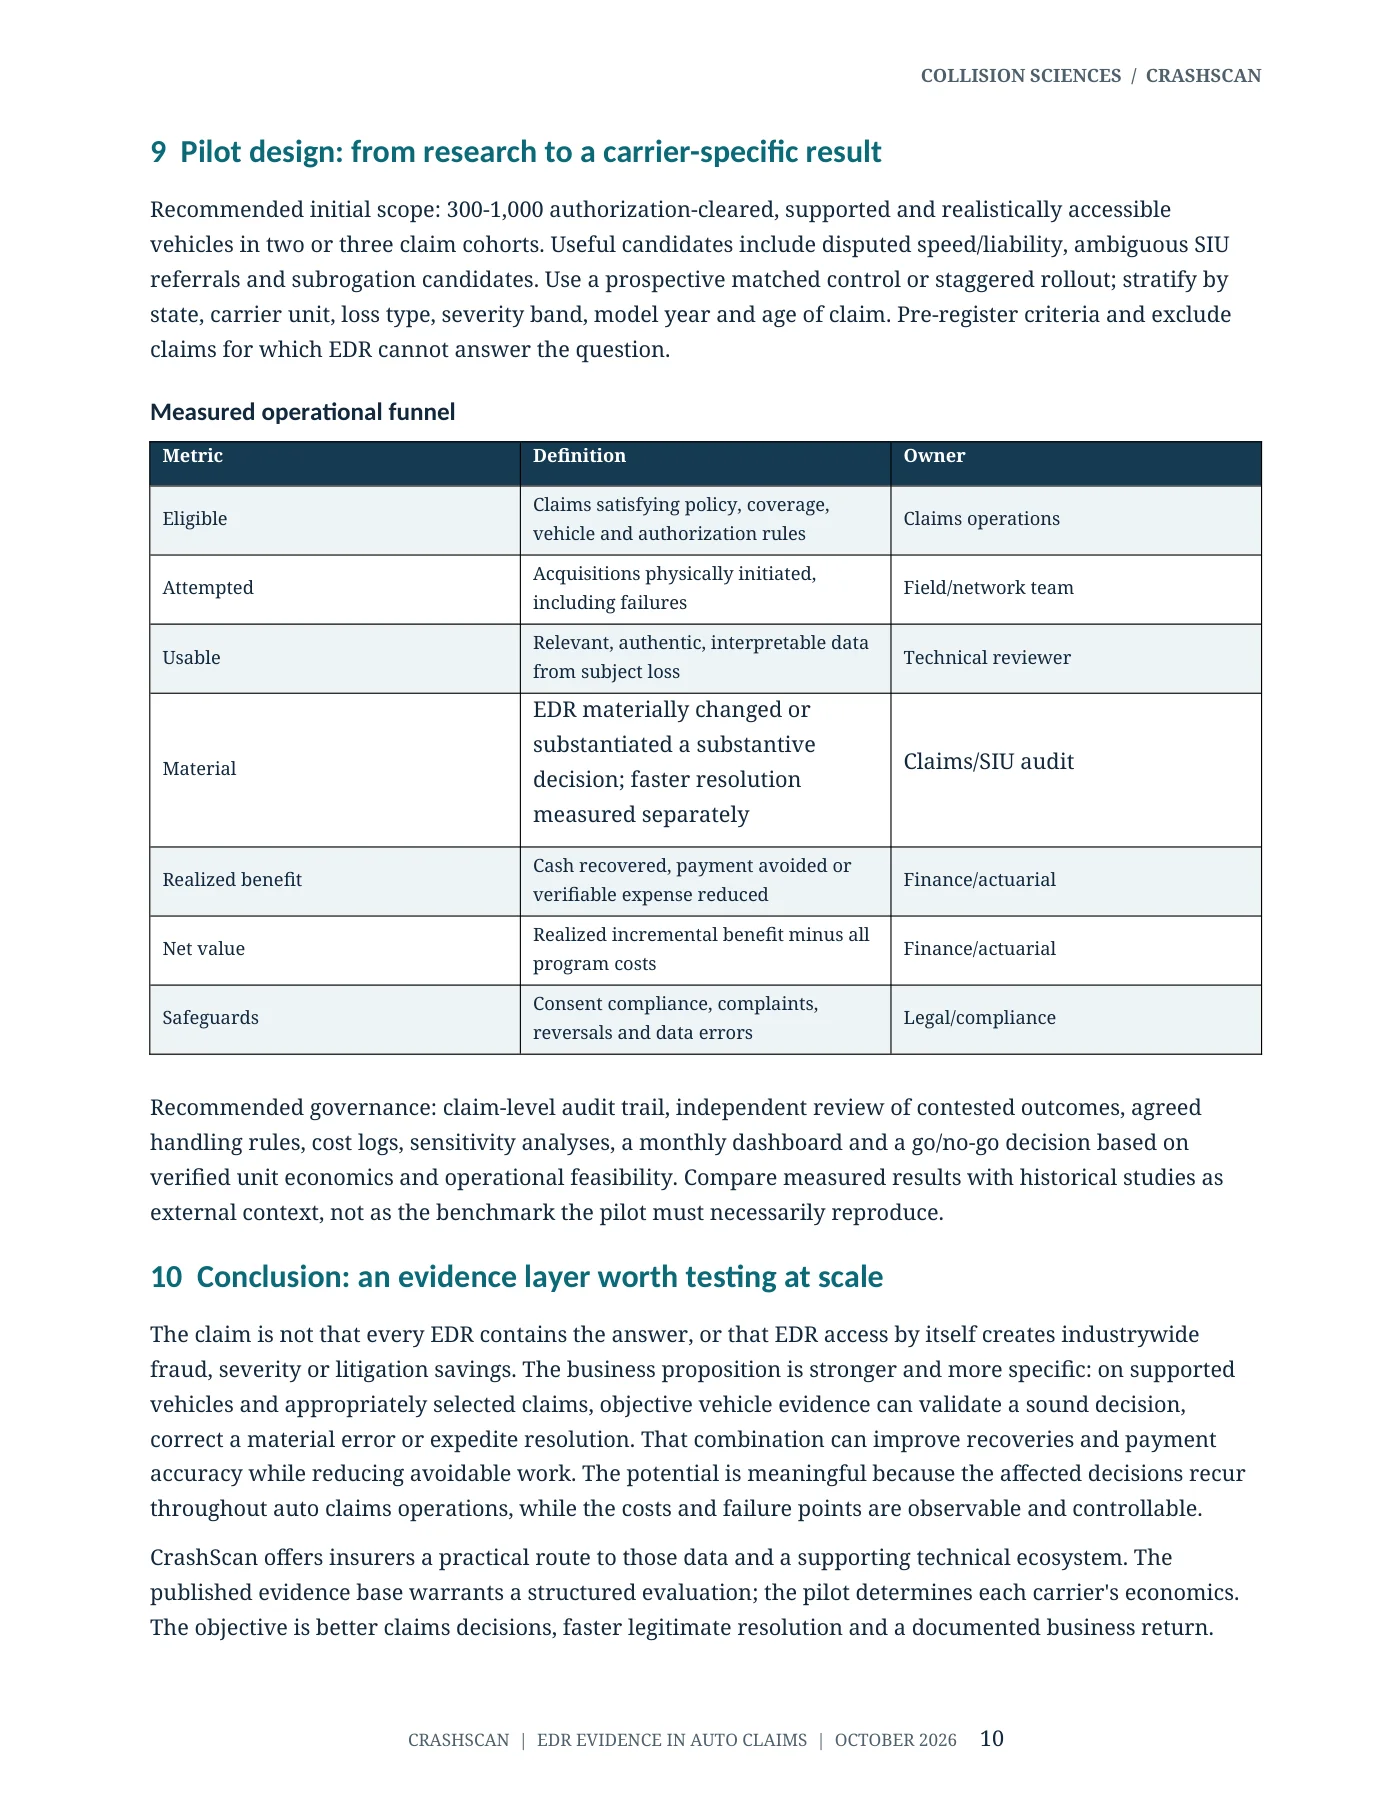
The distinction between changing and expediting an outcome matters financially. A claim paid at the same amount but closed sooner creates cash savings only if attributable handling hours, outside-vendor fees, covered rental/storage, salvage-delay costs or other real expense is reduced. Earlier evidence may also protect a recovery opportunity before evidence is lost. Faster reserve release, better customer experience and shorter cycle time are valuable management indicators, but are not booked as incremental savings without separately supported economic treatment.
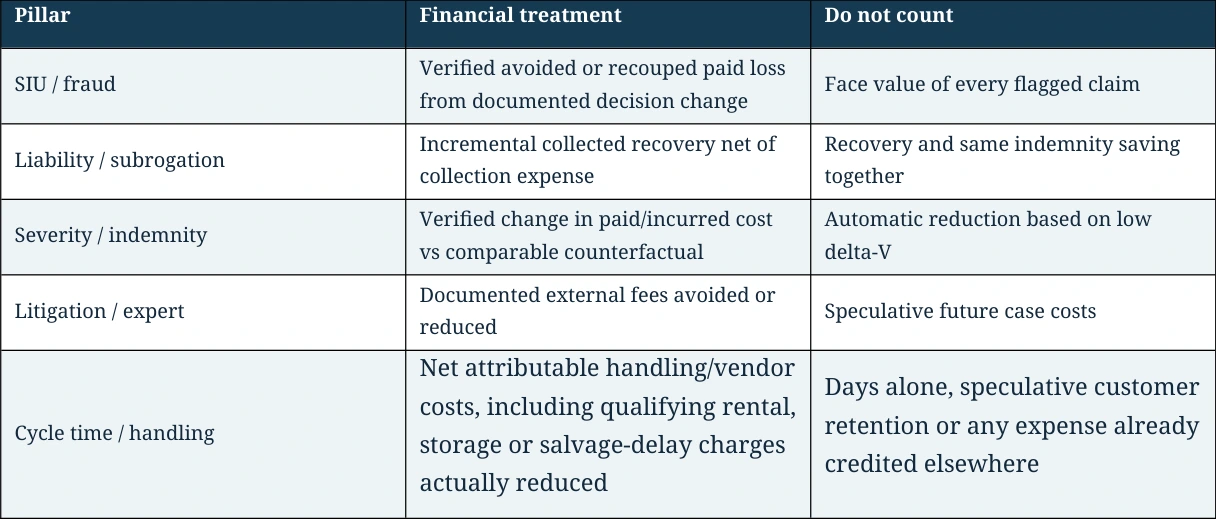
Read table as text
| Pillar | Financial treatment | Do not count |
| SIU / fraud | Verified avoided or recouped paid loss from documented decision change | Face value of every flagged claim |
| Liability / subrogation | Incremental collected recovery net of collection expense | Recovery and same indemnity saving together |
| Severity / indemnity | Verified change in paid/incurred cost vs comparable counterfactual | Automatic reduction based on low delta-V |
| Litigation / expert | Documented external fees avoided or reduced | Speculative future case costs |
| Cycle time / handling | Net attributable handling/vendor costs, including qualifying rental, storage or salvage-delay charges actually reduced | Days alone, speculative customer retention or any expense already credited elsewhere |
An additional top-down portfolio illustration is possible only after the insurer identifies the affected indemnity/LAE base, eligible claim share, acquisition yield and incremental program effect. For example, 0.25% of an illustrative $1.0 billion loss-and-expense base is $2.5 million, while 1.0% is $10 million. These are sensitivity arithmetic, not actual observed or predicted savings. Enterprise extrapolation must not implicitly apply targeted-pilot impact to every claim.
8.3. A stronger answer than historic headline ROI
An earlier commissioned financial-modeling framework highlighted potential economic benefits from more accurate liability, fraud, staffing, severity and subrogation decisions. Its conceptual value remains: organize loss costs into separate drivers and evaluate insurer-specific assumptions. A credible 2026 business case goes further by measuring the exact cohort, validating observable decisions, recording unsuccessful retrievals, testing sensitivity and requiring cash-realized outcomes. No externally published ROI multiplier is necessary to make the investment case.
10 / In this resource
9. Pilot design: from research to a carrier-specific result
Recommended initial scope: 300-1,000 authorization-cleared, supported and realistically accessible vehicles in two or three claim cohorts. Useful candidates include disputed speed/liability, ambiguous SIU referrals and subrogation candidates. Use a prospective matched control or staggered rollout; stratify by state, carrier unit, loss type, severity band, model year and age of claim. Pre-register criteria and exclude claims for which EDR cannot answer the question.
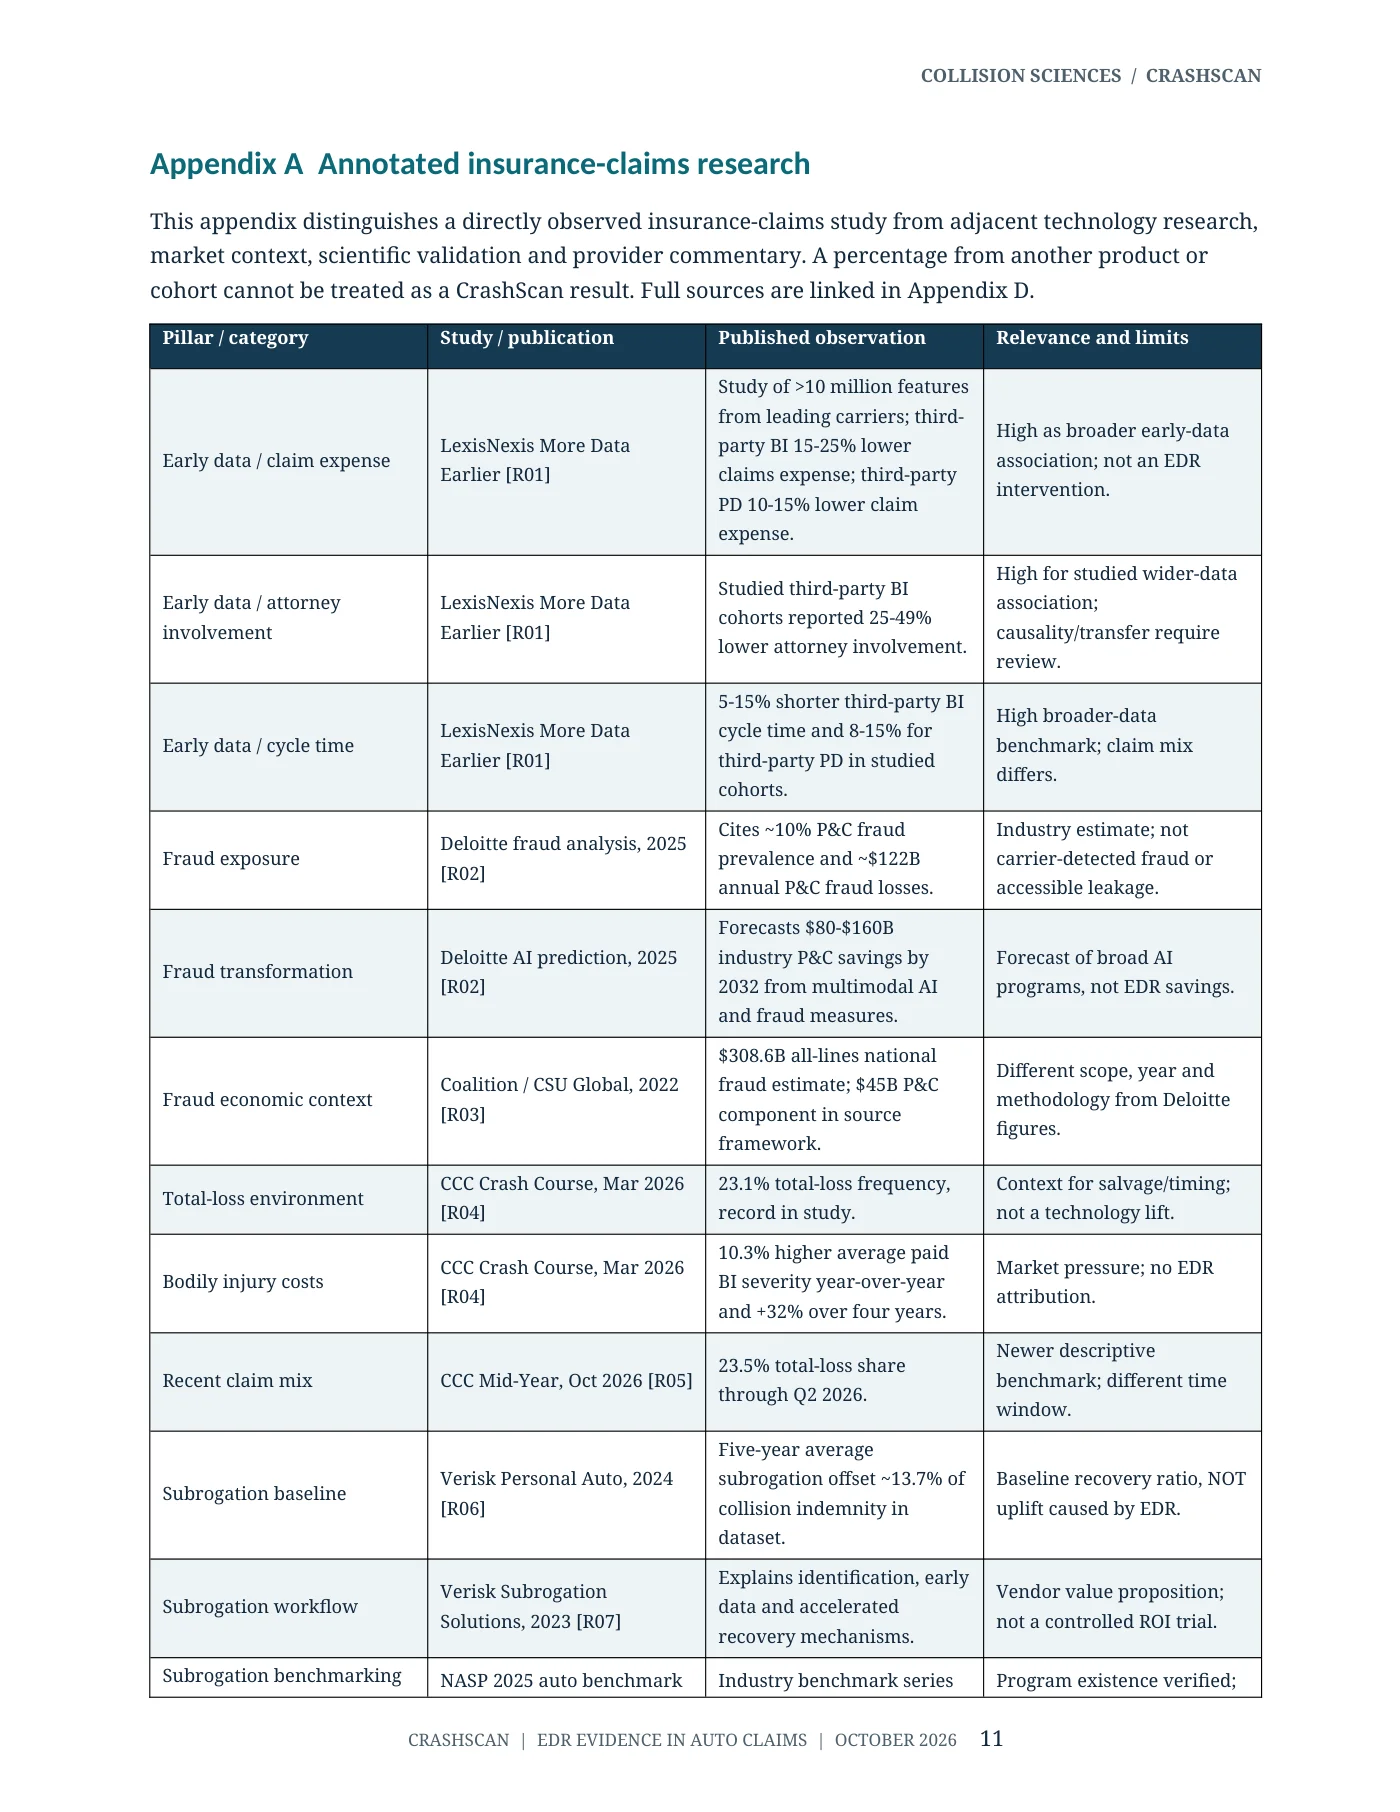
Measured operational funnel
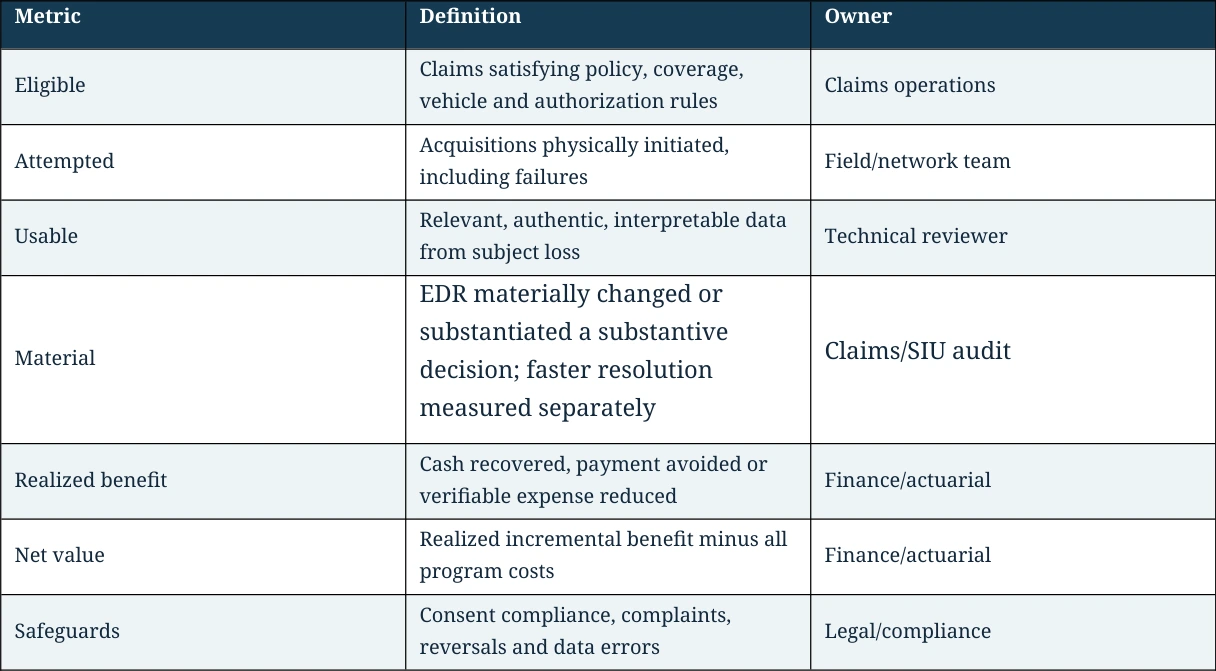
Read table as text
| Metric | Definition | Owner |
| Eligible | Claims satisfying policy, coverage, vehicle and authorization rules | Claims operations |
| Attempted | Acquisitions physically initiated, including failures | Field/network team |
| Usable | Relevant, authentic, interpretable data from subject loss | Technical reviewer |
| Material | EDR materially changed or substantiated a substantive decision; faster resolution measured separately | Claims/SIU audit |
| Realized benefit | Cash recovered, payment avoided or verifiable expense reduced | Finance/actuarial |
| Net value | Realized incremental benefit minus all program costs | Finance/actuarial |
| Safeguards | Consent compliance, complaints, reversals and data errors | Legal/compliance |
Recommended governance: claim-level audit trail, independent review of contested outcomes, agreed handling rules, cost logs, sensitivity analyses, a monthly dashboard and a go/no-go decision based on verified unit economics and operational feasibility. Compare measured results with historical studies as external context, not as the benchmark the pilot must necessarily reproduce.
11 / In this resource
10. Conclusion: an evidence layer worth testing at scale
The claim is not that every EDR contains the answer, or that EDR access by itself creates industrywide fraud, severity or litigation savings. The business proposition is stronger and more specific: on supported vehicles and appropriately selected claims, objective vehicle evidence can validate a sound decision, correct a material error or expedite resolution. That combination can improve recoveries and payment accuracy while reducing avoidable work. The potential is meaningful because the affected decisions recur throughout auto claims operations, while the costs and failure points are observable and controllable.
CrashScan offers insurers a practical route to those data and a supporting technical ecosystem. The published evidence base warrants a structured evaluation; the pilot determines each carrier's economics. The objective is better claims decisions, faster legitimate resolution and a documented business return.
12 / In this resource
Appendix A annotated insurance-claims research
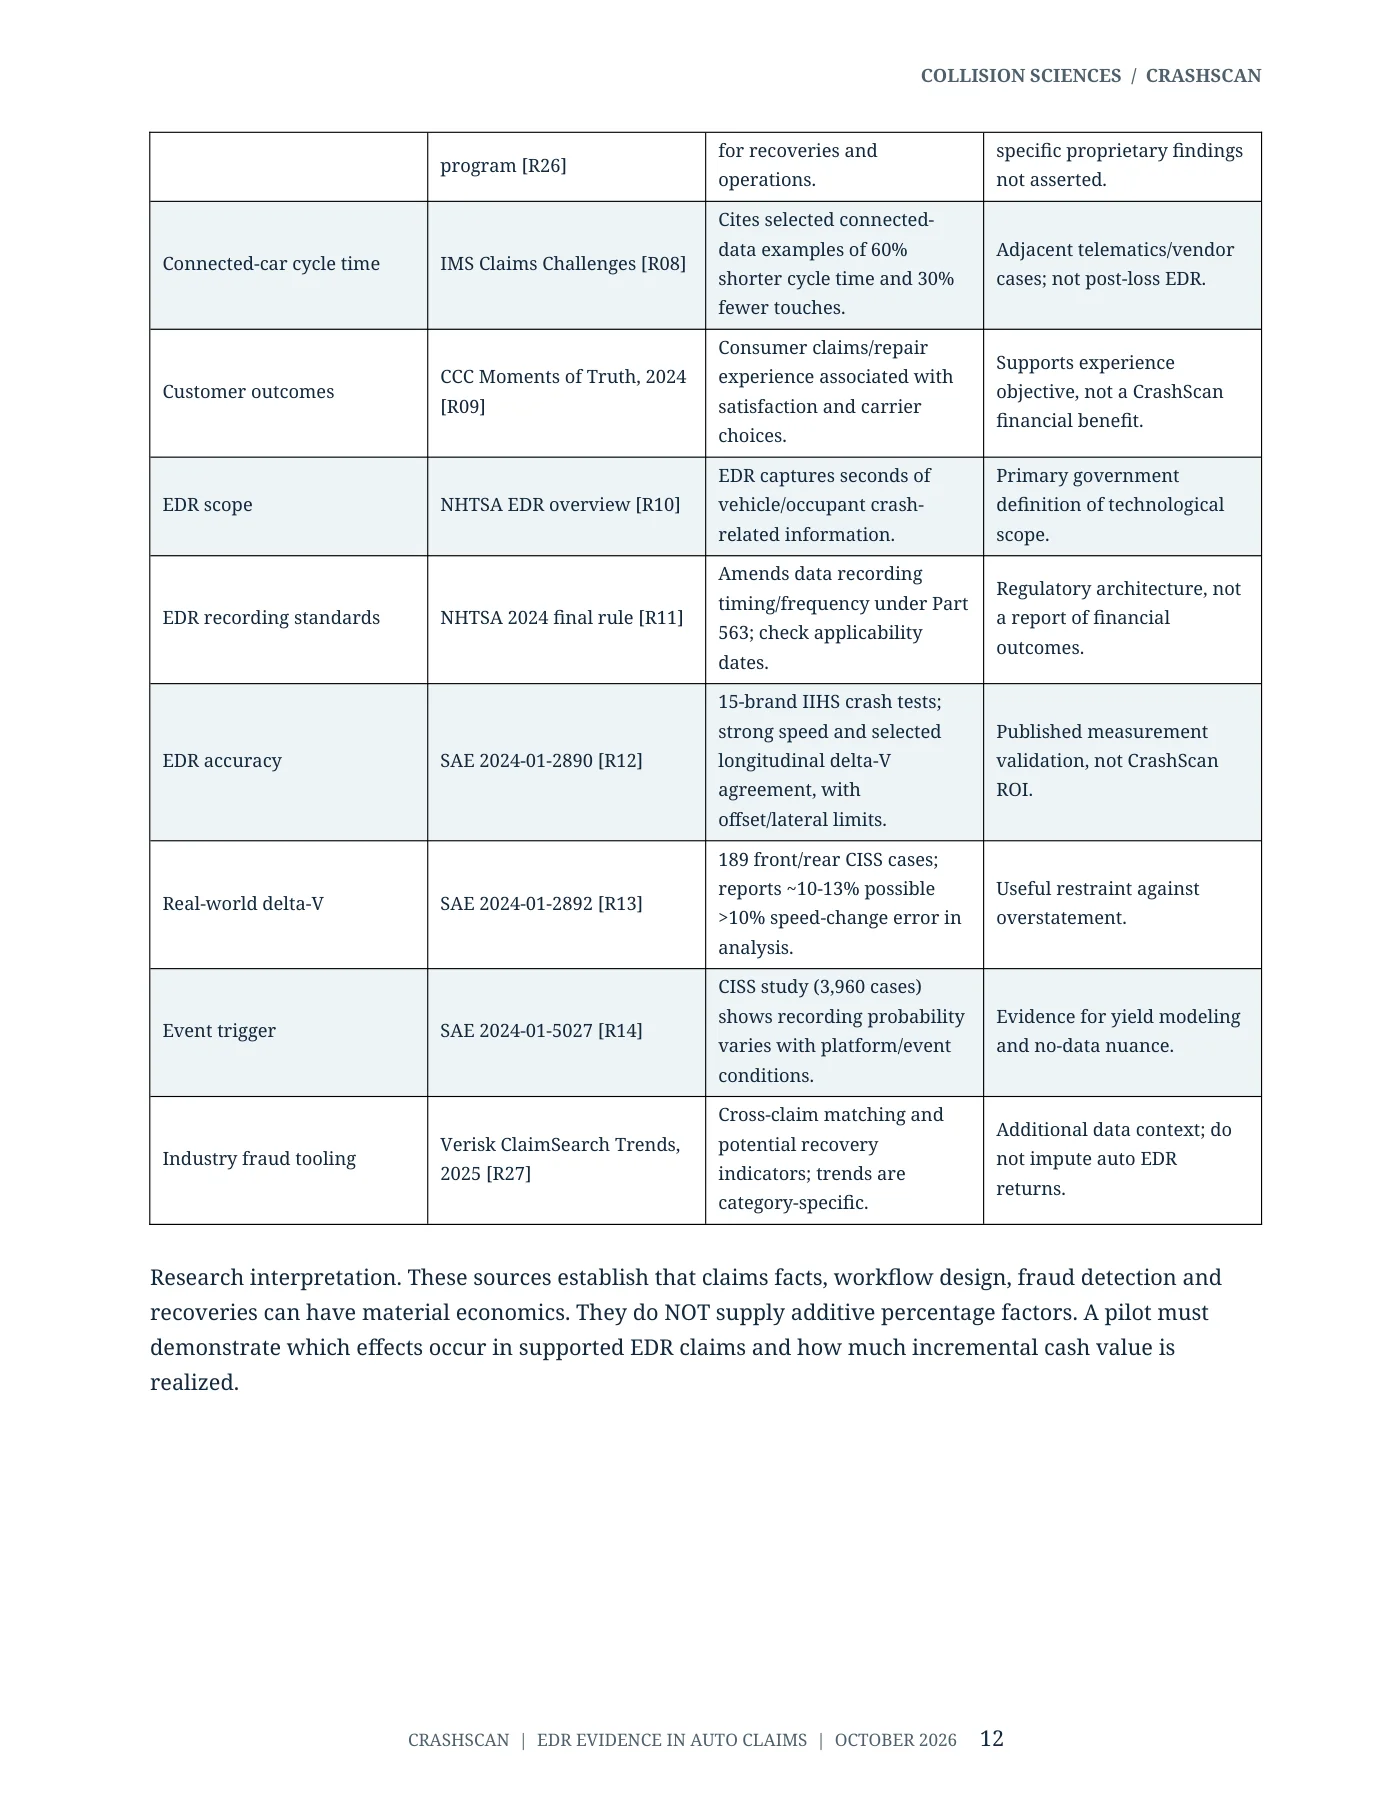
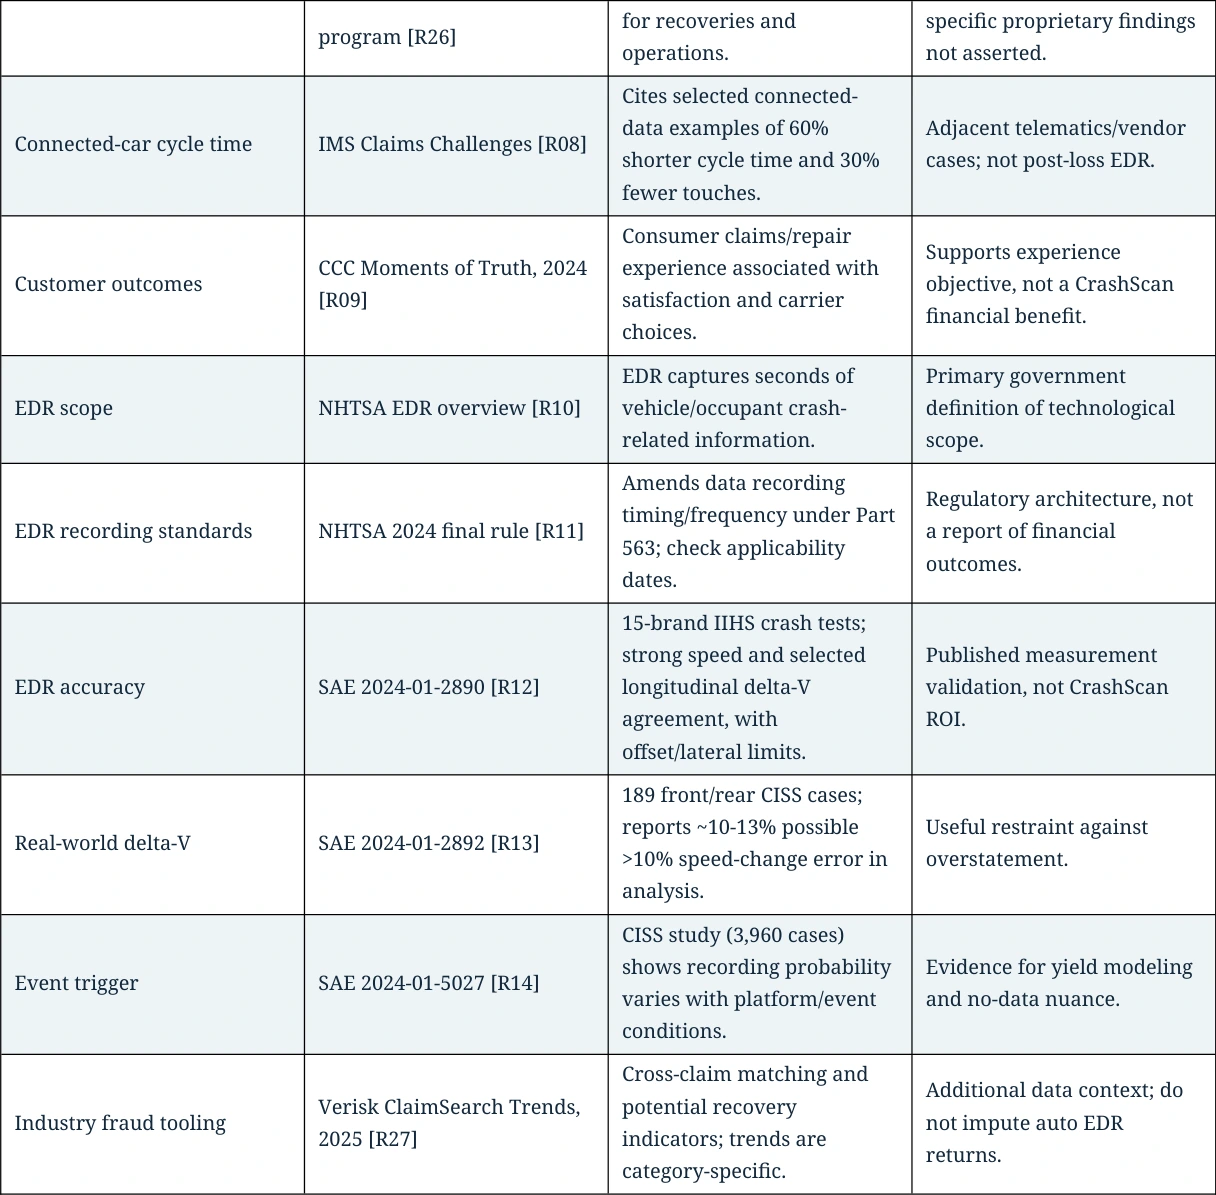
This appendix distinguishes a directly observed insurance-claims study from adjacent technology research, market context, scientific validation and provider commentary. A percentage from another product or cohort cannot be treated as a CrashScan result. Full sources are linked in Appendix D.
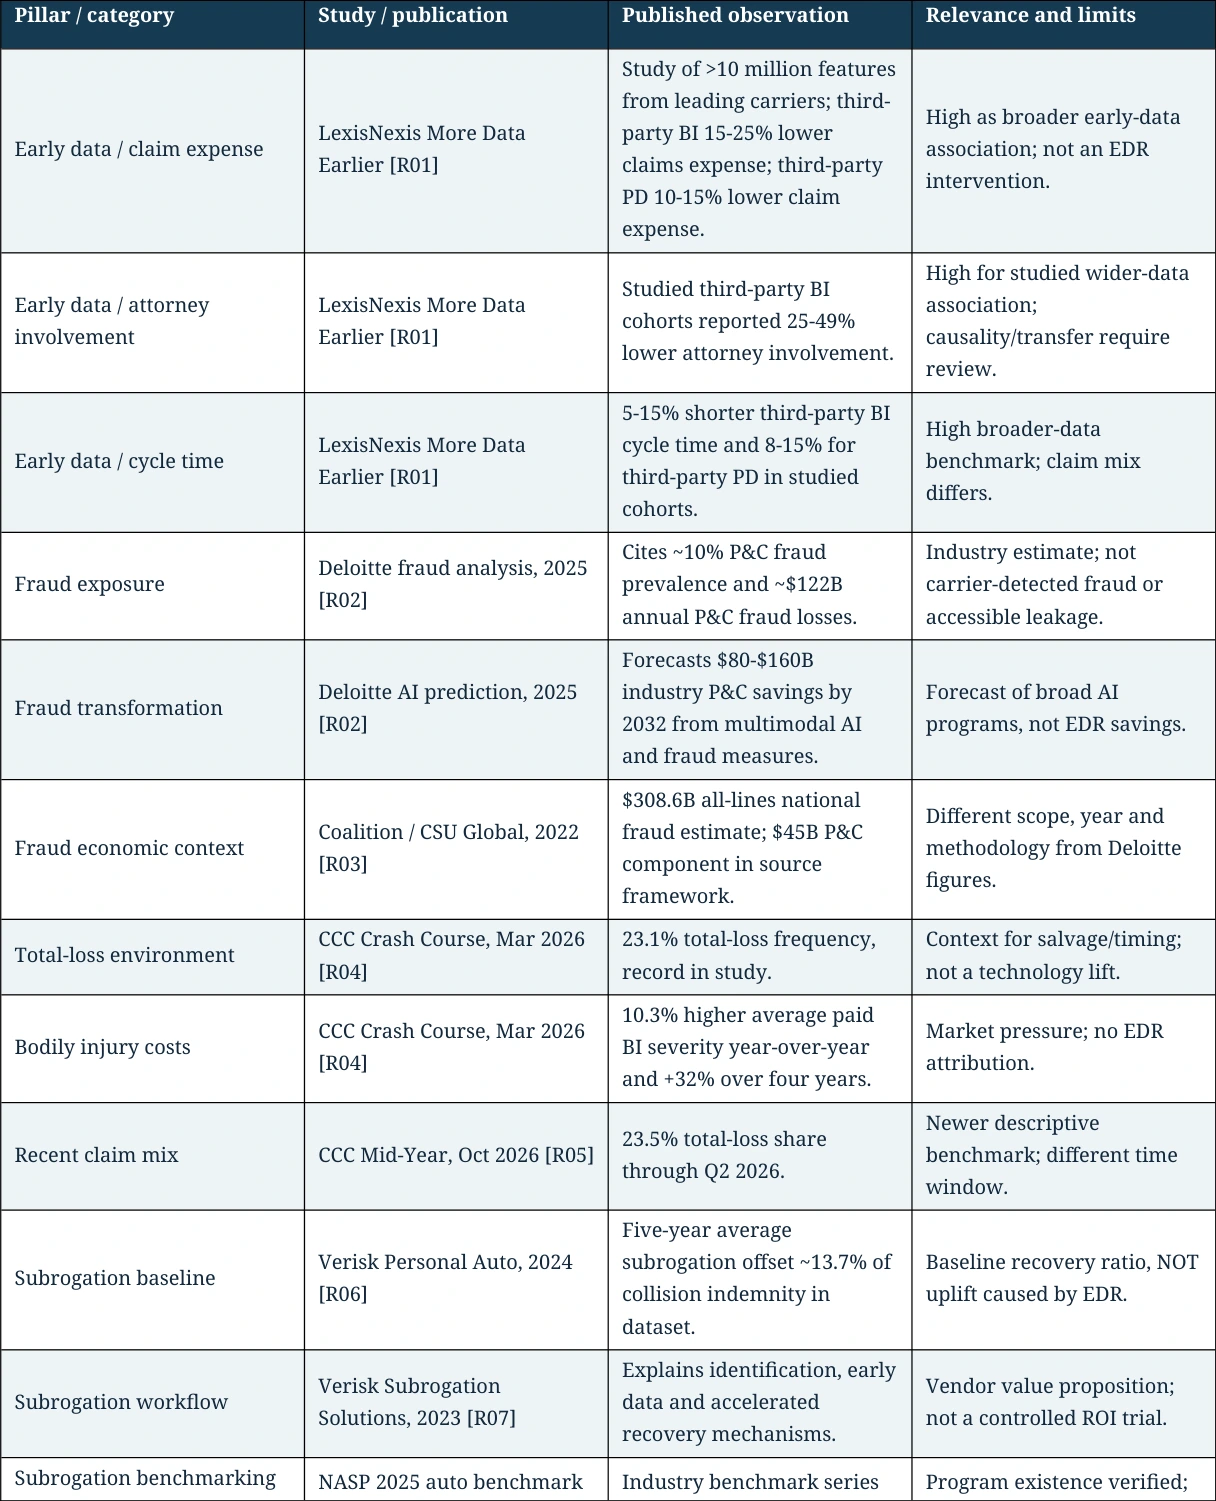
Read table as text
| Pillar / category | Study / publication | Published observation | Relevance and limits |
| Early data / claim expense | LexisNexis More Data Earlier [R01] | Study of >10 million features from leading carriers; third- party BI 15-25% lower claims expense; third-party PD 10-15% lower claim expense. | High as broader early-data association; not an EDR intervention. |
| Early data / attorney involvement | LexisNexis More Data Earlier [R01] | Studied third-party BI cohorts reported 25-49% lower attorney involvement. | High for studied wider-data association; causality/transfer require review. |
| Early data / cycle time | LexisNexis More Data Earlier [R01] | 5-15% shorter third-party BI cycle time and 8-15% for third-party PD in studied cohorts. | High broader-data benchmark; claim mix differs. |
| Fraud exposure | Deloitte fraud analysis, 2025 [R02] | Cites ~10% P&C fraud prevalence and ~$122B annual P&C fraud losses. | Industry estimate; not carrier-detected fraud or accessible leakage. |
| Fraud transformation | Deloitte AI prediction, 2025 [R02] | Forecasts $80-$160B industry P&C savings by 2032 from multimodal AI and fraud measures. | Forecast of broad AI programs, not EDR savings. |
| Fraud economic context | Coalition / CSU Global, 2022 [R03] | $308.6B all-lines national fraud estimate; $45B P&C component in source framework. | Different scope, year and methodology from Deloitte figures. |
| Total-loss environment | CCC Crash Course, Mar 2026 [R04] | 23.1% total-loss frequency, record in study. | Context for salvage/timing; not a technology lift. |
| Bodily injury costs | CCC Crash Course, Mar 2026 [R04] | 10.3% higher average paid BI severity year-over-year and +32% over four years. | Market pressure; no EDR attribution. |
| Recent claim mix | CCC Mid-Year, Oct 2026 [R05] | 23.5% total-loss share through Q2 2026. | Newer descriptive benchmark; different time window. |
| Subrogation baseline | Verisk Personal Auto, 2024 [R06] | Five-year average subrogation offset ~13.7% of collision indemnity in dataset. | Baseline recovery ratio, NOT uplift caused by EDR. |
| Subrogation workflow | Verisk Subrogation Solutions, 2023 [R07] | Explains identification, early data and accelerated recovery mechanisms. | Vendor value proposition; not a controlled ROI trial. |
| Subrogation benchmarking | NASP 2025 auto benchmark | Industry benchmark series | Program existence verified; |
Read table as text
| program [R26] | for recoveries and operations. | specific proprietary findings not asserted. | |
| Connected-car cycle time | IMS Claims Challenges [R08] | Cites selected connected- data examples of 60% shorter cycle time and 30% fewer touches. | Adjacent telematics/vendor cases; not post-loss EDR. |
| Customer outcomes | CCC Moments of Truth, 2024 [R09] | Consumer claims/repair experience associated with satisfaction and carrier choices. | Supports experience objective, not a CrashScan financial benefit. |
| EDR scope | NHTSA EDR overview [R10] | EDR captures seconds of vehicle/occupant crash- related information. | Primary government definition of technological scope. |
| EDR recording standards | NHTSA 2024 final rule [R11] | Amends data recording timing/frequency under Part 563; check applicability dates. | Regulatory architecture, not a report of financial outcomes. |
| EDR accuracy | SAE 2024-01-2890 [R12] | 15-brand IIHS crash tests; strong speed and selected longitudinal delta-V agreement, with offset/lateral limits. | Published measurement validation, not CrashScan ROI. |
| Real-world delta-V | SAE 2024-01-2892 [R13] | 189 front/rear CISS cases; reports ~10-13% possible >10% speed-change error in analysis. | Useful restraint against overstatement. |
| Event trigger | SAE 2024-01-5027 [R14] | CISS study (3,960 cases) shows recording probability varies with platform/event conditions. | Evidence for yield modeling and no-data nuance. |
| Industry fraud tooling | Verisk ClaimSearch Trends, 2025 [R27] | Cross-claim matching and potential recovery indicators; trends are category-specific. | Additional data context; do not impute auto EDR returns. |
Research interpretation. These sources establish that claims facts, workflow design, fraud detection and recoveries can have material economics. They do NOT supply additive percentage factors. A pilot must demonstrate which effects occur in supported EDR claims and how much incremental cash value is realized.
13 / In this resource
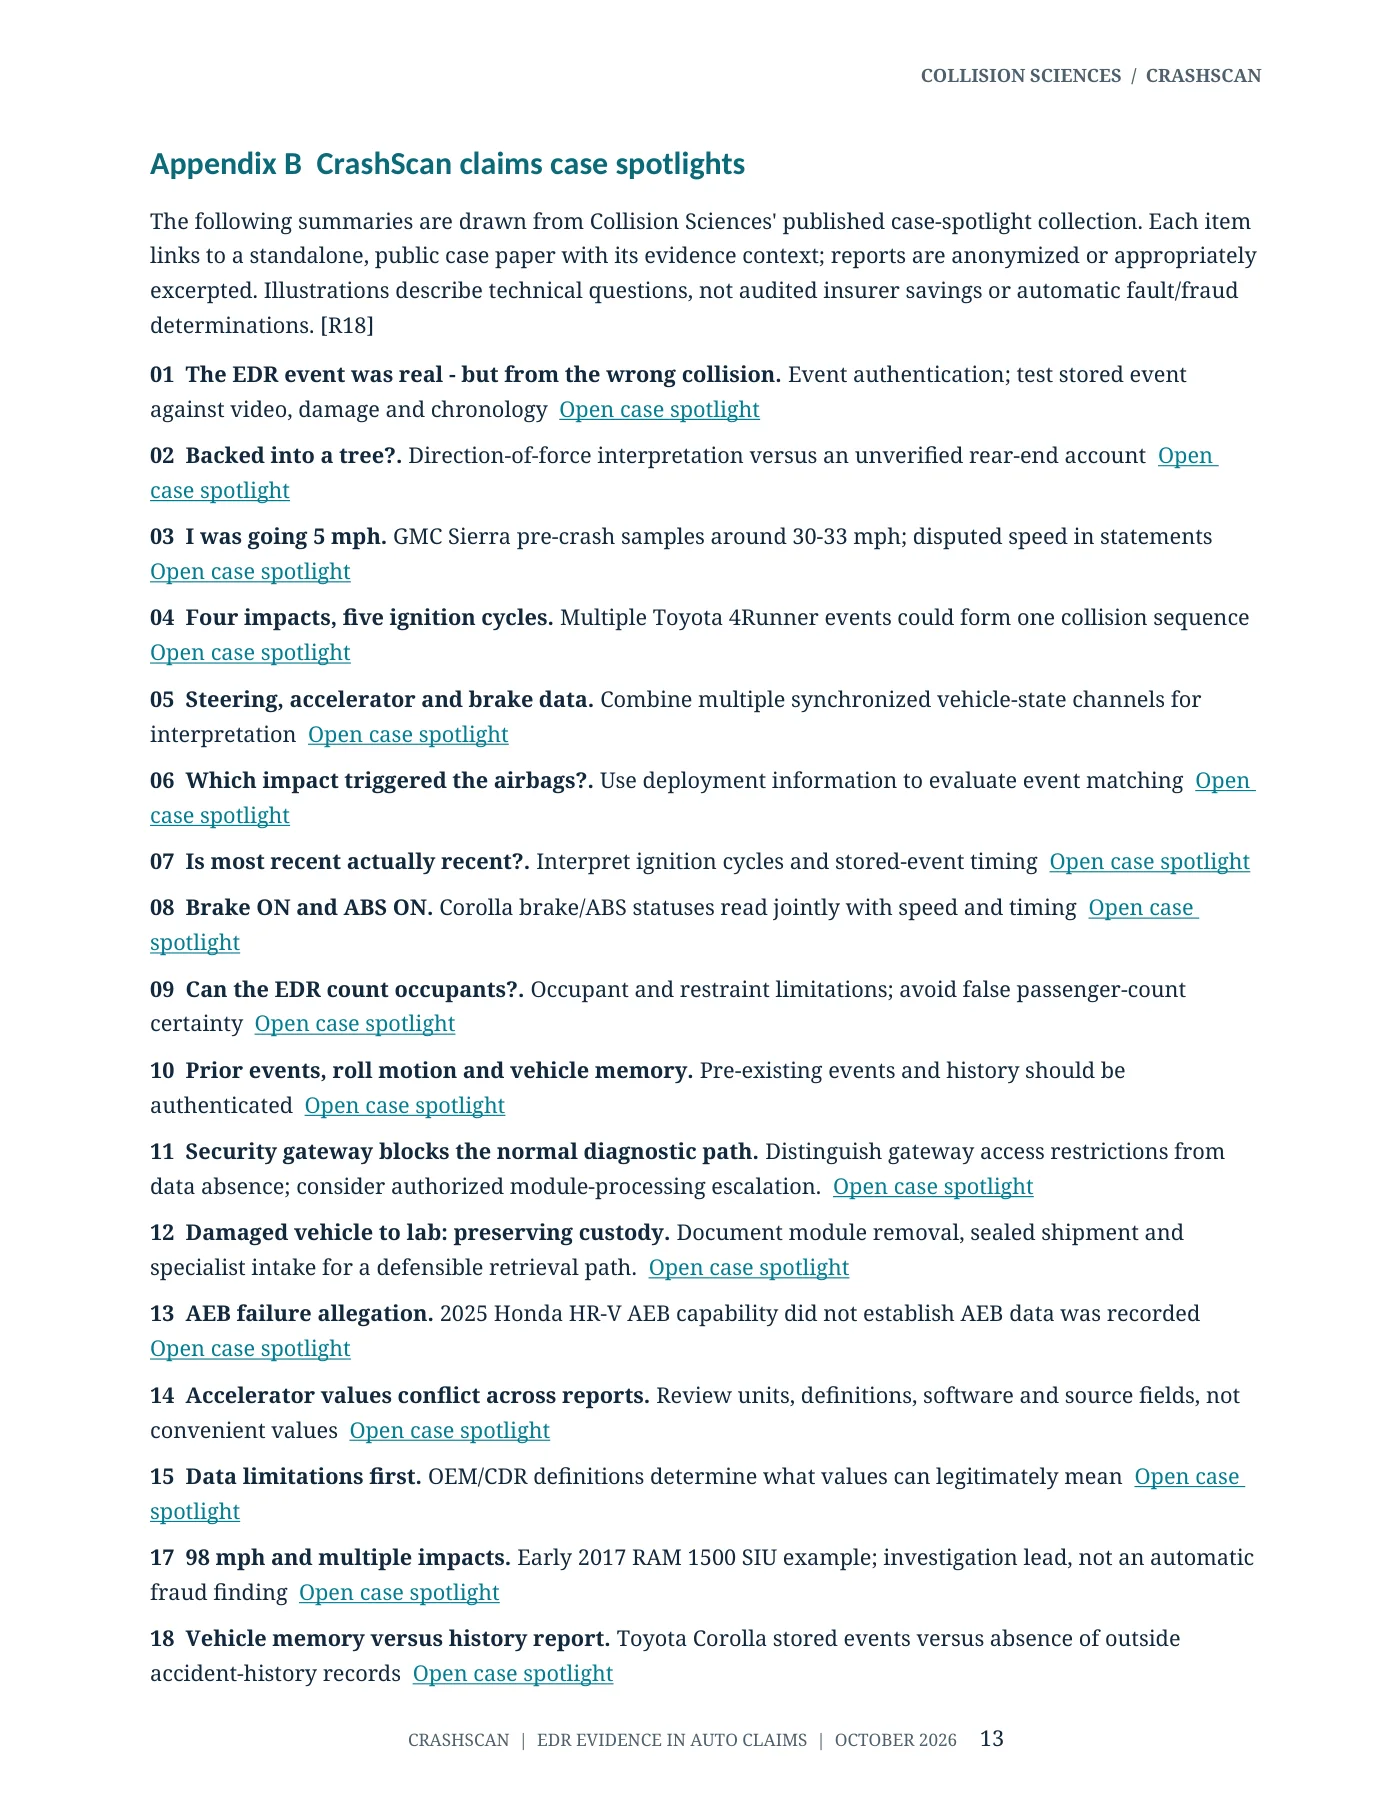
Appendix B CrashScan claims case spotlights
The following summaries are drawn from Collision Sciences' published case-spotlight collection. Each item links to a standalone, public case paper with its evidence context; reports are anonymized or appropriately excerpted. Illustrations describe technical questions, not audited insurer savings or automatic fault/fraud determinations. [R18]
01 The EDR event was real - but from the wrong collision. Event authentication; test stored event against video, damage and chronology Open case spotlight
02 Backed into a tree?. Direction-of-force interpretation versus an unverified rear-end account Open case spotlight
03 I was going 5 mph. GMC Sierra pre-crash samples around 30-33 mph; disputed speed in statements Open case spotlight
04 Four impacts, five ignition cycles. Multiple Toyota 4Runner events could form one collision sequence Open case spotlight
05 Steering, accelerator and brake data. Combine multiple synchronized vehicle-state channels for interpretation Open case spotlight
06 Which impact triggered the airbags?. Use deployment information to evaluate event matching Open case spotlight
07 Is most recent actually recent?. Interpret ignition cycles and stored-event timing Open case spotlight
08 Brake ON and ABS ON. Corolla brake/ABS statuses read jointly with speed and timing Open case spotlight
09 Can the EDR count occupants?. Occupant and restraint limitations; avoid false passenger-count certainty Open case spotlight
10 Prior events, roll motion and vehicle memory. Pre-existing events and history should be authenticated Open case spotlight
11 Security gateway blocks the normal diagnostic path. Distinguish gateway access restrictions from data absence; consider authorized module-processing escalation. Open case spotlight
12 Damaged vehicle to lab: preserving custody. Document module removal, sealed shipment and specialist intake for a defensible retrieval path. Open case spotlight
13 AEB failure allegation. 2025 Honda HR-V AEB capability did not establish AEB data was recorded Open case spotlight
14 Accelerator values conflict across reports. Review units, definitions, software and source fields, not convenient values Open case spotlight
15 Data limitations first. OEM/CDR definitions determine what values can legitimately mean Open case spotlight
17 98 mph and multiple impacts. Early 2017 RAM 1500 SIU example; investigation lead, not an automatic fraud finding Open case spotlight
18 Vehicle memory versus history report. Toyota Corolla stored events versus absence of outside accident-history records Open case spotlight
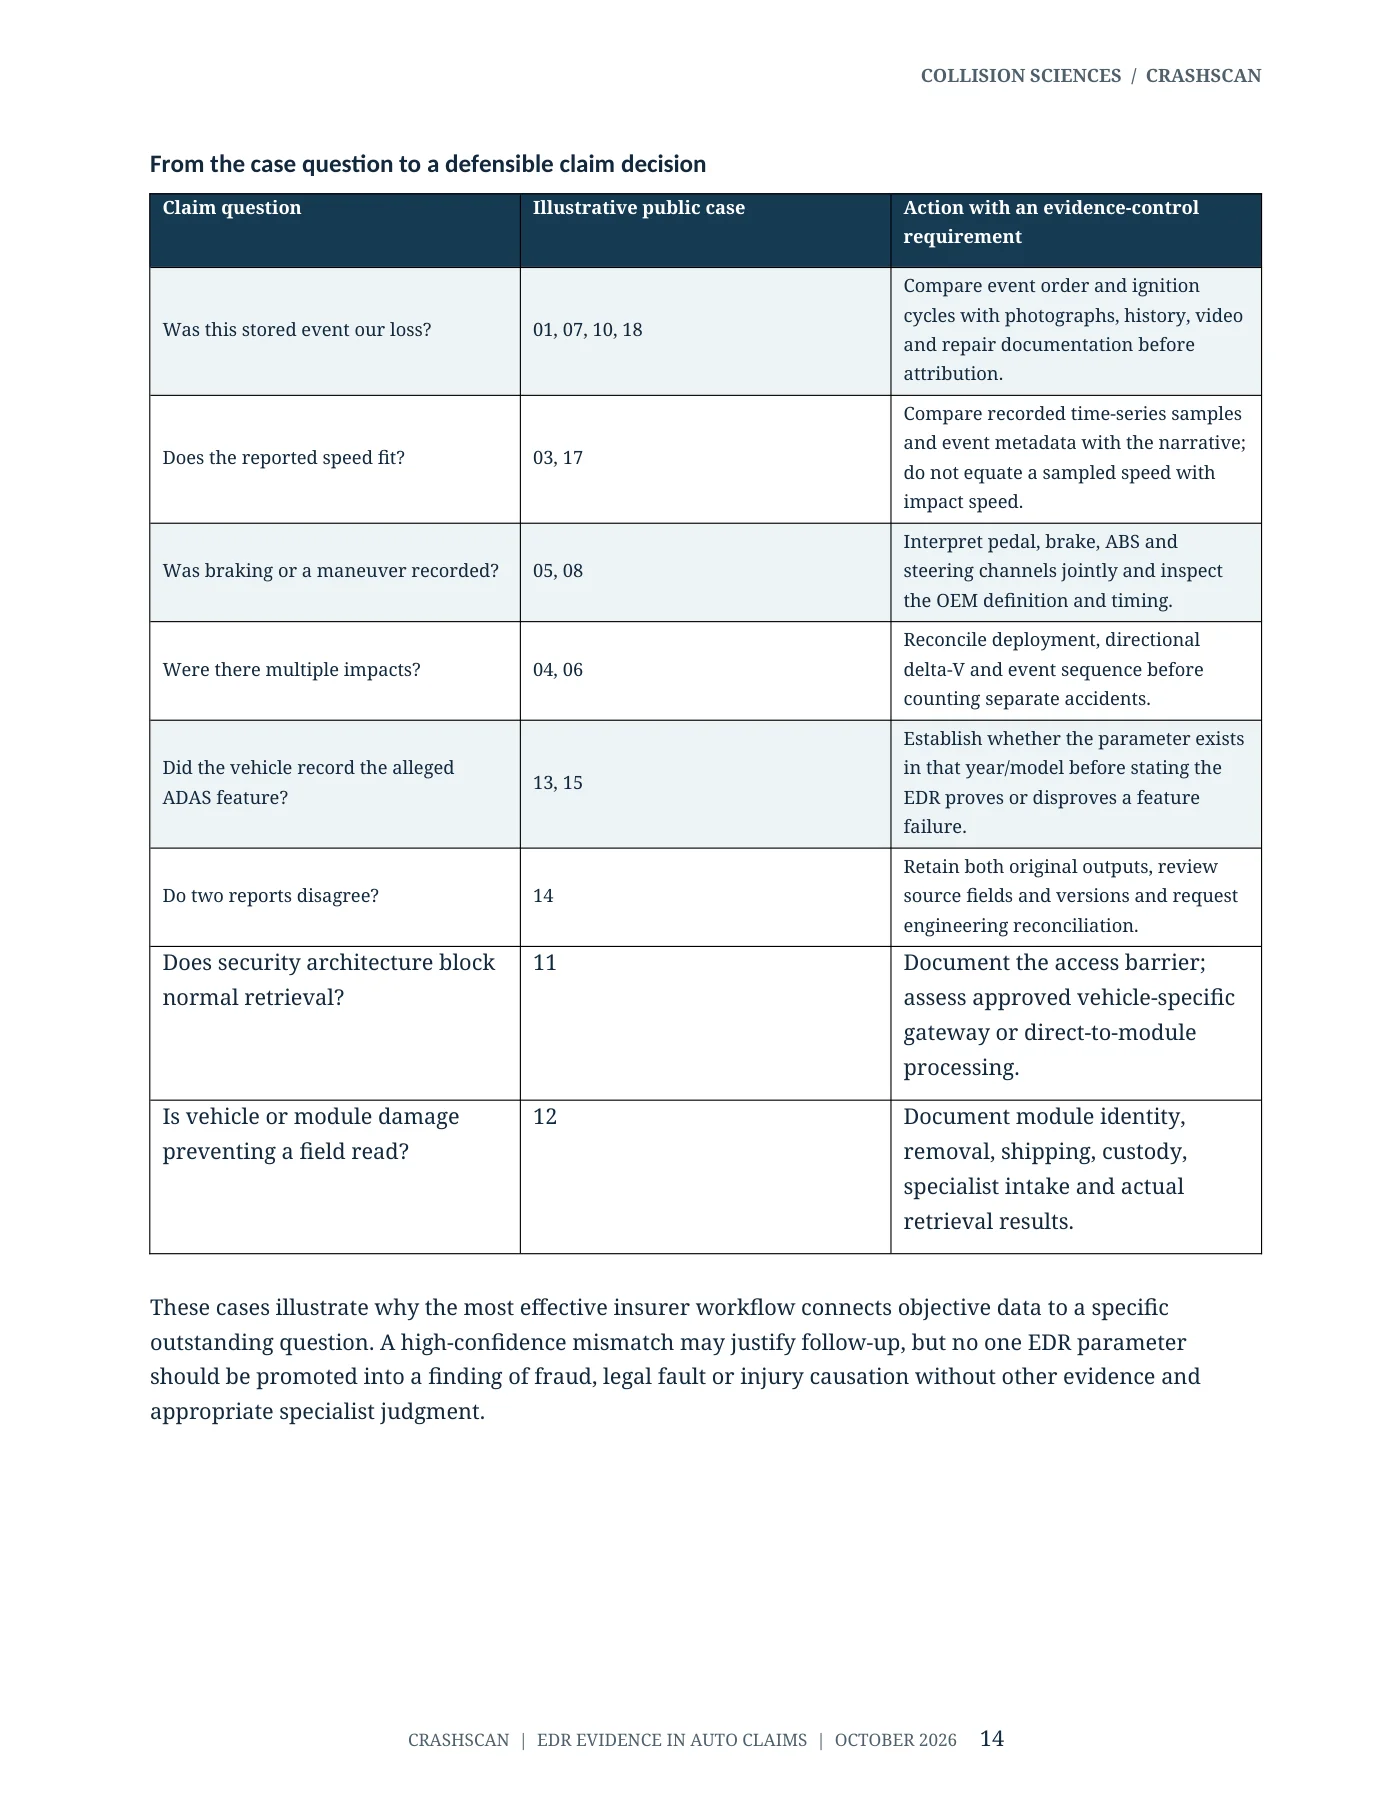
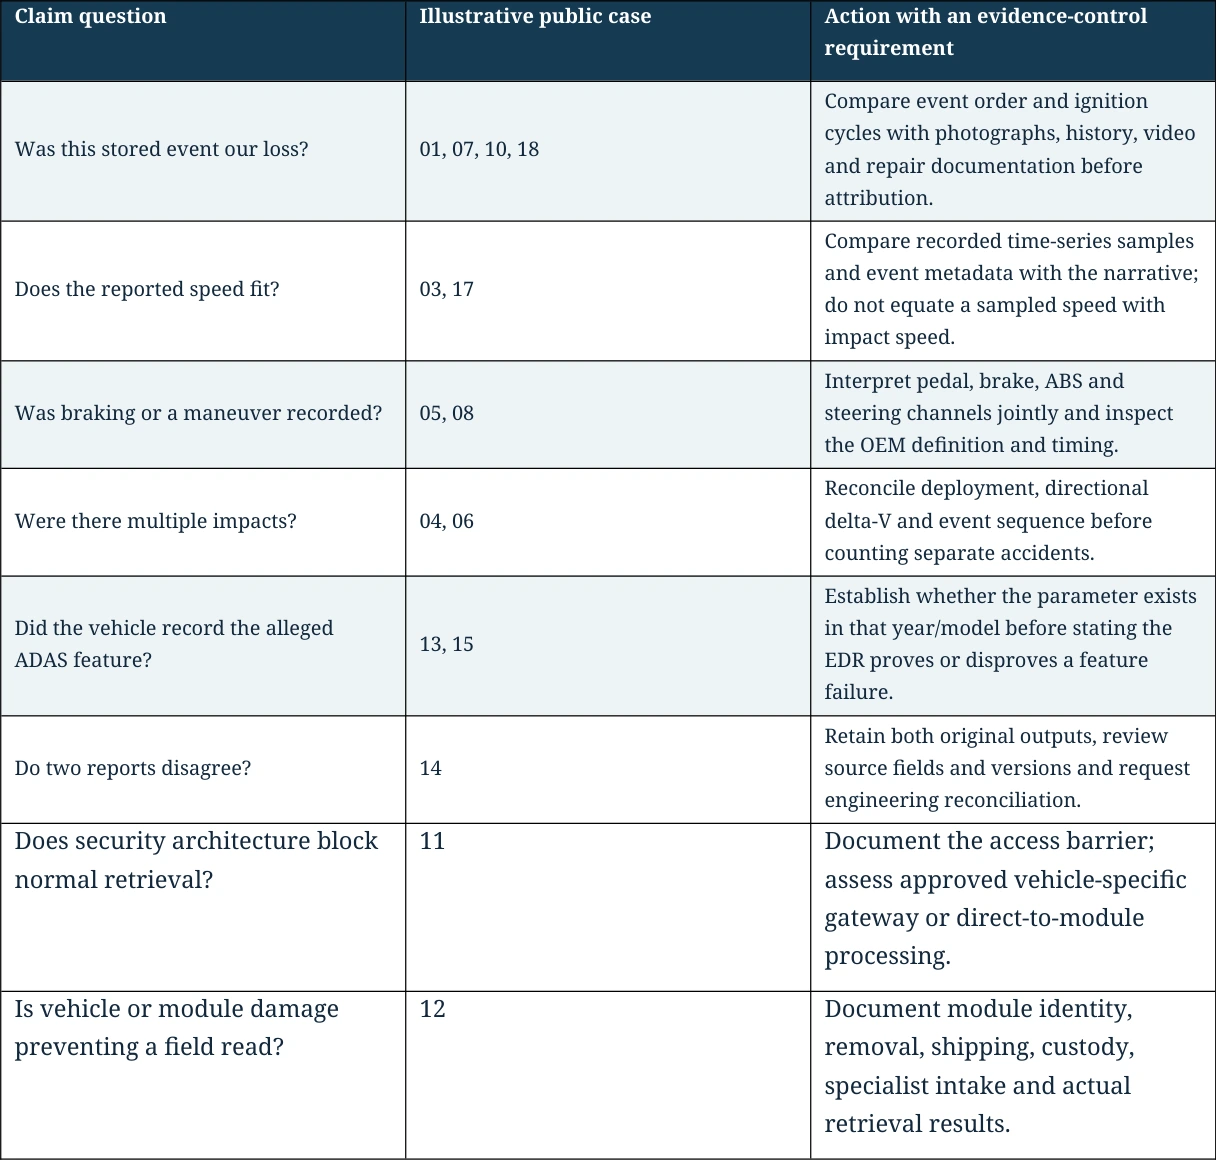
From the case question to a defensible claim decision
Read table as text
| Claim question | Illustrative public case | Action with an evidence-control requirement |
| Was this stored event our loss? | 01, 07, 10, 18 | Compare event order and ignition cycles with photographs, history, video and repair documentation before attribution. |
| Does the reported speed fit? | 03, 17 | Compare recorded time-series samples and event metadata with the narrative; do not equate a sampled speed with impact speed. |
| Was braking or a maneuver recorded? | 05, 08 | Interpret pedal, brake, ABS and steering channels jointly and inspect the OEM definition and timing. |
| Were there multiple impacts? | 04, 06 | Reconcile deployment, directional delta-V and event sequence before counting separate accidents. |
| Did the vehicle record the alleged ADAS feature? | 13, 15 | Establish whether the parameter exists in that year/model before stating the EDR proves or disproves a feature failure. |
| Do two reports disagree? | 14 | Retain both original outputs, review source fields and versions and request engineering reconciliation. |
| Does security architecture block normal retrieval? | 11 | Document the access barrier; assess approved vehicle-specific gateway or direct-to-module processing. |
| Is vehicle or module damage preventing a field read? | 12 | Document module identity, removal, shipping, custody, specialist intake and actual retrieval results. |
These cases illustrate why the most effective insurer workflow connects objective data to a specific outstanding question. A high-confidence mismatch may justify follow-up, but no one EDR parameter should be promoted into a finding of fraud, legal fault or injury causation without other evidence and appropriate specialist judgment.
14 / In this resource
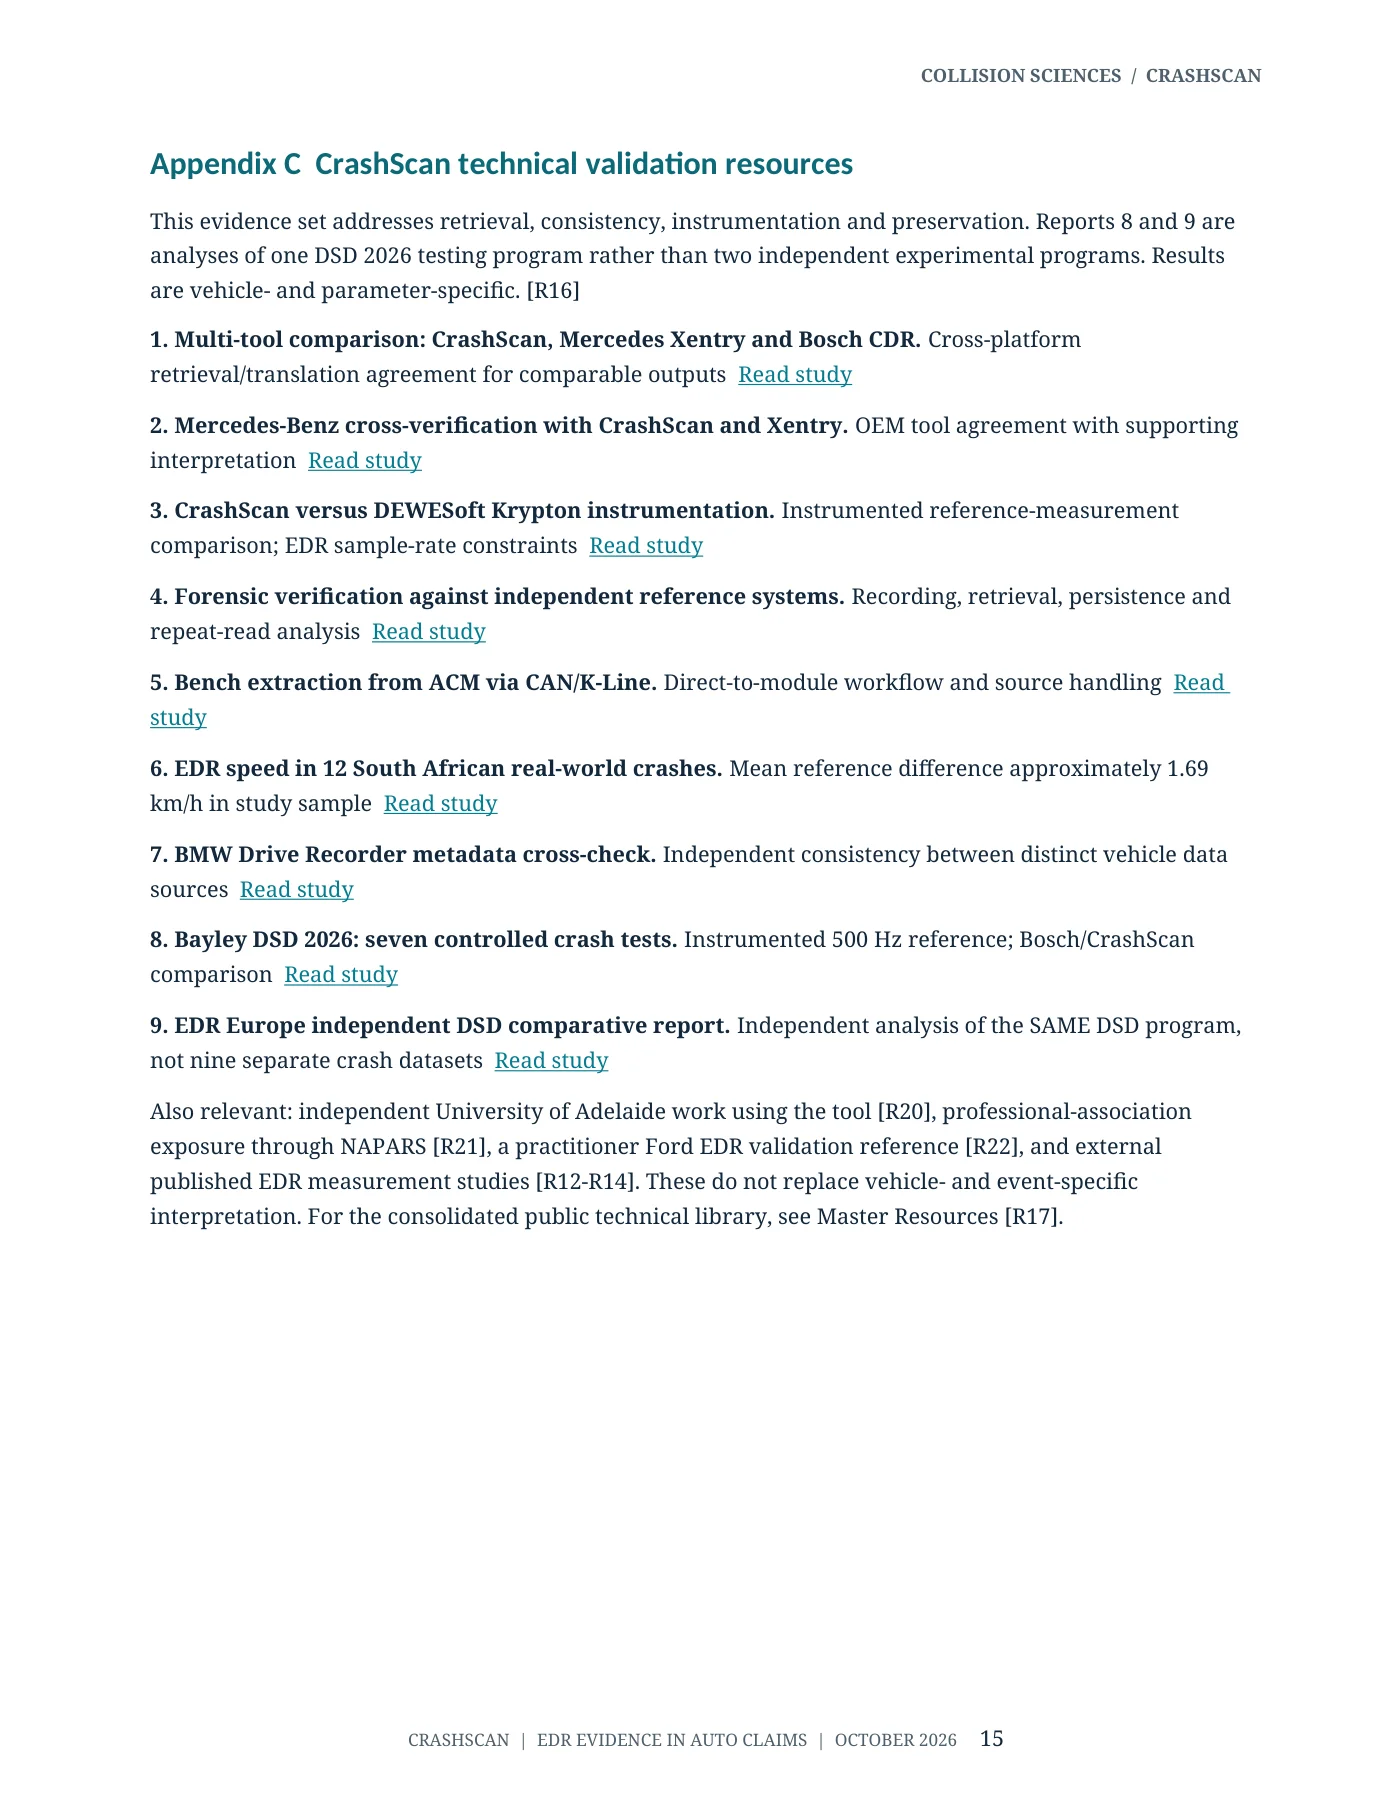
Appendix C CrashScan technical validation resources
This evidence set addresses retrieval, consistency, instrumentation and preservation. Reports 8 and 9 are analyses of one DSD 2026 testing program rather than two independent experimental programs. Results are vehicle- and parameter-specific. [R16]
1. Multi-tool comparison: CrashScan, Mercedes Xentry and Bosch CDR. Cross-platform retrieval/translation agreement for comparable outputs Read study
2. Mercedes-Benz cross-verification with CrashScan and Xentry. OEM tool agreement with supporting interpretation Read study
3. CrashScan versus DEWESoft Krypton instrumentation. Instrumented reference-measurement comparison; EDR sample-rate constraints Read study
4. Forensic verification against independent reference systems. Recording, retrieval, persistence and repeat-read analysis Read study
5. Bench extraction from ACM via CAN/K-Line. Direct-to-module workflow and source handling Read study
6. EDR speed in 12 South African real-world crashes. Mean reference difference approximately 1.69 km/h in study sample Read study
7. BMW Drive Recorder metadata cross-check. Independent consistency between distinct vehicle data sources Read study
8. Bayley DSD 2026: seven controlled crash tests. Instrumented 500 Hz reference; Bosch/CrashScan comparison Read study
9. EDR Europe independent DSD comparative report. Independent analysis of the SAME DSD program, not nine separate crash datasets Read study
Also relevant: independent University of Adelaide work using the tool [R20], professional-association exposure through NAPARS [R21], a practitioner Ford EDR validation reference [R22], and external published EDR measurement studies [R12-R14]. These do not replace vehicle- and event-specific interpretation. For the consolidated public technical library, see Master Resources [R17].
15 / In this resource
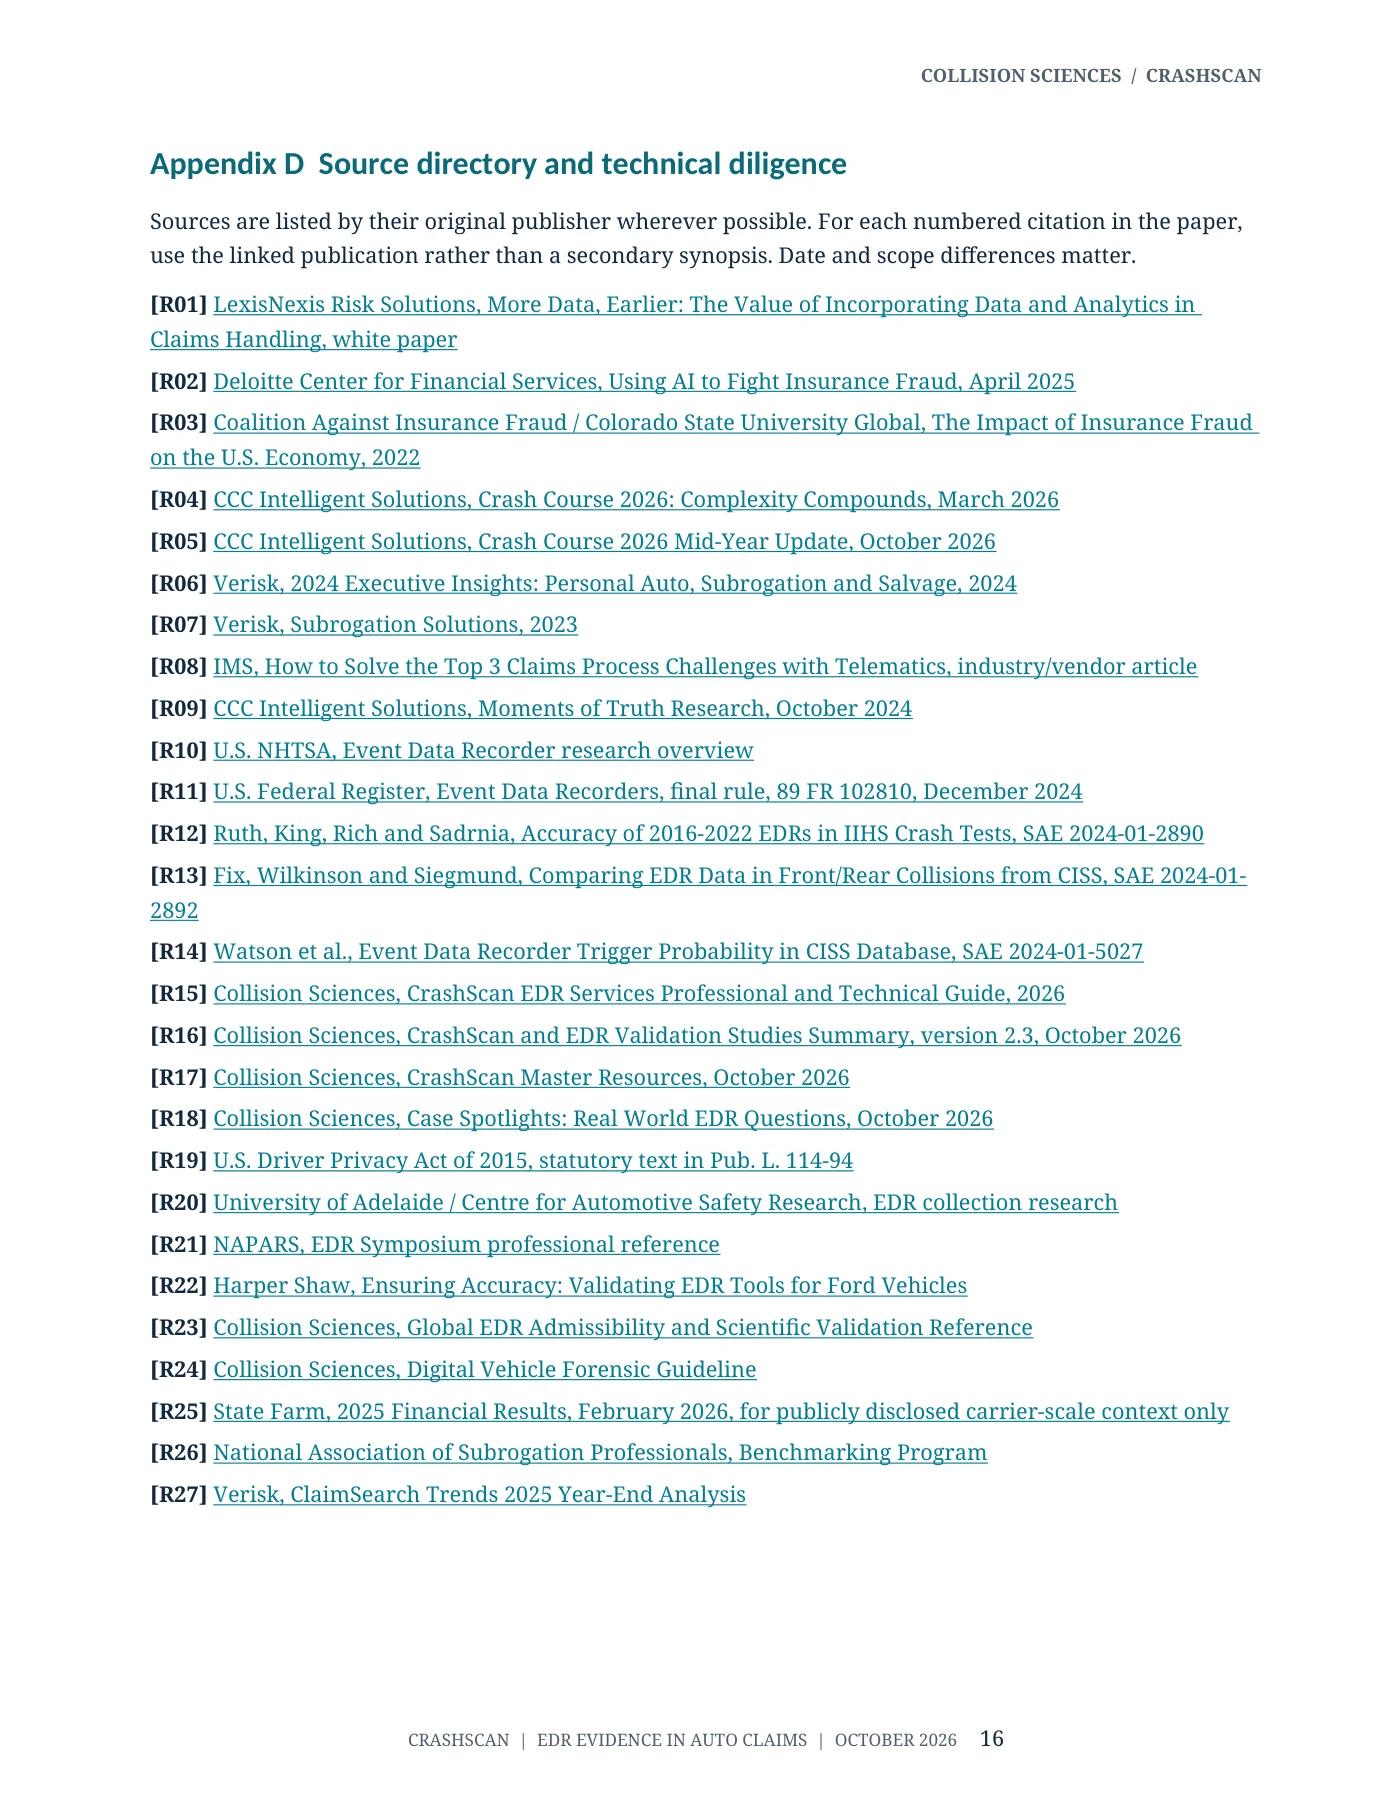
Appendix D source directory and technical diligence
Sources are listed by their original publisher wherever possible. For each numbered citation in the paper, use the linked publication rather than a secondary synopsis. Date and scope differences matter.
[R01] LexisNexis Risk Solutions, More Data, Earlier: The Value of Incorporating Data and Analytics in Claims Handling, white paper [R02] Deloitte Center for Financial Services, Using AI to Fight Insurance Fraud, April 2025 [R03] Coalition Against Insurance Fraud / Colorado State University Global, The Impact of Insurance Fraud on the U.S.
Economy, 2022 [R04] CCC Intelligent Solutions, Crash Course 2026: Complexity Compounds, March 2026 [R05] CCC Intelligent Solutions, Crash Course 2026 Mid-Year Update, October 2026 [R06] Verisk, 2024 Executive Insights: Personal Auto, Subrogation and Salvage, 2024 [R07] Verisk, Subrogation Solutions, 2023 [R08] IMS, How to Solve the Top 3 Claims Process Challenges with Telematics, industry/vendor article [R09] CCC Intelligent Solutions, Moments of Truth Research, October 2024 [R10] U.S. NHTSA, Event Data Recorder research overview [R11] U.S.
Federal Register, Event Data Recorders, final rule, 89 FR 102810, December 2024 [R12] Ruth, King, Rich and Sadrnia, Accuracy of 2016-2022 EDRs in IIHS Crash Tests, SAE 2024-01-2890 [R13] Fix, Wilkinson and Siegmund, Comparing EDR Data in Front/Rear Collisions from CISS, SAE 2024-01-2892 [R14] Watson et al., Event Data Recorder Trigger Probability in CISS Database, SAE 2024-01-5027 [R15] Collision Sciences, CrashScan EDR Services Professional and Technical Guide, 2026 [R16] Collision Sciences, CrashScan and EDR Validation Studies Summary, version 2.3, October 2026 [R17] Collision Sciences, CrashScan Master Resources, October 2026 [R18] Collision Sciences, Case Spotlights: Real World EDR Questions, October 2026 [R19] U.S.
Driver Privacy Act of 2015, statutory text in Pub.
L. 114-94 [R20] University of Adelaide / Centre for Automotive Safety Research, EDR collection research [R21] NAPARS, EDR Symposium professional reference [R22] Harper Shaw, Ensuring Accuracy: Validating EDR Tools for Ford Vehicles [R23] Collision Sciences, Global EDR Admissibility and Scientific Validation Reference [R24] Collision Sciences, Digital Vehicle Forensic Guideline [R25] State Farm, 2025 Financial Results, February 2026, for publicly disclosed carrier-scale context only [R26] National Association of Subrogation Professionals, Benchmarking Program [R27] Verisk, ClaimSearch Trends 2025 Year-End Analysis
16 / In this resource
Appendix E pilot evaluation and claims-finance scorecard
For an insurer technical due-diligence request
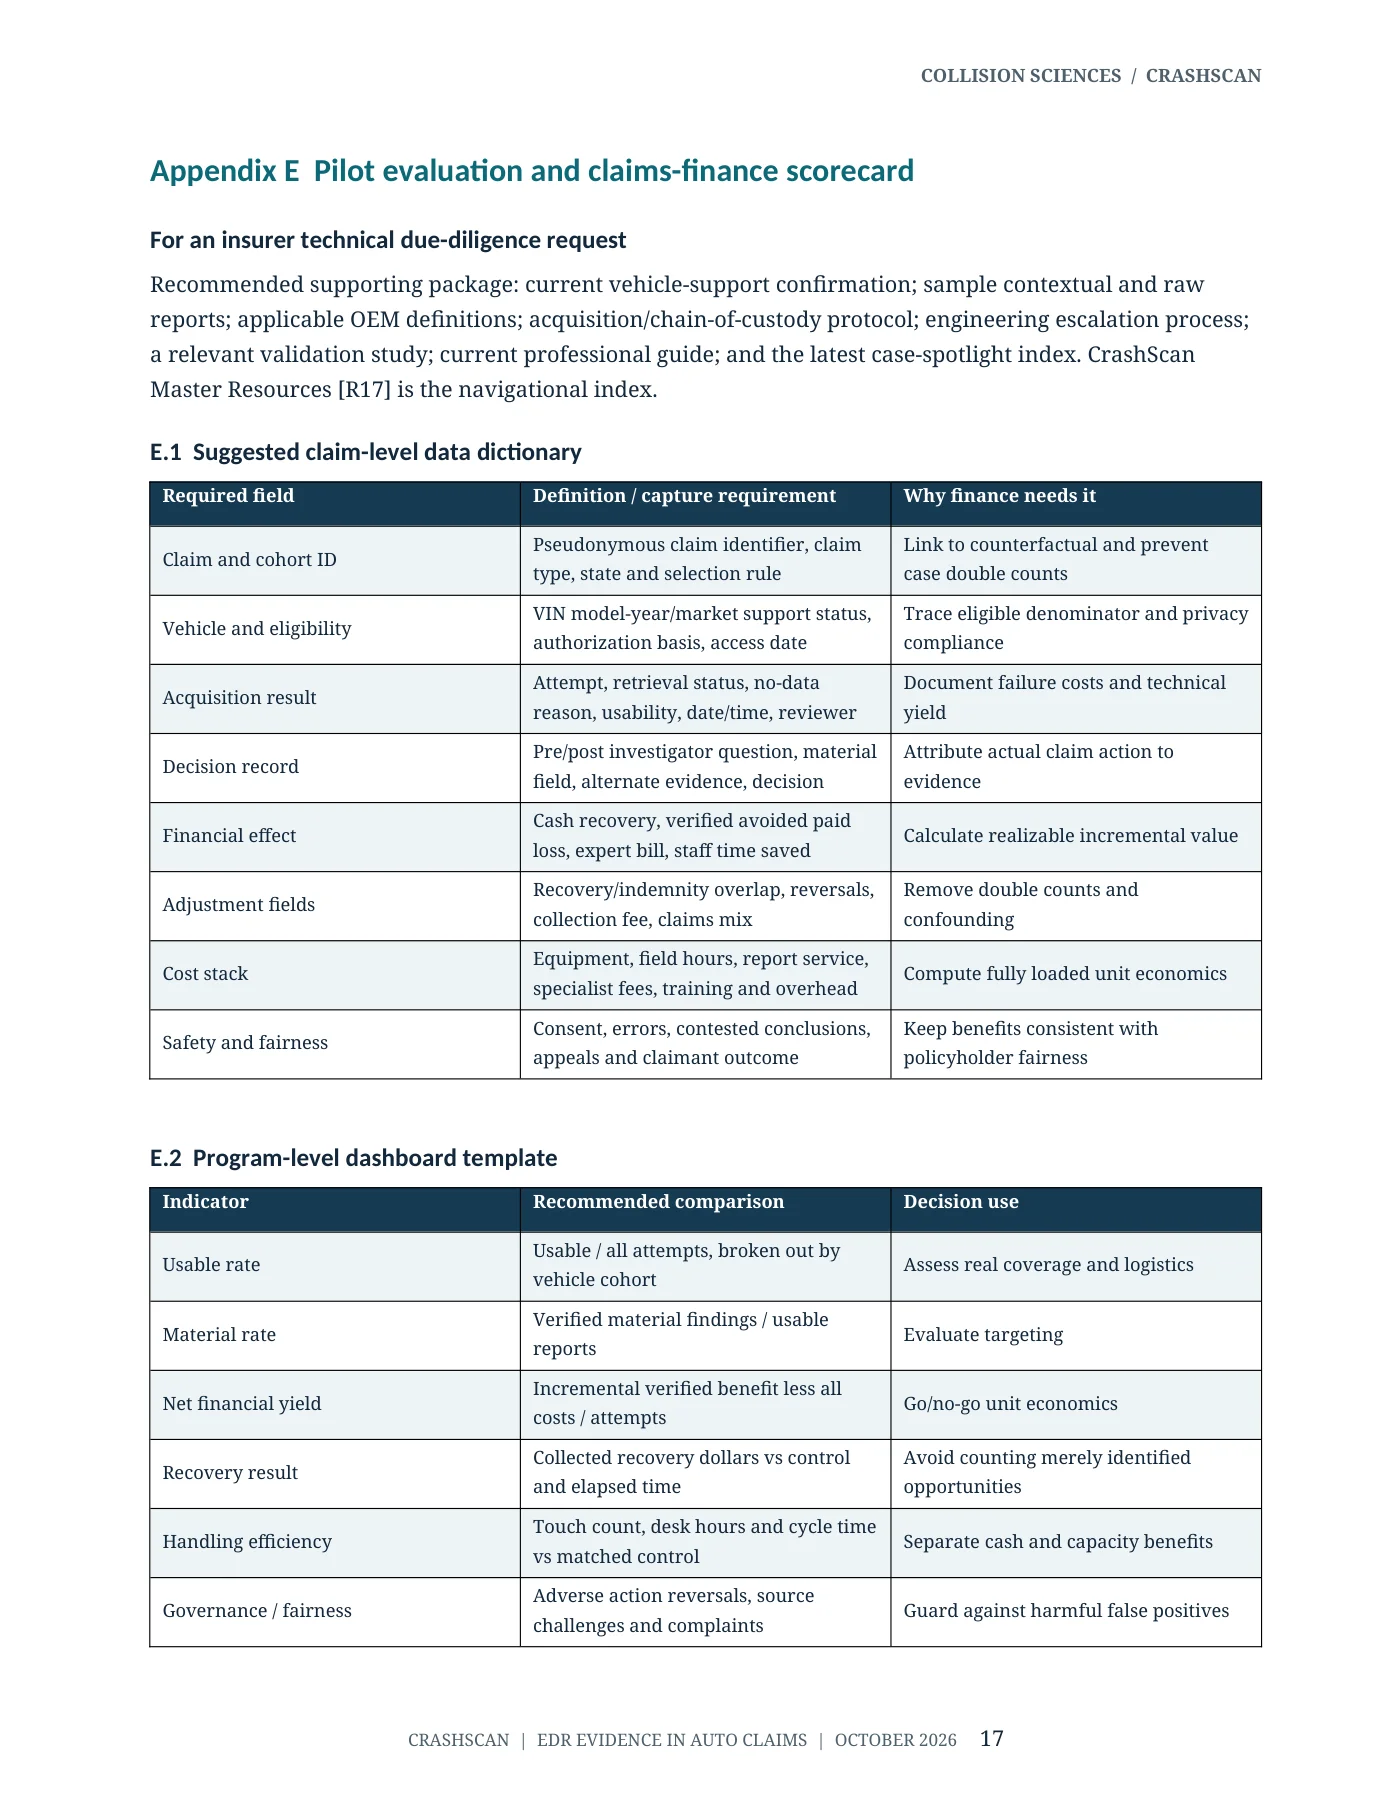
Recommended supporting package: current vehicle-support confirmation; sample contextual and raw reports; applicable OEM definitions; acquisition/chain-of-custody protocol; engineering escalation process; a relevant validation study; current professional guide; and the latest case-spotlight index. CrashScan Master Resources [R17] is the navigational index.
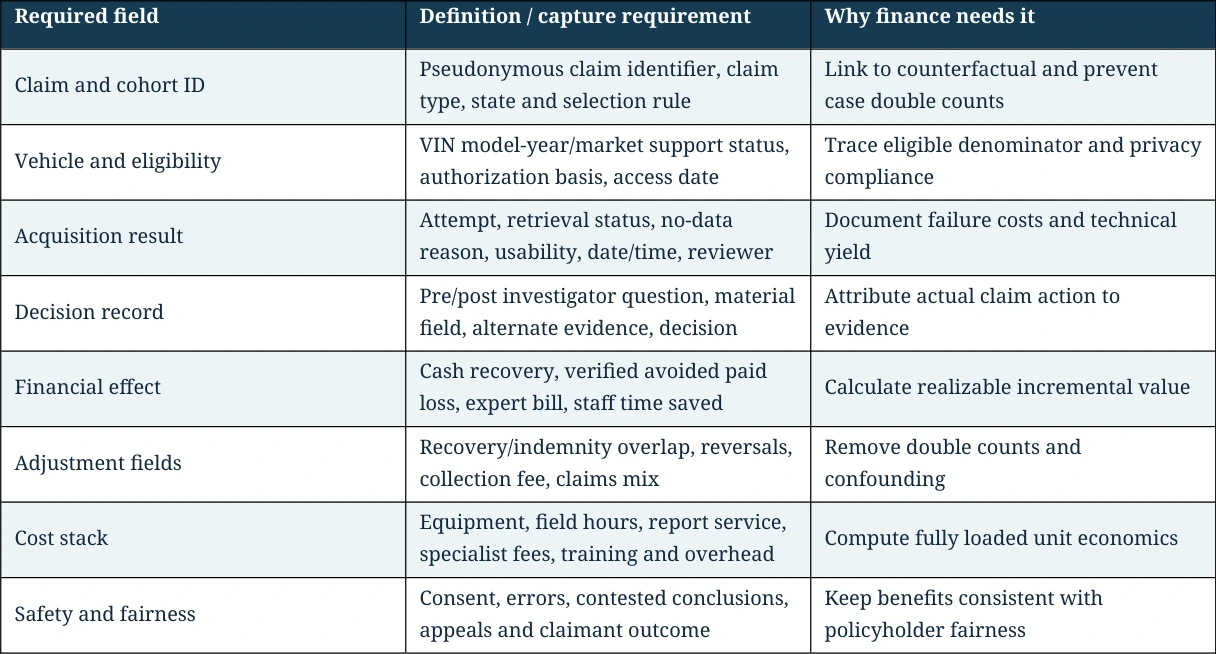
E.1. Suggested claim-level data dictionary
Read table as text
| Required field | Definition / capture requirement | Why finance needs it |
| Claim and cohort ID | Pseudonymous claim identifier, claim type, state and selection rule | Link to counterfactual and prevent case double counts |
| Vehicle and eligibility | VIN model-year/market support status, authorization basis, access date | Trace eligible denominator and privacy compliance |
| Acquisition result | Attempt, retrieval status, no-data reason, usability, date/time, reviewer | Document failure costs and technical yield |
| Decision record | Pre/post investigator question, material field, alternate evidence, decision | Attribute actual claim action to evidence |
| Financial effect | Cash recovery, verified avoided paid loss, expert bill, staff time saved | Calculate realizable incremental value |
| Adjustment fields | Recovery/indemnity overlap, reversals, collection fee, claims mix | Remove double counts and confounding |
| Cost stack | Equipment, field hours, report service, specialist fees, training and overhead | Compute fully loaded unit economics |
| Safety and fairness | Consent, errors, contested conclusions, appeals and claimant outcome | Keep benefits consistent with policyholder fairness |
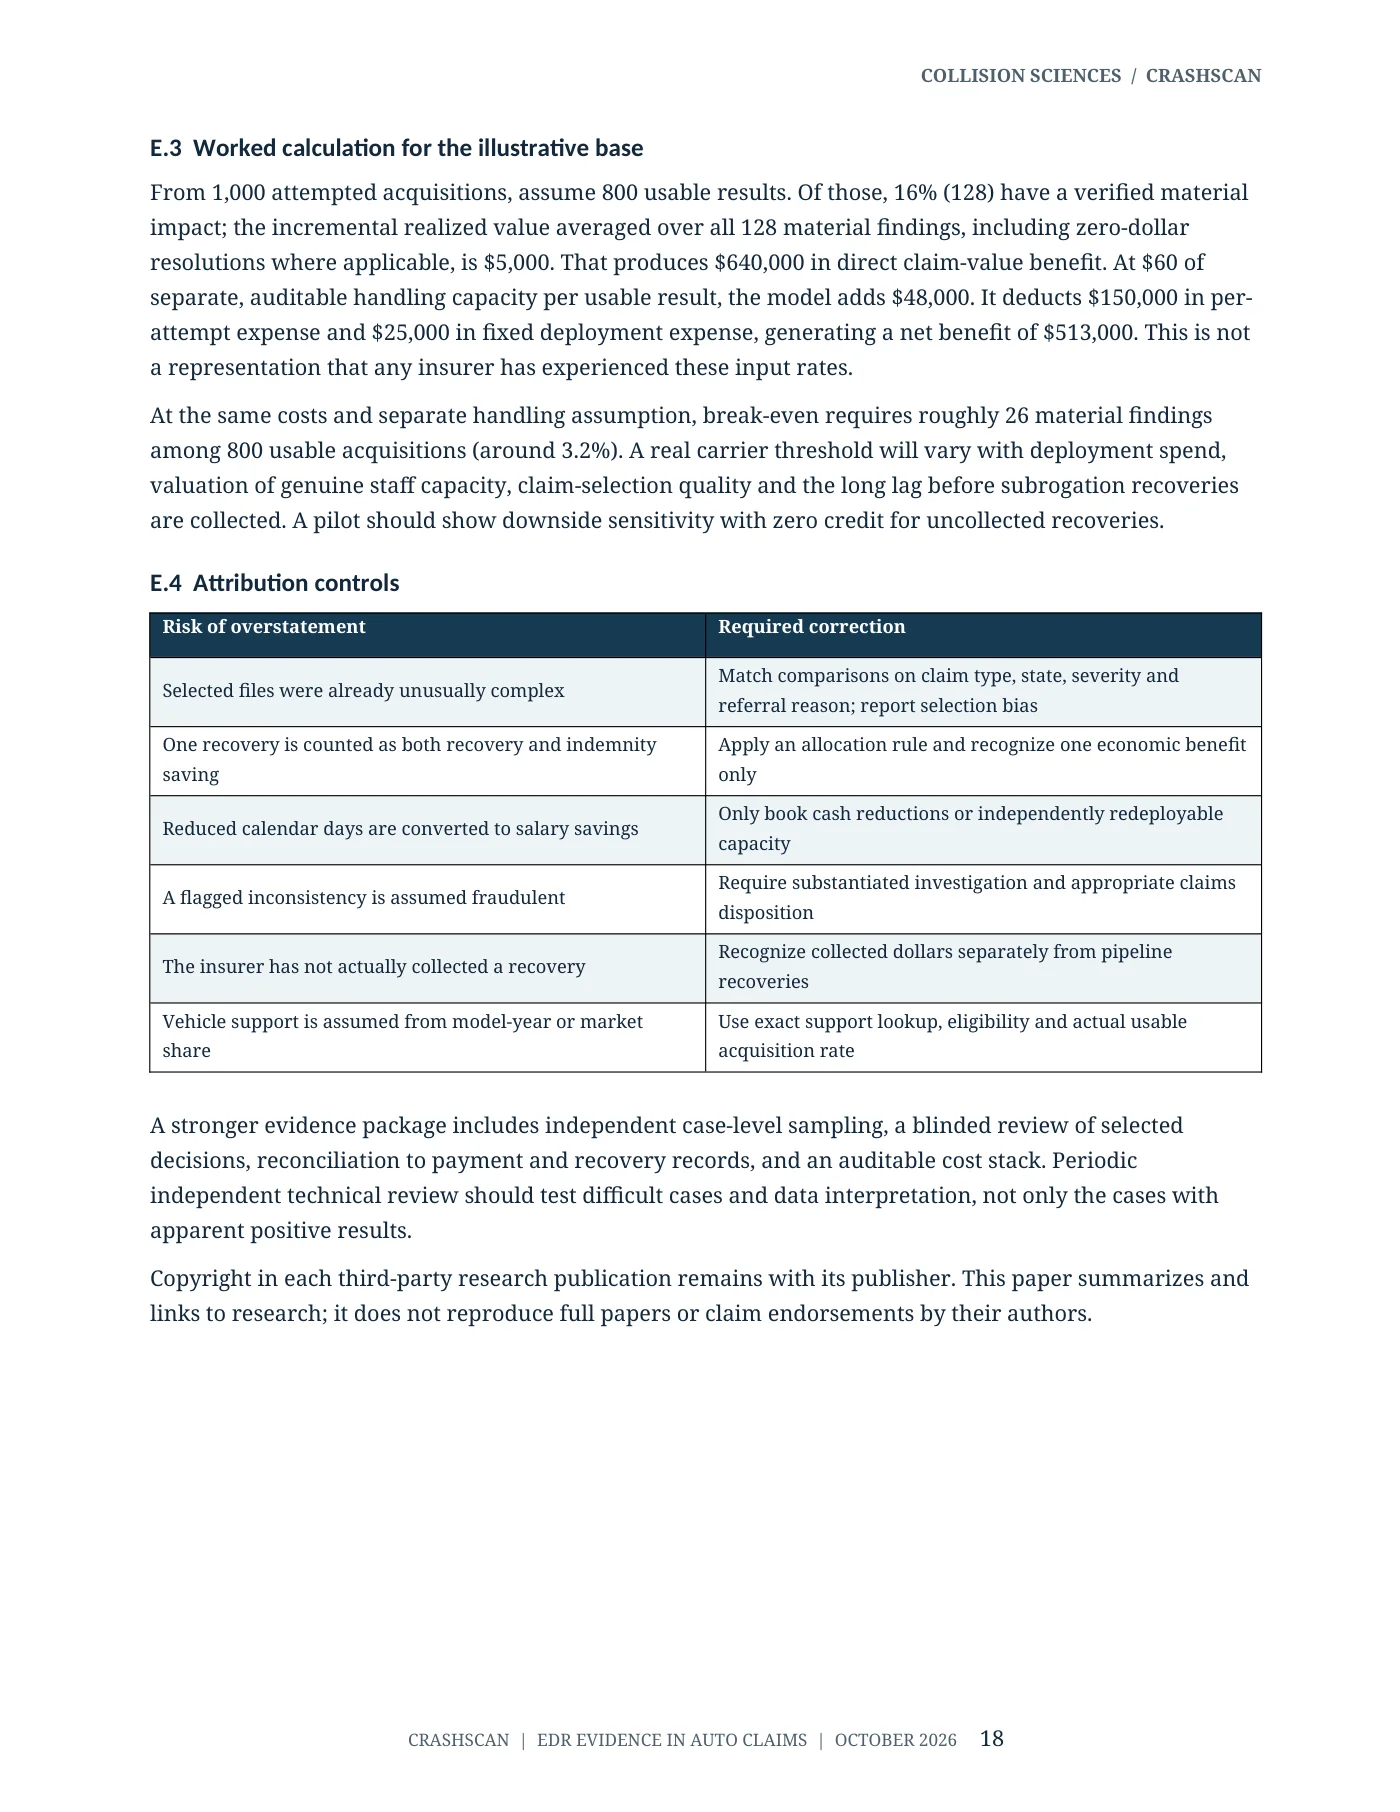
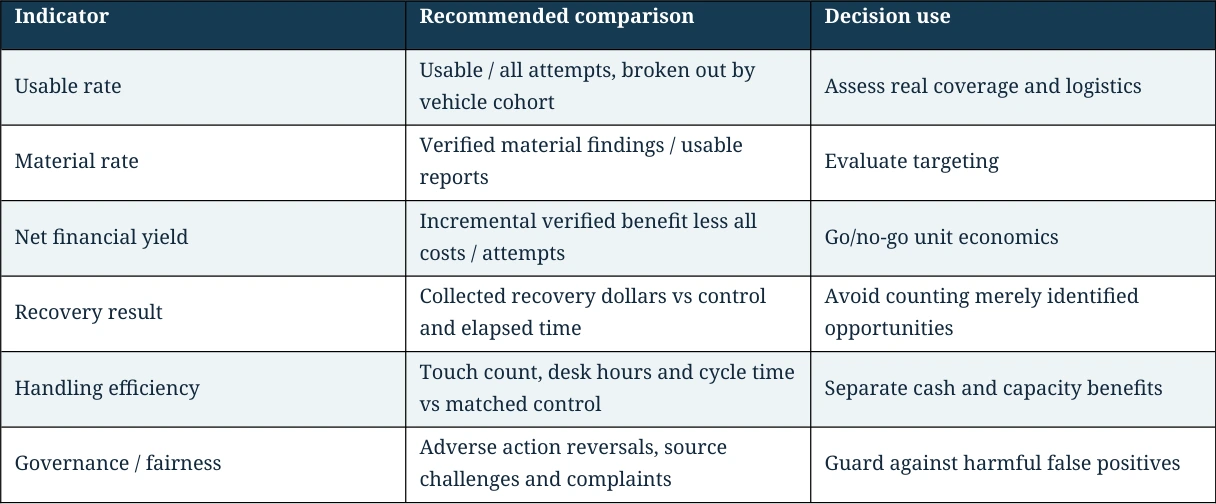
E.2. Program-level dashboard template
Read table as text
| Indicator | Recommended comparison | Decision use |
| Usable rate | Usable / all attempts, broken out by vehicle cohort | Assess real coverage and logistics |
| Material rate | Verified material findings / usable reports | Evaluate targeting |
| Net financial yield | Incremental verified benefit less all costs / attempts | Go/no-go unit economics |
| Recovery result | Collected recovery dollars vs control and elapsed time | Avoid counting merely identified opportunities |
| Handling efficiency | Touch count, desk hours and cycle time vs matched control | Separate cash and capacity benefits |
| Governance / fairness | Adverse action reversals, source challenges and complaints | Guard against harmful false positives |
E.3. Worked calculation for the illustrative base
From 1,000 attempted acquisitions, assume 800 usable results. Of those, 16% (128) have a verified material impact; the incremental realized value averaged over all 128 material findings, including zero-dollar resolutions where applicable, is $5,000. That produces $640,000 in direct claim-value benefit. At $60 of separate, auditable handling capacity per usable result, the model adds $48,000. It deducts $150,000 in per-attempt expense and $25,000 in fixed deployment expense, generating a net benefit of $513,000. This is not a representation that any insurer has experienced these input rates.
At the same costs and separate handling assumption, break-even requires roughly 26 material findings among 800 usable acquisitions (around 3.2%). A real carrier threshold will vary with deployment spend, valuation of genuine staff capacity, claim-selection quality and the long lag before subrogation recoveries are collected. A pilot should show downside sensitivity with zero credit for uncollected recoveries.
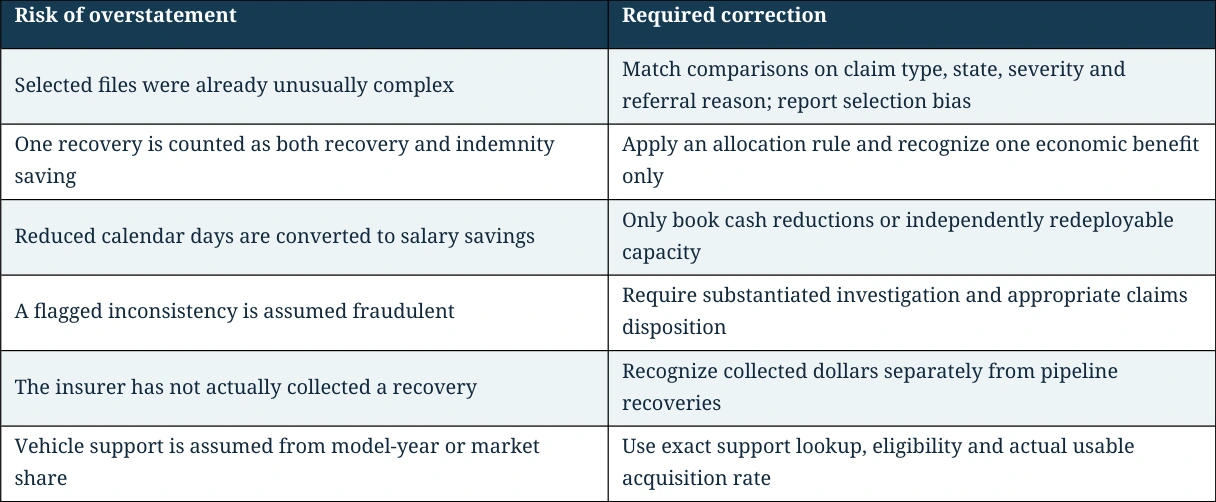
E.4. Attribution controls
Read table as text
| Risk of overstatement | Required correction |
| Selected files were already unusually complex | Match comparisons on claim type, state, severity and referral reason; report selection bias |
| One recovery is counted as both recovery and indemnity saving | Apply an allocation rule and recognize one economic benefit only |
| Reduced calendar days are converted to salary savings | Only book cash reductions or independently redeployable capacity |
| A flagged inconsistency is assumed fraudulent | Require substantiated investigation and appropriate claims disposition |
| The insurer has not actually collected a recovery | Recognize collected dollars separately from pipeline recoveries |
| Vehicle support is assumed from model-year or market share | Use exact support lookup, eligibility and actual usable acquisition rate |
A stronger evidence package includes independent case-level sampling, a blinded review of selected decisions, reconciliation to payment and recovery records, and an auditable cost stack. Periodic independent technical review should test difficult cases and data interpretation, not only the cases with apparent positive results.
Copyright in each third-party research publication remains with its publisher. This paper summarizes and links to research; it does not reproduce full papers or claim endorsements by their authors.